
- Updated:
- Published:
5 signs iGaming brands lose Market Share
The early warning lights that any iGaming brand is ceding ground almost always flash first inside its data, long before revenue lines sag.
Blask’s real-time dashboards surface those signals in five interlocking metrics: the All-Brands table that captures every competitor on the map, Brand’s Accumulated Power (BAP), Blask Index, Acquisition Power Score (APS) and Competitive Earning Baseline (CEB).
Spotting slippage in even one of them is a cue to act; missing two or more means your market share is already on the slide.
1. Your row in the All-Brands table sinks toward the footer.
Blask runs a three-stage AI pipeline that scans more than 17 000 gaming-related domains every day and reaches 95% classification accuracy.
First, a keyword engine seeds Google with dozens of core phrases in the target language — “online casino,” “sports betting,” and their long-tail variants—then harvests every URL that ranks.
Second, two specialised models go to work on each screenshot. A computer-vision detector hunts for visual tell-tales techniques borrowed from chip-counting and floor-analytics systems.
In parallel, a text-analysis model sifts for affiliate markers and review jargon.
Third, every borderline case is kicked to a human-in-the-loop queue, a strategy proven to lift web-content accuracy in academic studies. Only after that green-light does a newcomer land in the Blask Brands table, usually within 24–48h of first appearing online.
📚 Read more: How does Blask search for new iGaming brands?
💡 When your row drops because two fresh rivals have vaulted ahead, the data is telling you brand awareness is slipping before revenue does.
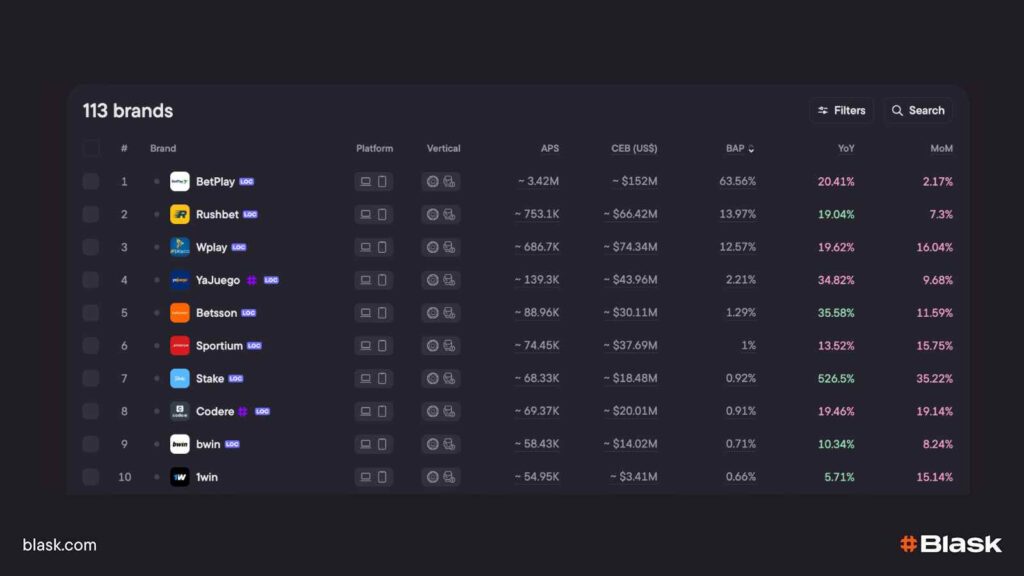
Case in point — betPawa rockets to 22.24 M APS with Blask’s “All Brands” dashboard
betPawa’s rise shows the power of Blask’s All Brands dashboard: by tracking every competitor across 17 African markets in real time, the operator pushed its Acquisition Power Score to a record 22.24M — well ahead of Betway’s 16.4 million and Bet365’s 7.7M. Read the full story.
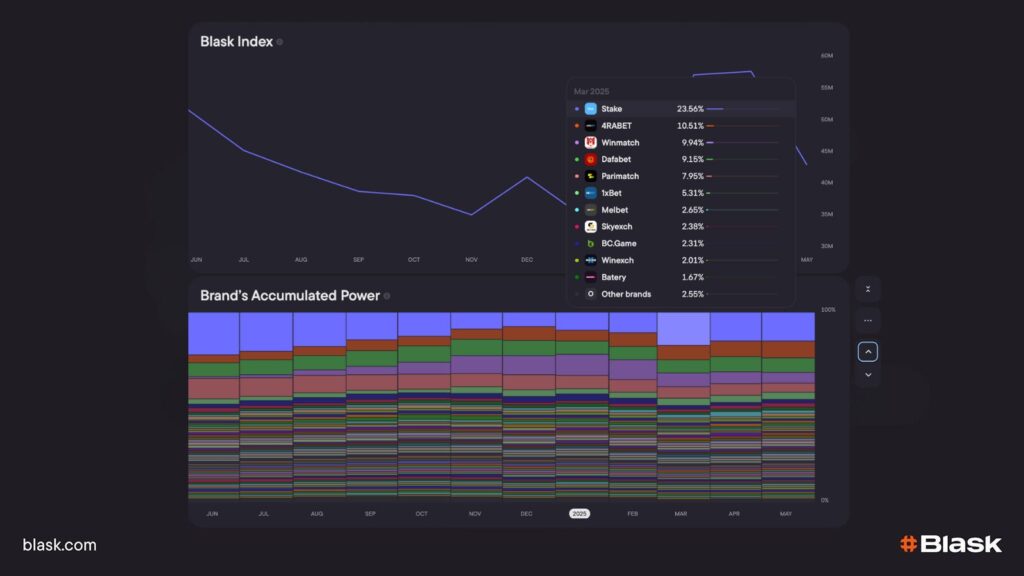
2. BAP — Brand’s Accumulated Power (what it really is and how to read it).
Blask starts with Blask Index, an hour-level feed that turns live Google-search volumes into a share-of-interest score for every operator in every market. In practice, this gives operators a live view of share of search in iGaming, with the series updating 24 × day, so the dashboard already shows a lift (or a slide) while a campaign is still on air.
💡 BAP, or Brand’s Accumulated Power, layers that hour-by-hour Blask Index with two extra lenses — sustained brand visibility and current competitive crowding — to express the total relevance a brand is compounding right now.
In effect, market share looked backward at transactions; BAP looks forward by fusing search interest, on-site engagement and category noise into one rolling number that refreshes every 60 minutes.
Because the metric is hourly, your position in the Brands table can change inside a single media flight: launch a sponsorship at 8 p.m. and watch BAP tick up by 9 p.m.; if it plateaus while rivals climb, you know the creative isn’t cutting through.
Operators use the same granularity to throttle spend before waste sets in.
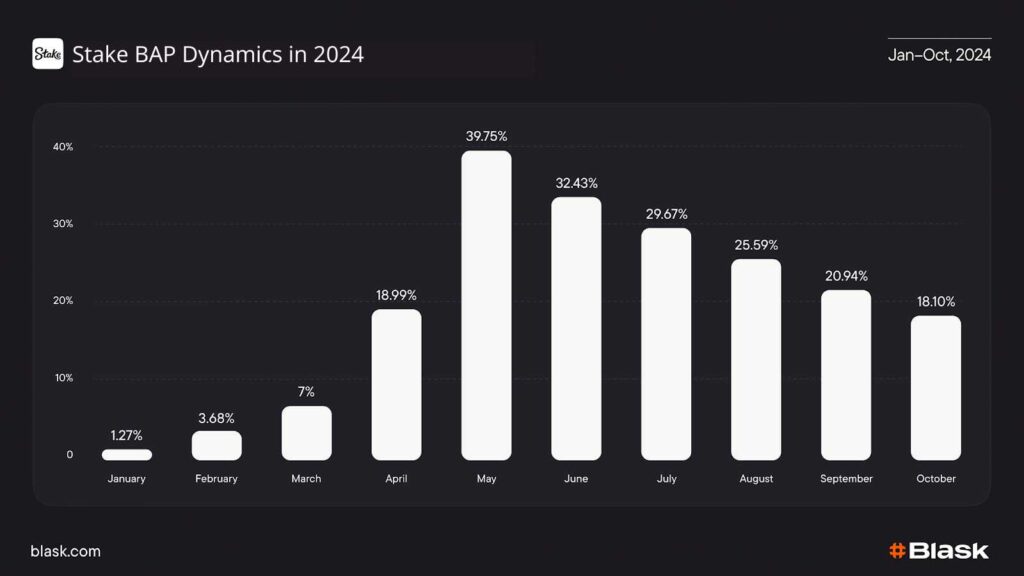
💡 Real-world proof: during the 2024 IPL season Stake’s BAP in its key cricket markets rocketed from 1.3% in January to 39.8% in May, mirroring its influencer blitz and INR-payments launch, then eased back once the tournament buzz faded — textbook evidence that BAP traces momentum as it happens, not weeks later.
How to react when BAP dips
Raise the floor, not the spike: shift from sporadic headline grabs to always-on discovery — evergreen SEO, persistent influencer deals, paid-social retargeting and secure lobby placement.
BAP rewards brands that keep the Blask Index humming hour after hour; once the curve stops dipping, compounding restarts.
🚀 Read more: BAP is all you need: transitioning from Market Share to Brand’s Accumulated Power.
3. YoY and MoM deltas swing negative.
The Blask Index converts raw Google query volume into a daily proxy for market demand. Inside the dashboard every brand and country carries two deltas:
- YoY (year on year) shows structural momentum.
- MoM (month on month) shows tactical momentum.
When both flip red — especially in a growing market — you are losing curiosity share even if absolute searches look healthy.
💡 Fix it: Diagnose timing. A red MoM with a green YoY often means seasonal drift; a red YoY points to deeper brand drift that calls for repositioning or fresh creative.
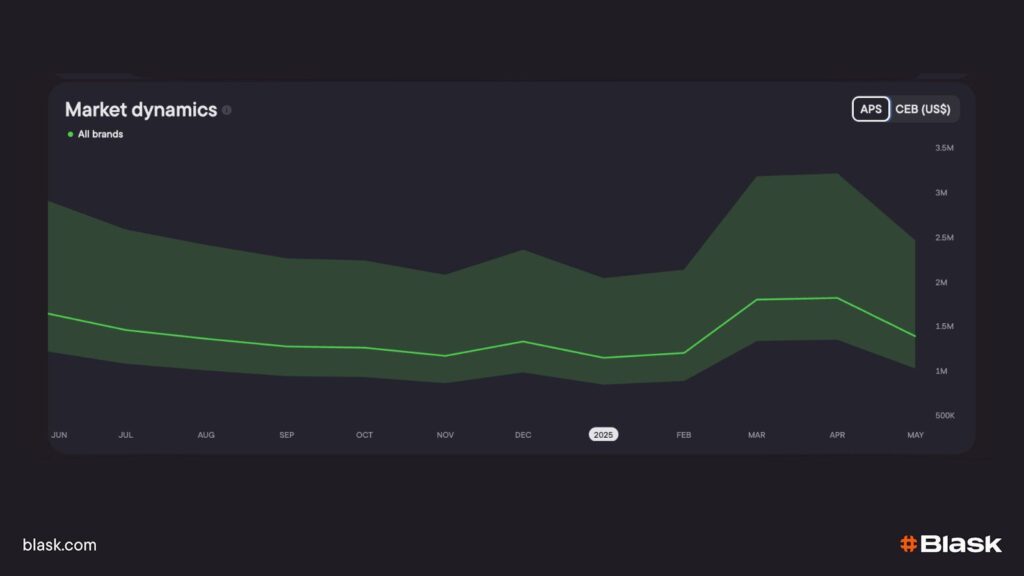
4. Your APS slips below the green zone.
Acquisition Power Score (APS) is Blask’s monthly audit of a brand’s capacity to turn current awareness into first-time depositors. Among Blask’s core casino brand performance metrics, APS is the clearest signal of whether demand is actually converting into acquisition.
Behind the scenes, Blask’s AI blends the past month’s hour-level Blask Index curve with external demand signals – social buzz, app-store traffic and other open-source indicators – to compute how many new players you could have won if your funnel were firing on all cylinders.
Because the model closes its data window at month-end and publishes in the second week, the APS you see at the beginning of June reflects opportunities you had in May.
The dashboard ranks every brand into three coloured bands – worse, average, better – so you can judge performance at a glance.
Upper then green zone means you converted near the ceiling implied by market demand; under the “worse” signals that traffic noticed you but opened wallets elsewhere.e.
How to use it.
- Bench-check against your own FTD log. Pull last month’s first-time-deposit count from internal analytics and line it up with the APS green zone.
If your real FTDs sit below the red floor, you’re leaving money on the table; if they exceed the upper green bound you’re beating model expectations – time to raise the bar rather than the spend. - Benchmark versus nearest rivals. Sort the All-Brands table by APS and compare your score with peers of similar size.
A gap of one band or more tells you exactly which competitor’s onboarding flow, bonus cadence or localisation is stealing share – and whose playbook to dissect first.
💡 Fix it: Failing APS is seldom a media-budget problem; it’s a funnel-physics problem. Strip sign-up friction, clarify welcome-offers and localise payments until next month’s score shifts from red to amber – then keep climbing to green.
👉 Read more: Leading the shift: ushering in APS & CEB for a new era of brand performance
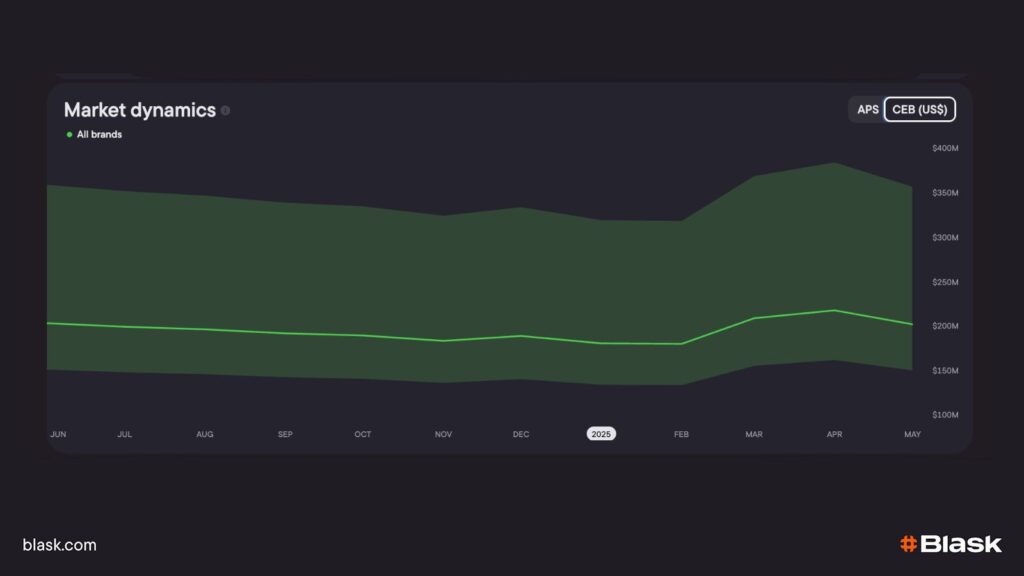
5. When Competitive Earning Baseline (CEB) drops below reality—or below your rivals.
Blask’s Competitive Earning Baseline (CEB) is a forward-looking gauge of how much gross gaming revenue your brand should generate the previous month, given its current brand power and the economic reality of the market.
An AI model fuses the hour-level Blask Index, BAP and APS with external factors such as regulatory friction, disposable-income trends, social chatter and competitor yield reports, then publishes a fresh three-band range — worse · average · better — in the second week of every month, covering the previous calendar month.
CEB is denominated in USD and looks forward, giving both single-brand and country-level stakeholders a transparent benchmark for revenue potential that is agnostic to vertical or geography.
How to read — and act on — CEB
Step 1 – Match reality to the band. Drop last month’s GGR onto the chart:
- Upper the better zone you’re monetising at the top of market capacity; celebrate and systemise.
- In white average you’re on par but still have head-room—optimise product mix, VIP ladders or payment UX; studies show that one extra KYC step can trim 20-30 % off sign-up conversion.
- Under the worse zone you’re leaving money on the table; act fast by tightening retention, boosting ARPU and reviewing promo ROI.
Step 2 – Stack your CEB against peers.
Filter the All-Brands table to your weight-class operators. If a rival posts a higher CEB yet carries lower BAP or APS, you own the reach, they own the yield—signal to deepen monetisation. If their CEB dwarfs yours, expand geography or add high-margin verticals before the next licensing window closes.
Step 3 – Track the trend, not the point. Because CEB is monthly, use it for quarterly planning: stabilise GGR ≥ midpoint of the band, then chase band growth itself by lifting BAP (brand reach) and APS (funnel power).
💡 Bottom line: CEB is the monetary ceiling your current brand power can hit next month. Keep GGR inside the green, grow the band with stronger BAP and APS, and you’ll know — before the quarter closes —whether revenue is on track or at risk.or tighten the profit taps that already run.
📚 Want to read more use cases? Read how do iGaming operators use Blask
Quick reference: where each metric lives in Blask.
Blask condenses thousands of live signals into five headline metrics that sit in predictable places on the platform and fire at different speeds.
If you’re asking how to track competitors’ brand growth, treat the table below as your on-screen checklist: glance once a day for the hourly movers, once a month for the capacity gauges, and once a quarter for the long-money view.
| Dashboard block | What to watch | When to react | Why it matters |
|---|---|---|---|
| All-Brands table | Any rank slip after the latest crawl (updates hourly) | Immediate – hours, not days | A sudden drop means fresh rivals have leap-frogged you or an existing brand just surged in search interest. |
| BAP line-chart | Two consecutive 24-h prints below the category average | 1–3 days | Brand’s Accumulated Power blends the hourly Blask Index stream with sustained visibility and crowding, so a quick dip shows you’re losing compounded attention before sales feel it. |
| Blask Index YoY / MoM | Both deltas turn red while the market’s Index is flat or rising | 1–2 months | YoY flags structural relevance; MoM catches tactical swings. Dual-red means curiosity share is eroding even if absolute queries look fine. |
| APS gauge | Reading drops under the worse band at the new monthly refresh | Within the month | Acquisition Power Score is re-calculated once a month from Blask Index + third-party signals; falling short means demand exists but your funnel leaks. |
| CEB compare | (a) Your GGR prints below your own CEB band, or (b) your CEB band trails peer median | Quarterly planning | Competitive Earning Baseline forecasts revenue capacity from outside-in factors; if GGR < CEB you’re under-monetising, if CEB < peers you’re under-positioned for future growth. |
See two warning lights at once? Time to act.
Blask surfaces the drift; only you can close the gap. Book a demo and benchmark your five critical signals before market share walks out the door.