TL;DR
Manual analysis can still catch nuance. But in 2025, it loses the war on speed, scale, and timing. The teams that win don’t choose “AI or humans” — they build a workflow where AI finds the signal hourly, and humans turn it into decisions today, not next quarter.
From ledger books to laser-fast algorithms
In iGaming, numbers aren’t decoration — they’re oxygen.
Back when the sector was young, operators handled that oxygen by hand: CSV exports, pivot-table marathons, and ad-hoc surveys that caught a snapshot of player behaviour weeks after it changed.
“The industry has always run on data,” one veteran COO told us, “but the early process was 90 % grit, 10 % insight — and 100 % error-prone.”
Then “good analysis” stopped being the best analysis.
It became the fastest correct analysis.
Spreadsheets don’t run in real time. Markets do.
AI arrives — and flips the script.
AI didn’t just speed things up. It changed what teams expect from data.
Instead of: “What happened?”
The new standard is: “What’s happening right now… what happens next… and why?”
Blask’s co-founder, Max Tesla, frames it like this:
“Operators aren’t short of data; they’re drowning in it. The winners will be the ones who turn that flood into foresight in seconds, not quarters.”
Blask’s own stack ingests public search signals, device telemetry, and competitive movements every hour, then pushes a ranked “battle table” of all brands live in each market.
🔗 Read more: What is Blask and how to use it to navigate through iGaming industry.
A job that once blocked analysts for two weeks now runs while you fetch coffee.
Where AI flat-out beats manual methods.
| AI advantage | Real-world lift (Blask & industry data) |
|---|---|
| Raw speed | Fraud-detection latency ↓60 %; churn risk scored in milliseconds. |
| Hyper-personalisation | Retention ↑39 % when bet builders & promos adapt to each session. |
| 24/7 fraud shields | Payment fraud ↓48 % via pattern-recognition models. |
| Effortless scale | Launch in a new GEO without adding headcount — data pipelines auto-expand. |
| Hour-by-hour market vision | Blask Index refreshes every 60 min, exposing brand surges or dips before rivals notice. |
🔗 Deep dive: See how Blask Index quantifies market volume with 95 % accuracy.
Why some teams still swear by manual work.
Manual work survives because it still wins in a few important moments.
- Nuance and local context.
A human can connect cultural seasonality, local payment behaviour, and “why this story matters” faster than a model that hasn’t seen it before. - Sanity checks in edge cases.
Brand-new regulation, sudden payment disruption, or a market that behaves unlike its history—humans catch overconfident model reads. - Ethical governance.
AI can optimise too aggressively if nobody sets boundaries. Humans provide the throttle: “Yes, this converts” vs “No, this is harmful / non-compliant.”
In other words: humans still matter.
They just shouldn’t be doing the slow parts.
The real problem: charts get noisy when the market gets loud
Here’s what many teams experience:
- Big sports events, launches, promo cycles → Blask Index spikes
- The graph becomes jagged
- People argue in Slack: “Is this real growth or just a weekend bump?”
That’s exactly why Blask Trends (Macro-Dynamics) exists.
Blask Trends: the signal behind the noise
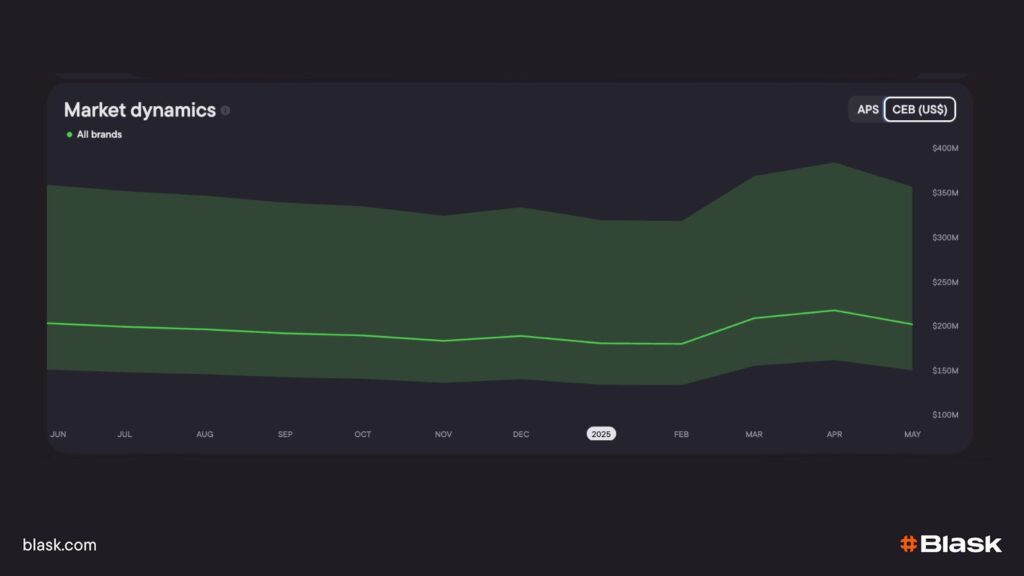
Blask Trends is a view inside the Blask Index widget designed to suppress extremes and smooth short-term volatility—so you can read the underlying direction.
It gives you two things executives actually want:
1) A clean Trend line + stable baselines
Alongside the smoothed trend, you can compare against AVG (mean) and MED (median) values for the period—so “normal” has a definition, not an argument.
2) A market state you can act on
Blask classifies the current regime into:
- Growth
- Stagnation
- Decline
This is the difference between “we saw a spike” and “we’re in a growth regime.”
You can toggle Trends on/off and set it as the default view in the widget.
When you need “why”: Market Explanation
Even with Trends, teams still ask the key question:
Why did the market move?
Manual analysts often spend days connecting dots: sports calendar shifts, holidays, payment friction, regulatory actions, media pushes.

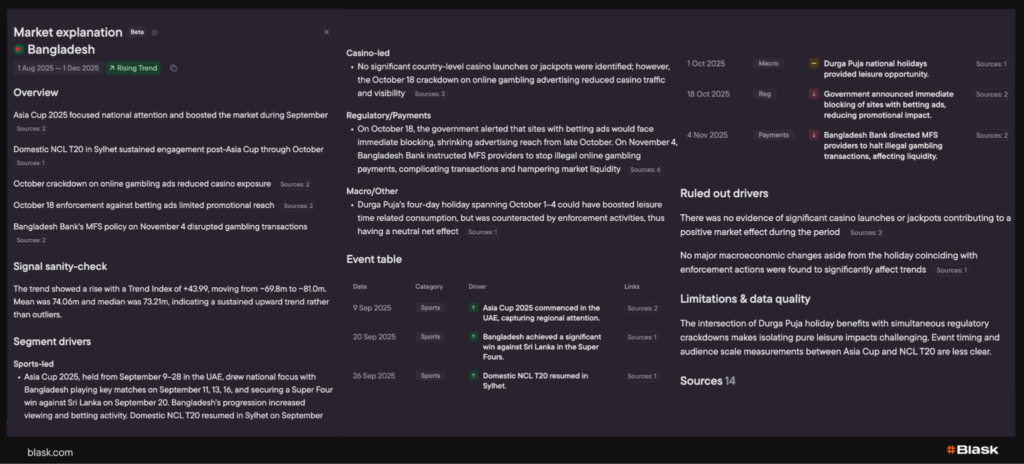
Market Explanation compresses that work into a structured narrative:
- flags inflection points
- maps likely drivers (sports / casino seasonality / payments / regulation)
- provides a source-backed event table and sanity checks
So your team stops reverse-engineering the chart—and starts using it.
Tomorrow’s battlefield: real-time or bust.
Research house IDC pegs the global AI market at $930 billion by 2028. Within iGaming, three trends will separate leaders from laggards:
- Instant personalisation — odds boosts, bet suggestions, and RG nudges tuned to the micro-moment.
- Predict-then-prevent RG tools — early-warning scores lock risky accounts before harm, satisfying tougher regulators.
- Market-wide transparency — platforms like Blask revealing every brand’s APS (Acquisition Power Score) and CEB (Competitive Earning Baseline) in public dash-boards — making secrecy obsolete.

Final whistle
The question is no longer “AI or manual?” but “How quickly can we blend both?”
Speed, scope, and predictive precision are AI’s home turf. Context, creativity, and ethical judgement remain human.Master the mix, and you’ll convert data from static cost-centre into the most lethal weapon in iGaming’s competitive arsenal.
“In the data duel, the side with the sharper insight wins. AI loads the chamber; people pull the trigger.” — Max Tesla, Blask

