- Updated:
- Published:
iGaming analytics: data-driven marketing strategies for operators
Most iGaming marketers still win or lose on the strength of hunches: “Brazil feels hot”, “Influencers always pay back”. In a market where paid-media CPMs keep climbing and bonus burn eats margin, gut feel is no longer cheap enough to risk.
Blask knits five live metrics into four cascading dashboards, so every decision, from choosing a new license to swapping a tile in Row 1, is tied to measured upside. This article shows how to use each view in sequence, then combines them into repeatable campaign templates.
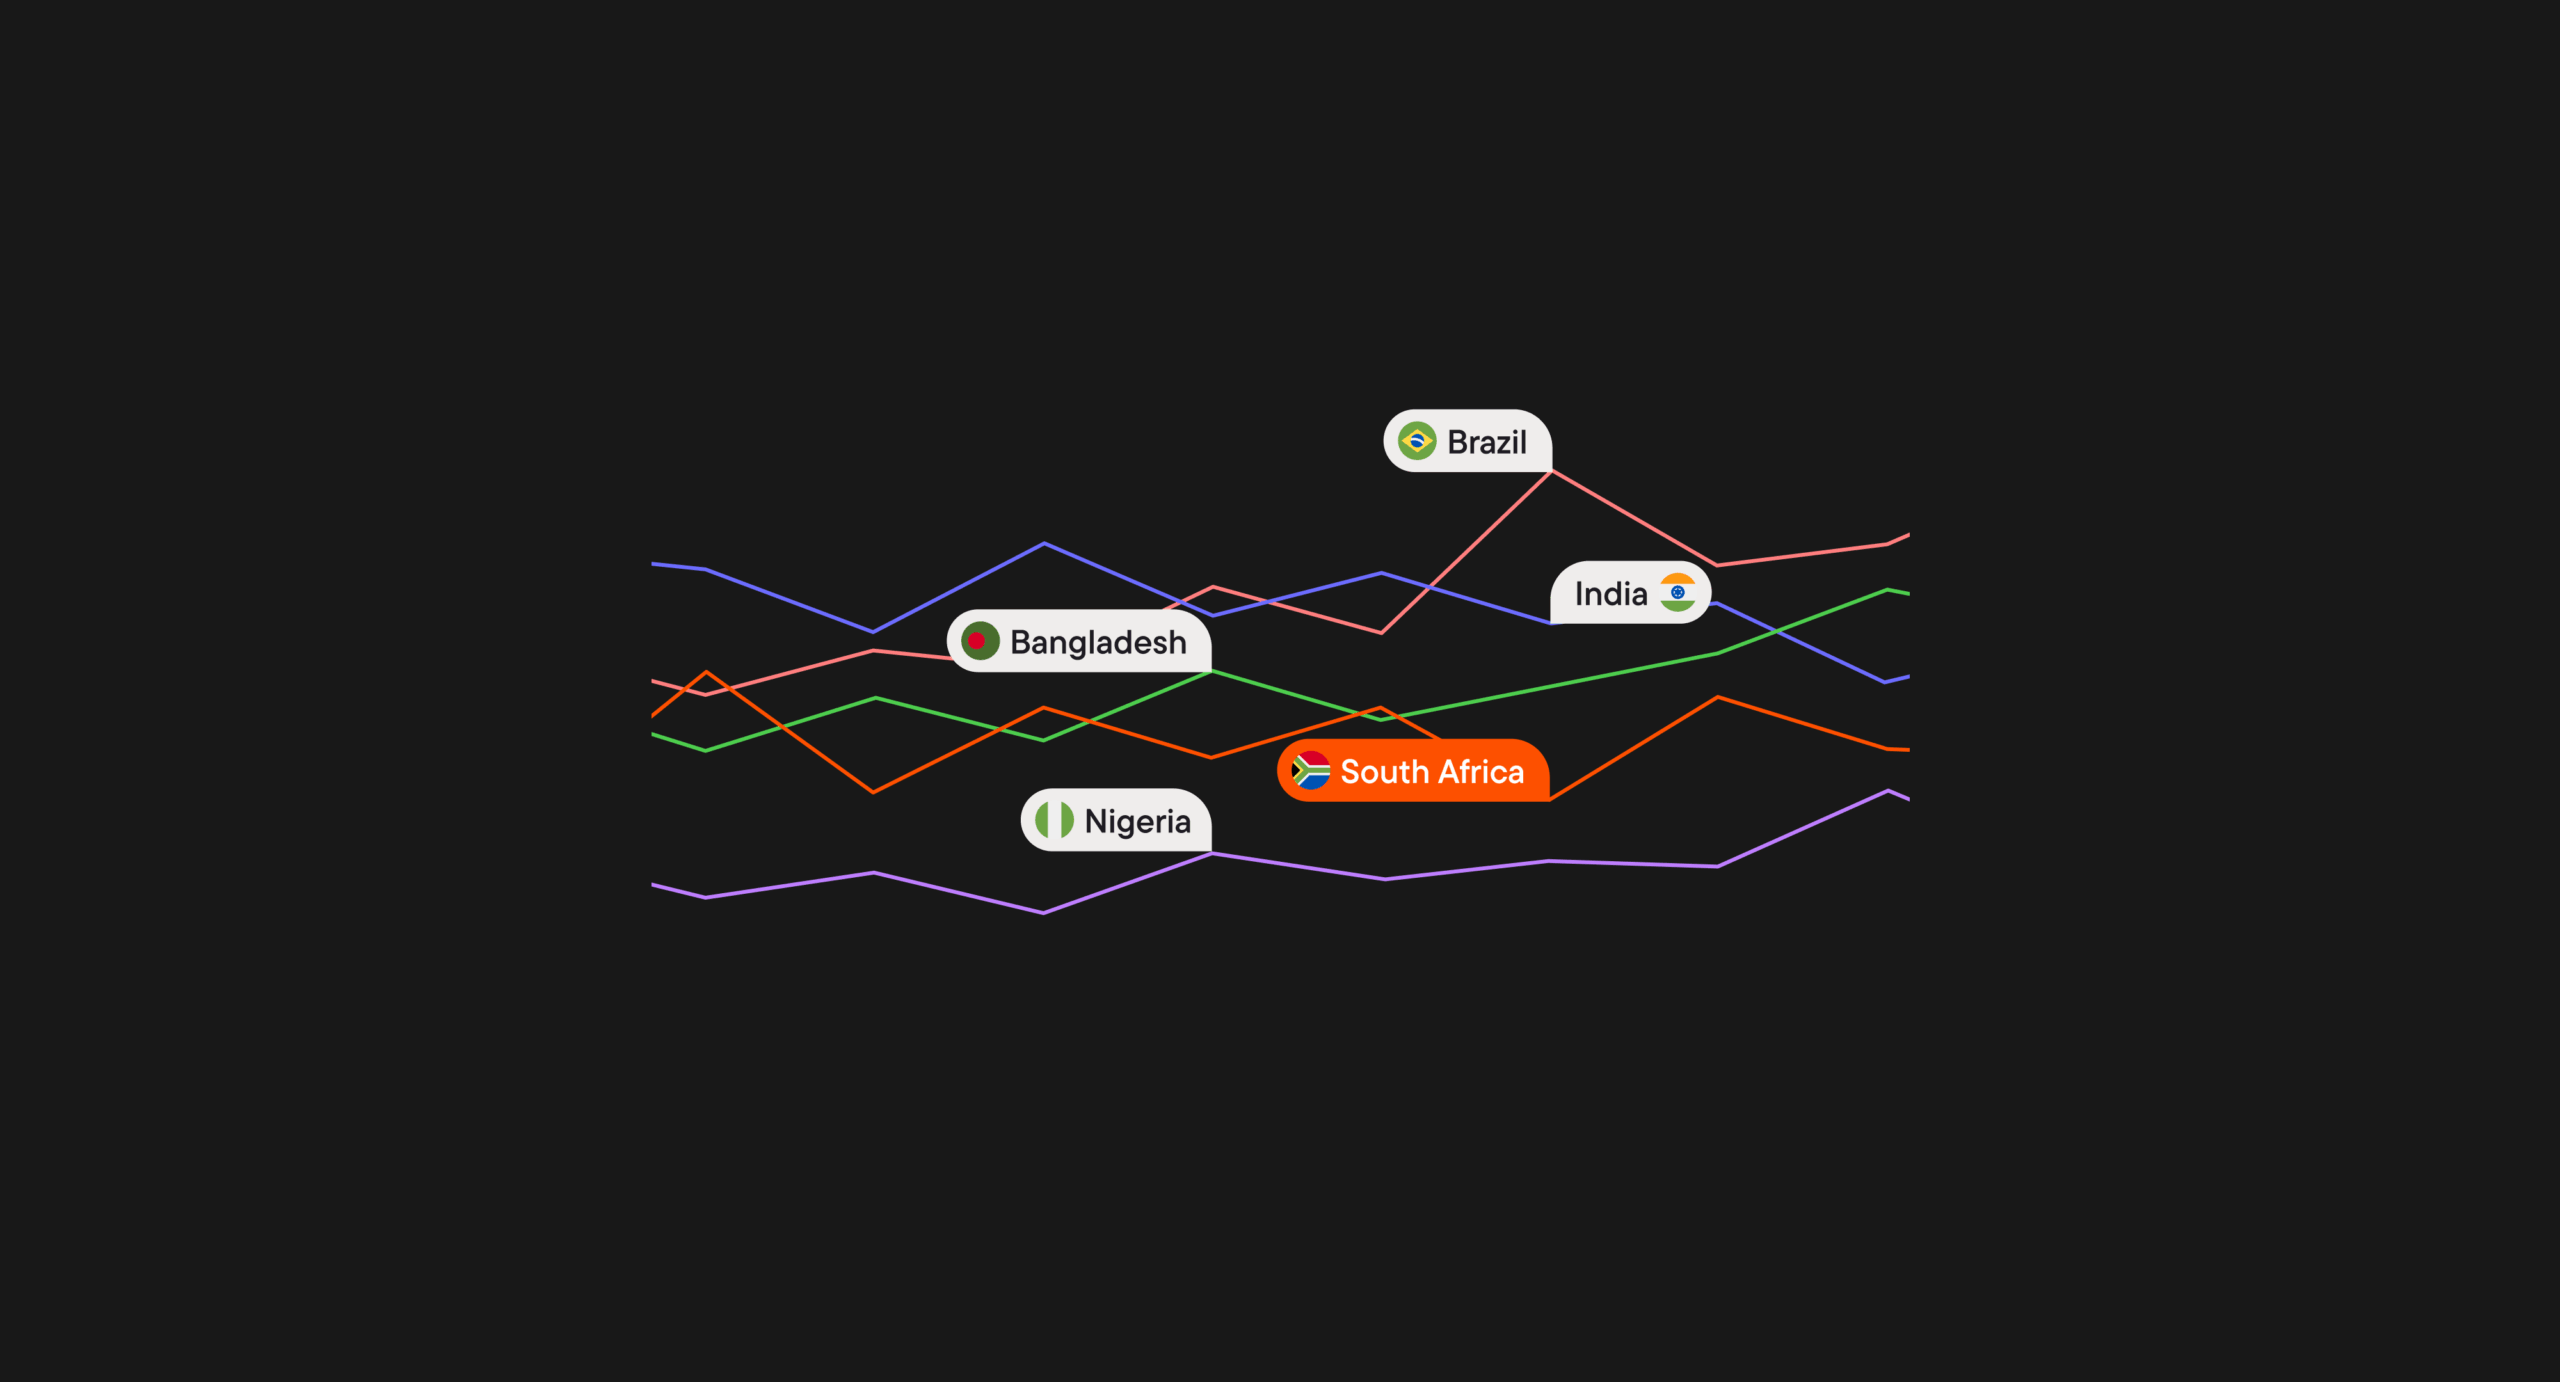
Pick the right battlefield with Countries.
Open the Blask Countries dashboard and sort the table by month-on-month Blask Index growth.
✨ When Bangladesh posted a 34% Index jump while operator count still sat below forty, early movers shifted ten per cent of paid budget from India and captured a 25% revenue lift in the very first month.
📚 Get started: What is Blask?
Reverse logic works too: Kenya’s Index flattened for three months as new licence holders piled in. Brands that noticed re-allocated spend to retention perks and protected ARPU while latecomers fought ever-dearer CPAs.
What you can find:
- Top-5 spotlight – In one glance you learn which geos promise fresh sign-ups and revenew.
- Demand momentum – Blask Index chart traces search interest for the markets. A rising line means appetite is still expanding; a flat or sagging curve warns that enthusiasm is cooling.
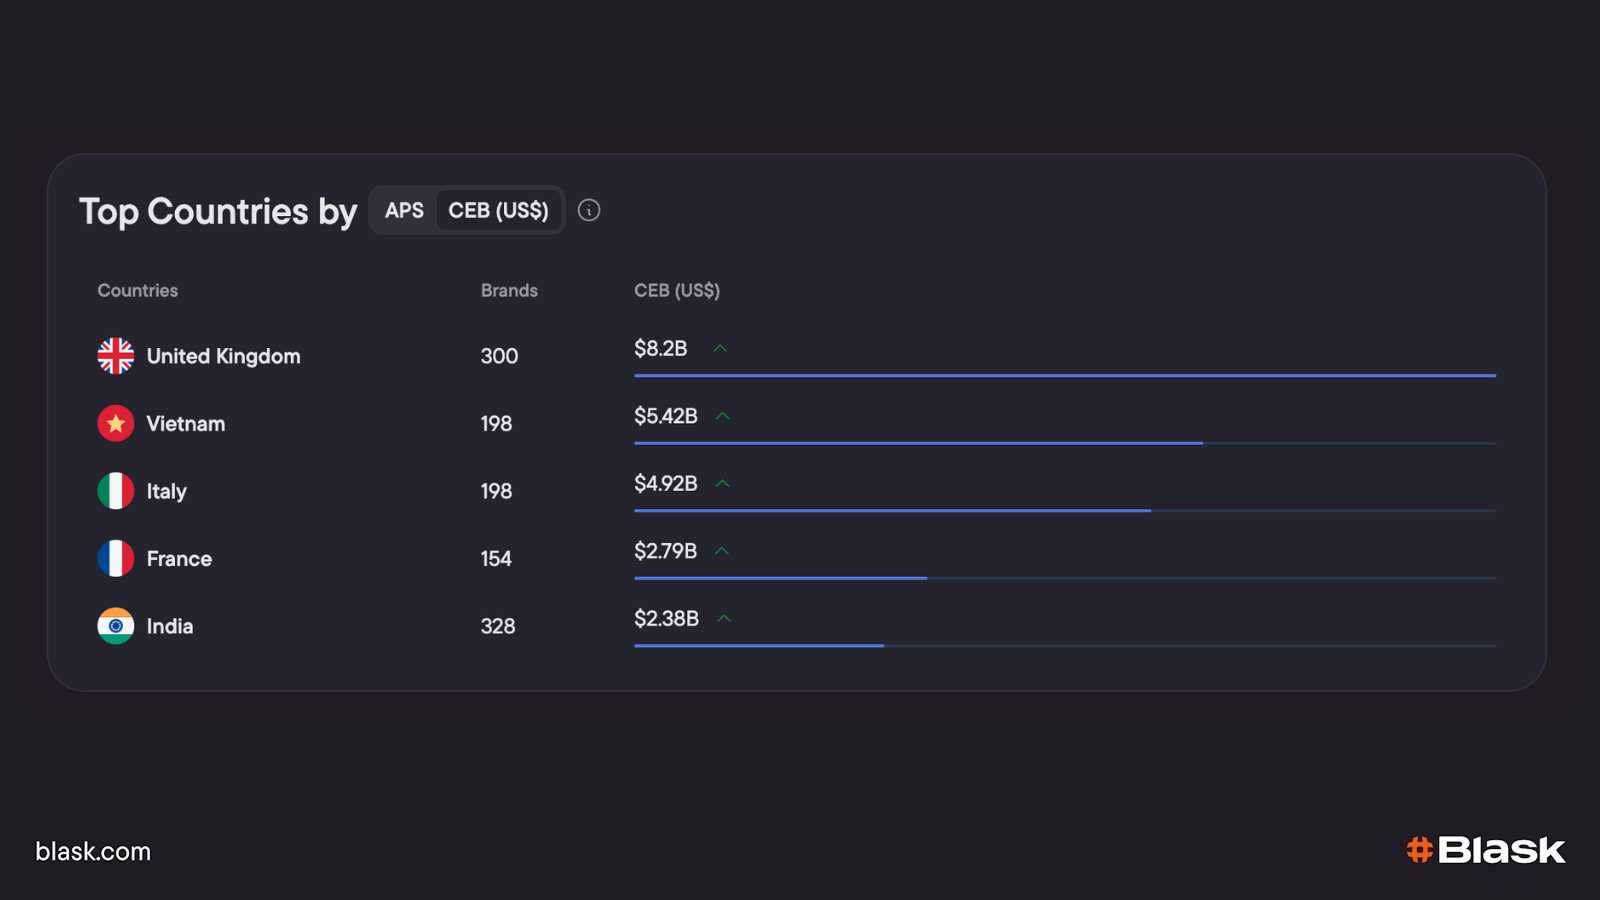
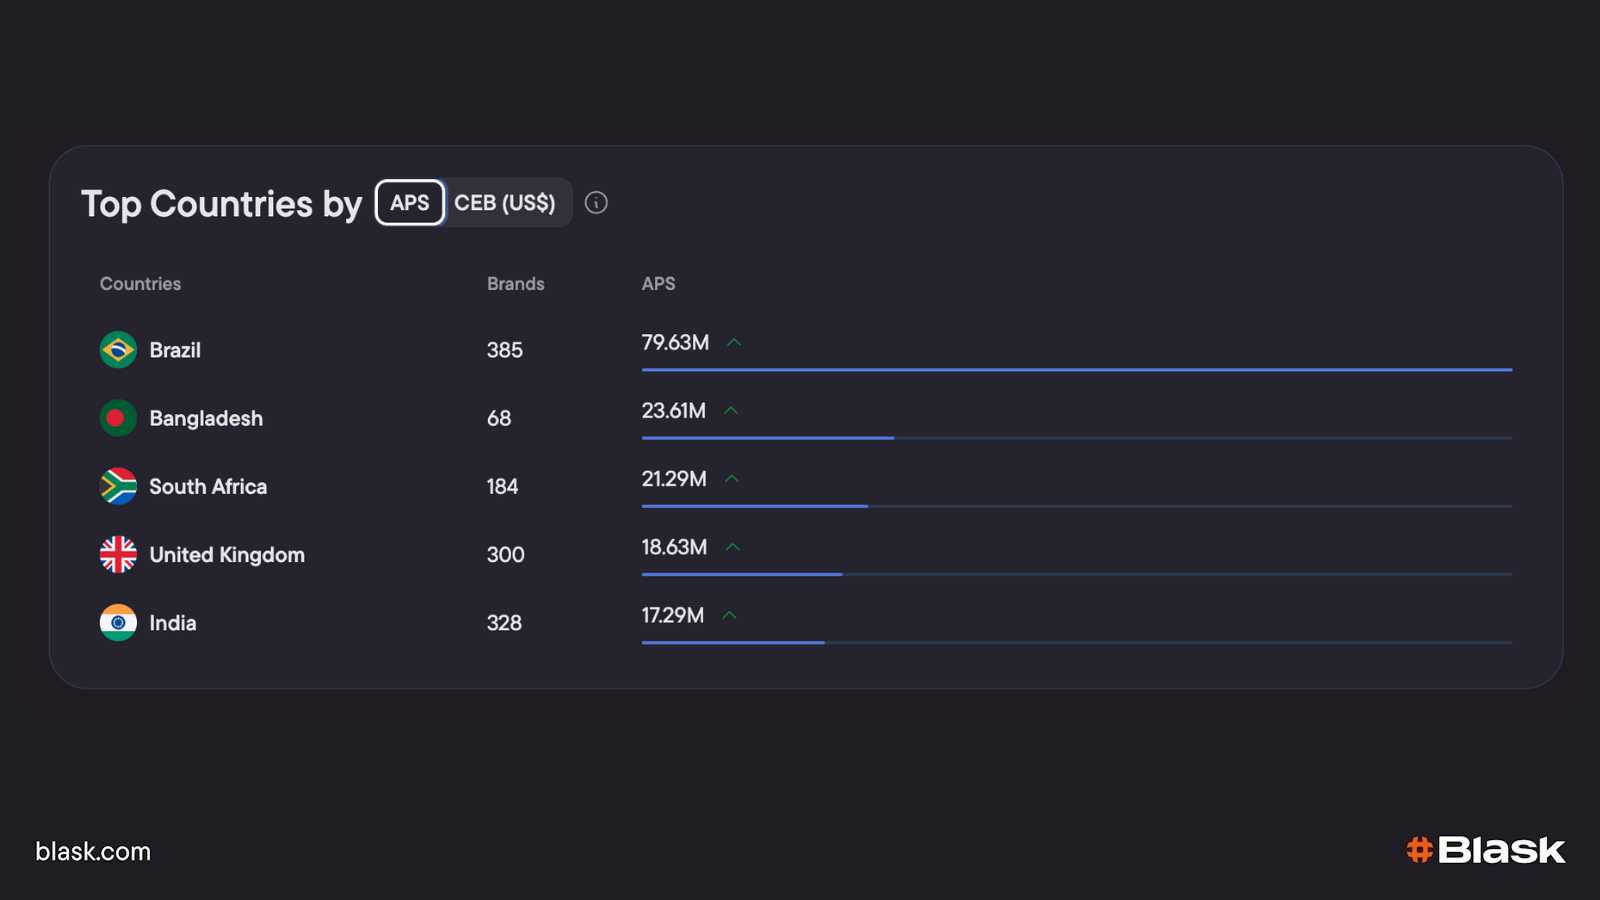
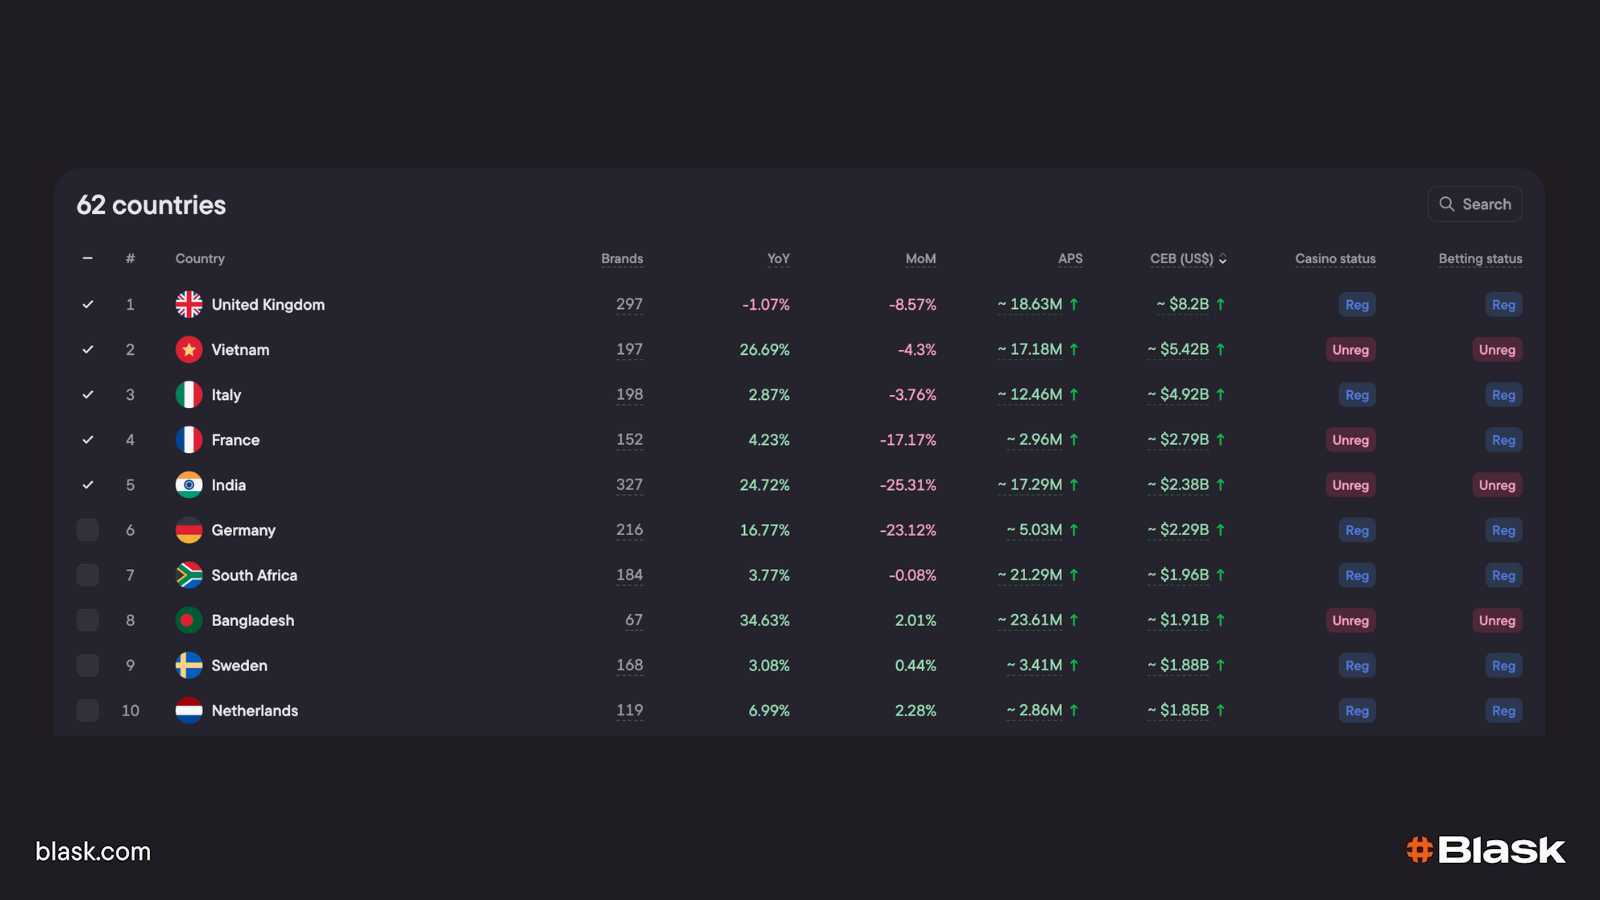
- Full market grid – The table that follows combines active-brand count, YoY and MoM Index growth, national APS, three-lane CEB revenue bands and licence status for every country Blask tracks.
CEB — Competitive Earning Baseline
Competitive Earning Baseline — a monthly, AI-generated GGR “target corridor” (Worse │ Average │ Better) showing how much revenue those newly acquired players ought to have produced. It’s your forward-looking benchmark for monetisation efficiency.
Market Overview — your daily cockpit for rivalry and revenue.
Market Overview refreshes every morning, giving operators, suppliers, and affiliates the same at-a-glance reality check.
📖 Learn more: Blask’s Market Overview page
A live Blask Index chart at the top shows how demand for any group of brands has moved hour-by-hour or day-by-day; beneath it the BAP bar reveals which logos dominate share-of-voice right now.
BAP — Brand Accumulated Power
Brand Accumulated Power is the share of all search, social and direct traffic that your logo commands inside the chosen country, refreshed every day. In Market Overview it appears as a horizontal stack where every slice sums to 100 percent, so a one-point shift is literally a point of market mind-share gained or lost. When a challenger’s slice in Brazil slipped from 12 % to 9 % while the national Blask Index stayed flat, managers knew awareness—not demand—was the problem and pivoted spend toward loyalty perks instead of higher CPAs.
Scroll and two paired curves appear: APS, a back-dated count of the first-time depositors last month’s visibility should have delivered, and CEB, a green corridor showing what those players ought to have earned in GGR.
A sortable table rounds out the view with every competing brand’s Index, BAP, APS, and CEB deltas, so you can rank winners and laggards in a single click.
APS — Acquisition Power Score
Acquisition Power Score (APS) — a back-dated KPI published on the 10th of each month that tells you exactly how many first-time depositors you should have landed in the month just closed, given your visibility (BAP + Blask Index), marketing mix and known funnel friction.
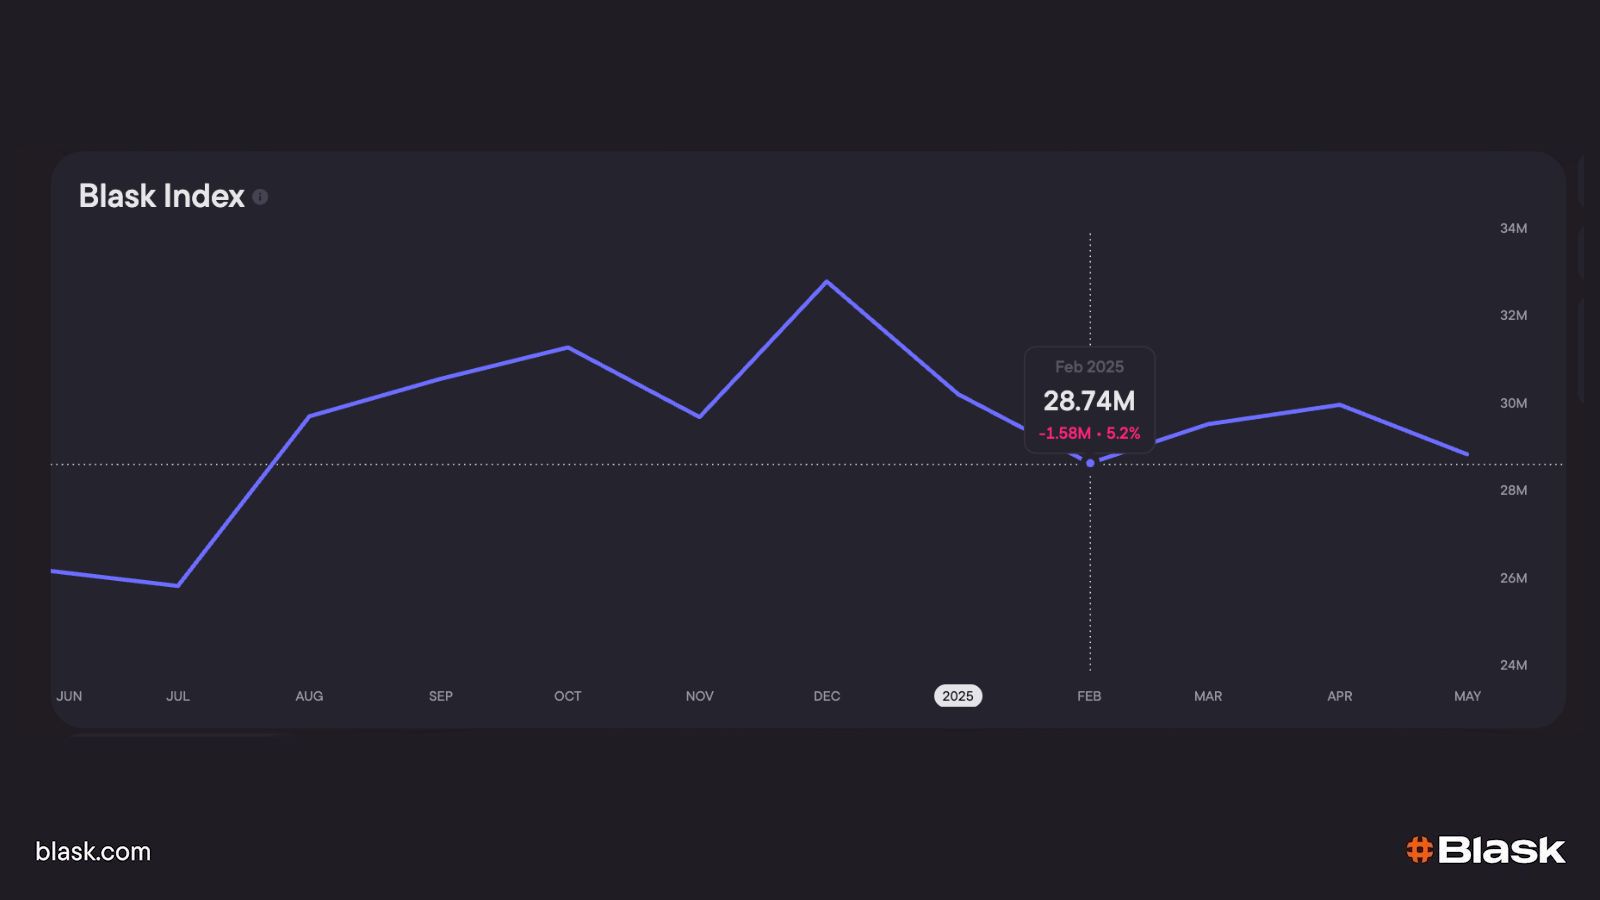
Blask index

APS
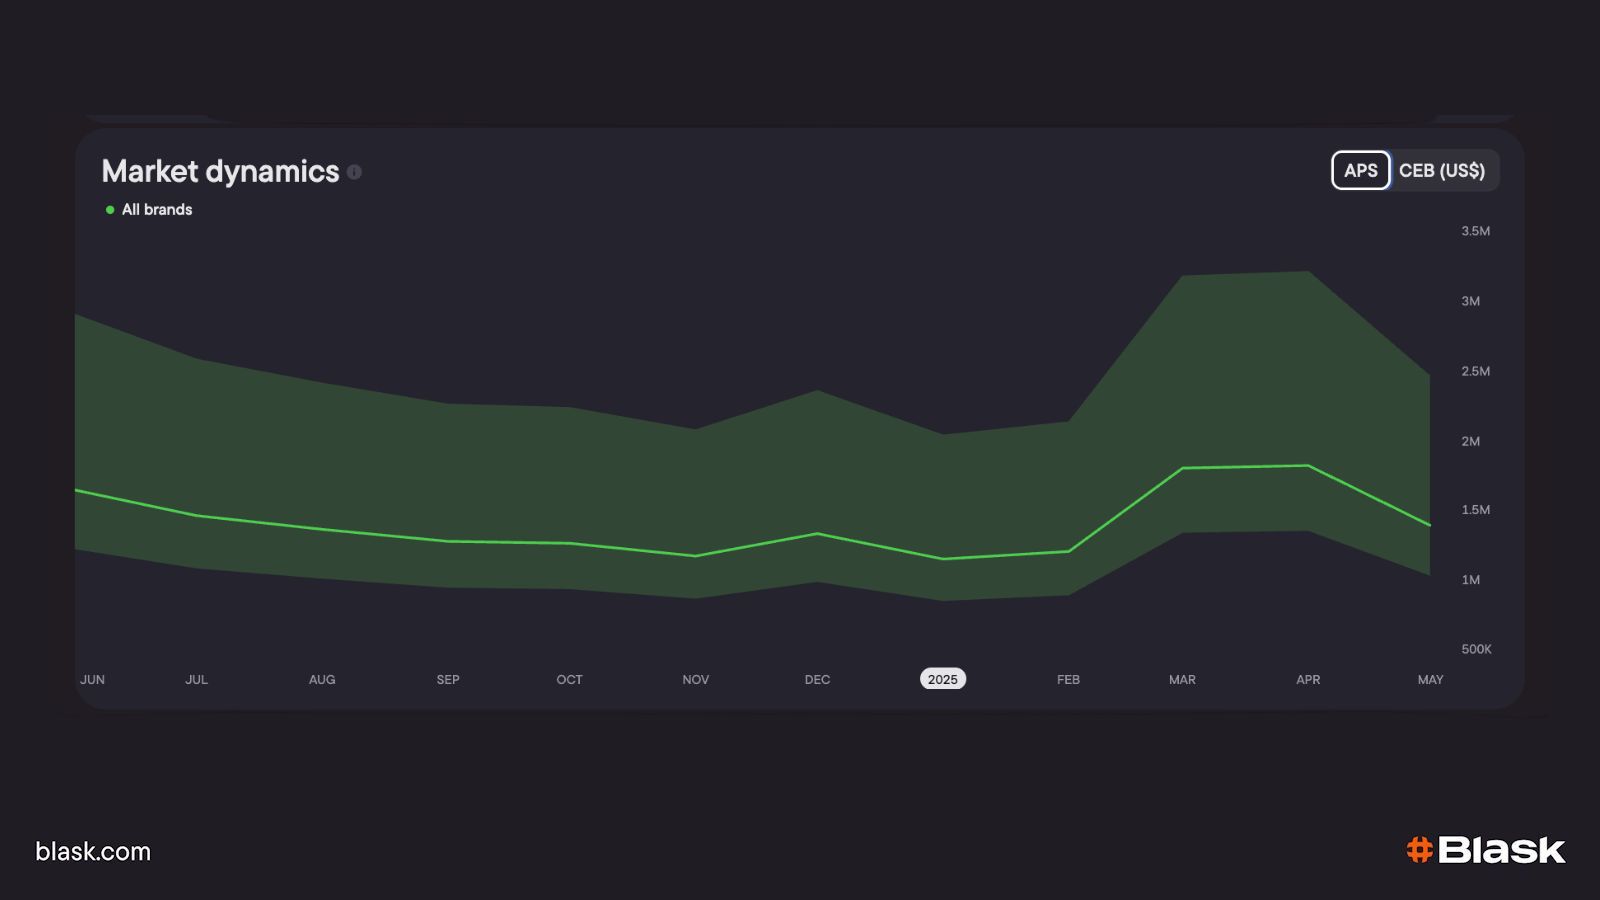
CEB
📖 Read more: BAP is all you need
Read the board, out-play the crowd
- Brazilian challenger loses share: BAP slip 12% → 9% while national Index is flat → new entrants stealing awareness. Team pivots from Google spend to double-XP missions and weekend VIP odds boosts, stabilising churn before revenue falls.
- Poland’s monetisation leak: APS lands on target but GGR drops below CEB Average → post-deposit funnel failing. Operator tightens bonus-abuse rules and surfaces higher-RTP table games; CEB gap closes within two weeks.
- Peru’s hidden acquisition slide: APS dips yet GGR sits safely inside CEB band thanks to whales → volume problem masked by high spenders. Marketing reopens the funnel with softer KYC and refreshed welcome packs to rebuild new-player flow.
Check the momentum in the Market analytics page
Signals, not spikes: Blask Index Trends
Blask Index is unmatched at capturing real-time market interest, but real time comes with a tax. During major events, launches, and promo cycles, short-term spikes can make charts look “busy,” hiding the underlying direction.
That’s why the Blask Index widget now includes Trends: a view that highlights the market’s directional regime at a glance — Rise, Fall, or Flat — so you can tell whether you’re looking at a real shift or just a loud weekend.
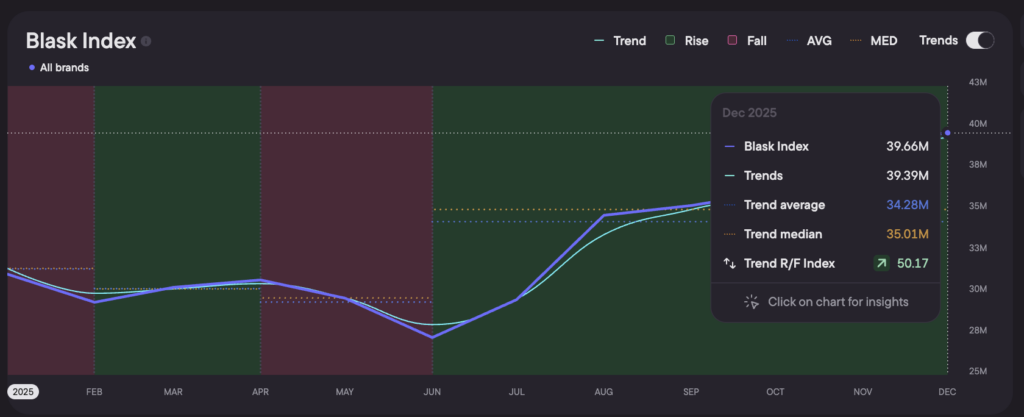
How to use it:
- If Trend is rising, you’re in expansion mode: acquisition tests and new launches are more likely to pay back.
- If Trend is flat, don’t overreact: focus on efficiency (funnel, creative, retention) instead of brute-force spend.
- If Trend is falling, protect unit economics: this is where brands win by timing, targeting, and retention — not by “more budget.”
But direction alone isn’t enough — you also need the “why.”
When a trend turns green or red, you can open Market Explanation to see a structured summary of the key events that influenced the market in that period — the fastest way to validate whether a move is driven by sport calendars, regulation, payments friction, blocking, or cultural seasonality.
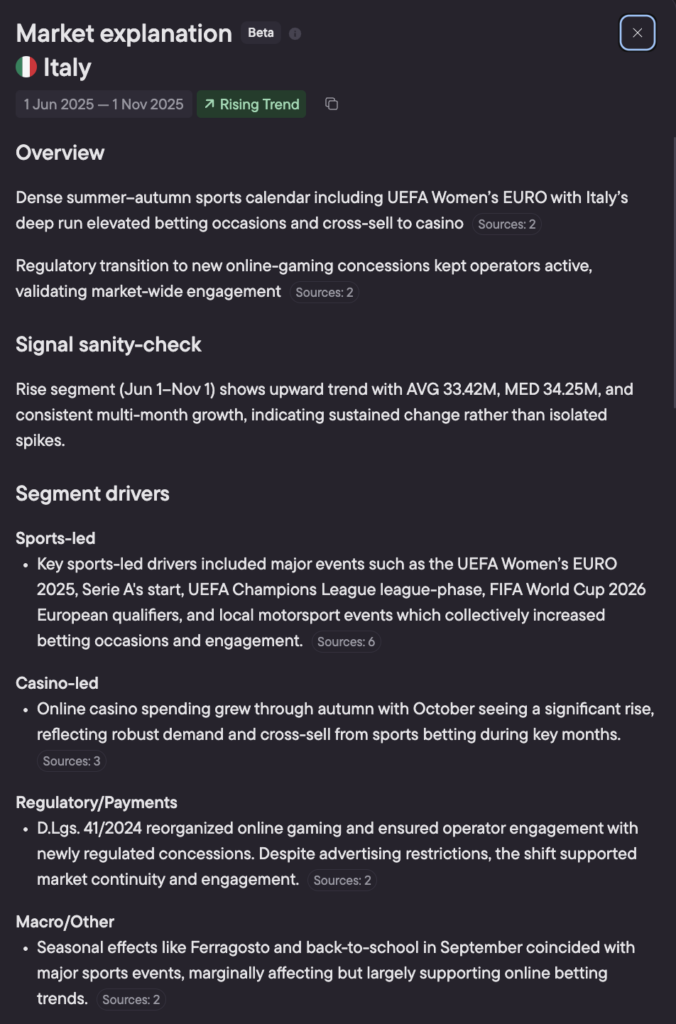
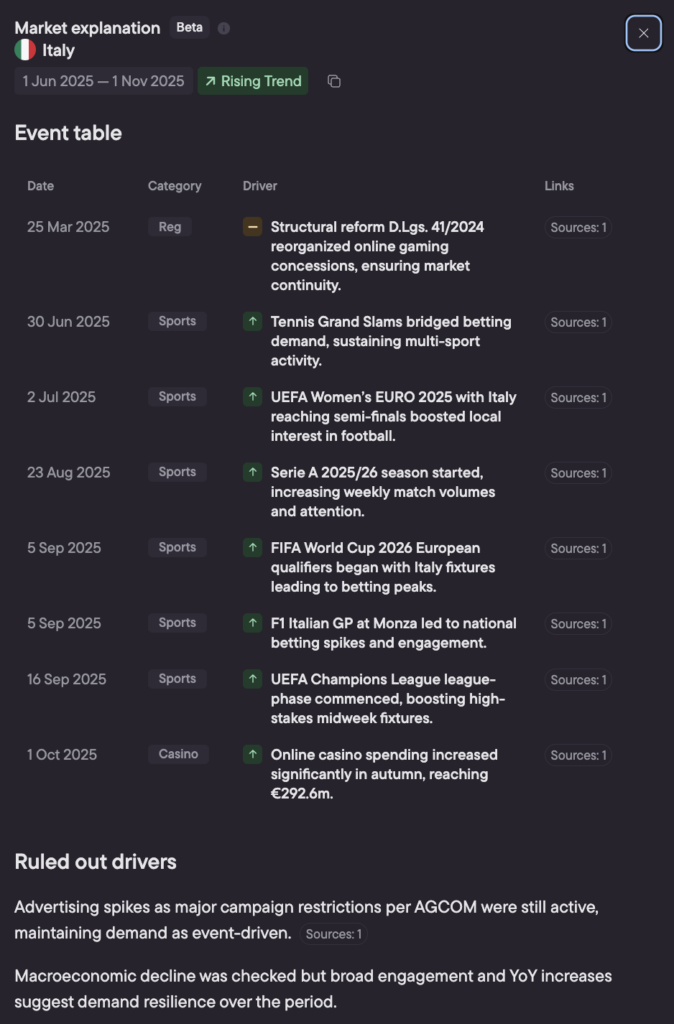
This step turns market selection into a discipline: you’re no longer saying “this feels hot” — you’re saying “this market is rising for clear, explainable reasons.”
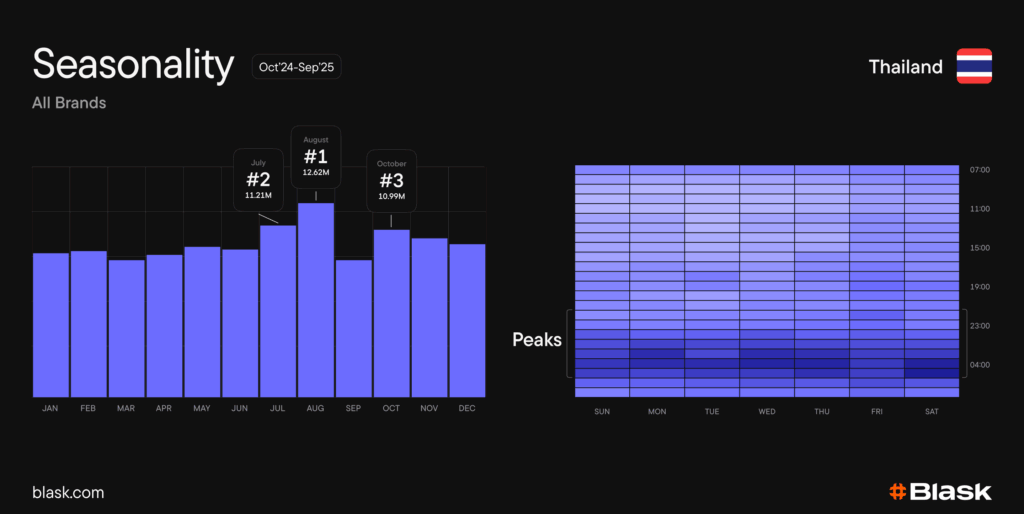
Pick the right launch window: Seasonality
Once you know where a market is headed, the next question is when it actually moves.
Seasonality adds a time dimension to country-level insights: a month ranking that surfaces the strongest and weakest periods, plus a weekday/hour heatmap (UTC) that shows when engagement concentrates — so you can time activations before you spend.
Use it for two practical decisions:
- Campaign start timing: launch in the market’s strongest month and strongest hours instead of burning budget in a natural lull.
- Sanity-check performance: if results improved during a naturally peaking window, you may have arrived on time — not necessarily improved your creative.
Read also: Blask data shows October as the global peak of iGaming activity
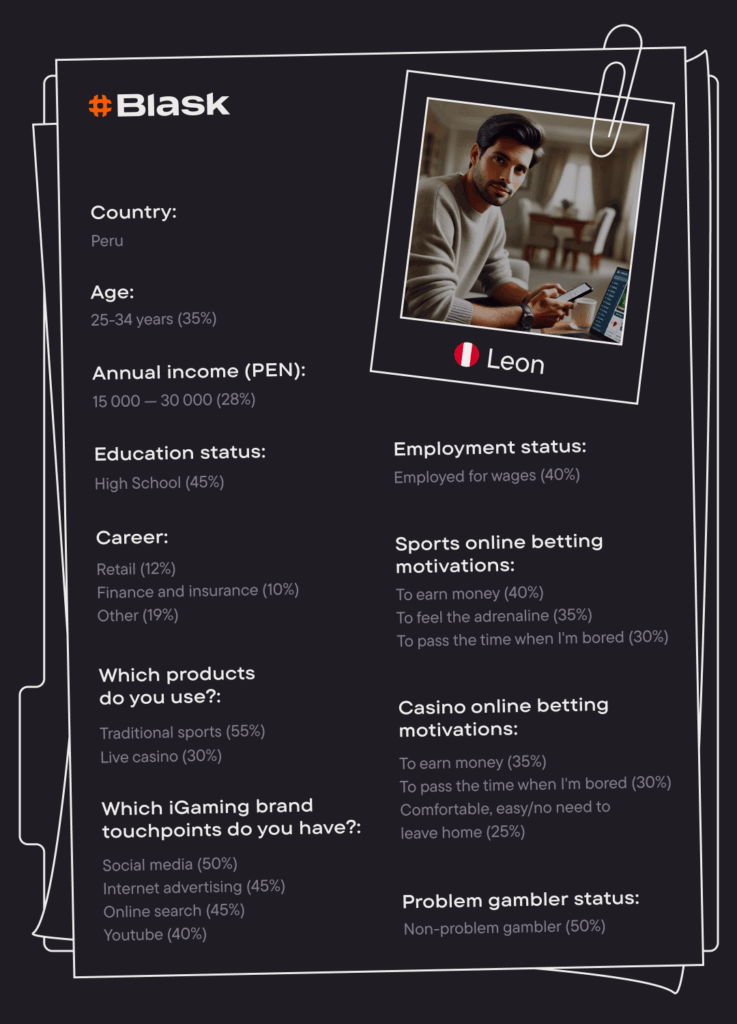
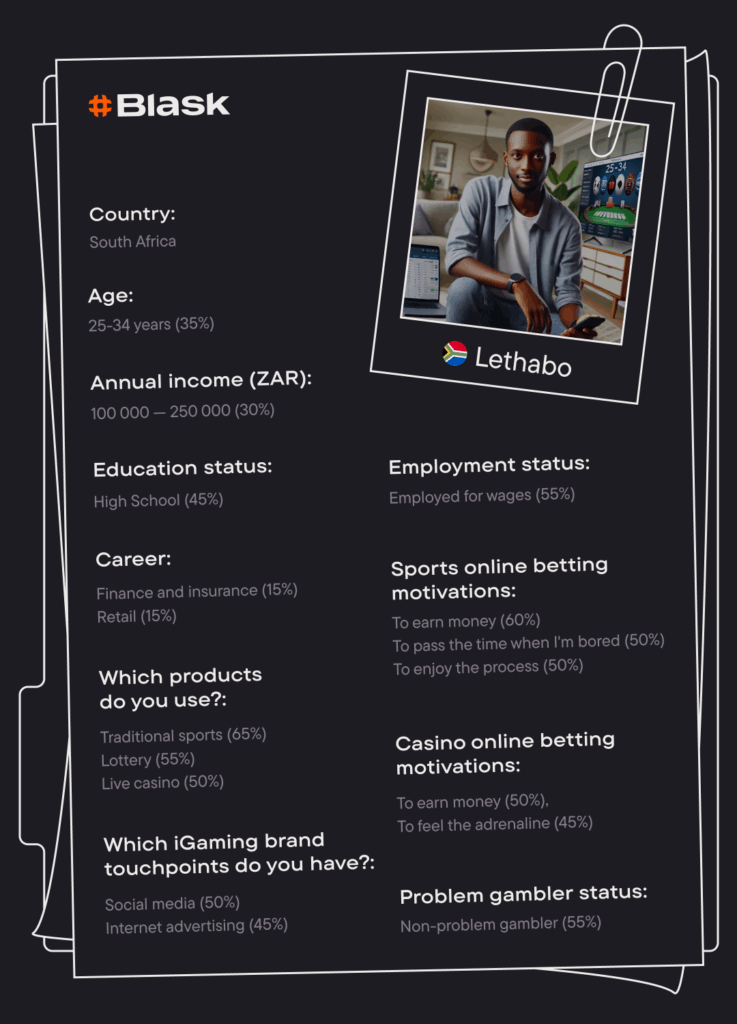
Know the player with Customer Profile.
Customer Profile is Blask’s always-on audience engine.
Drawing on an AI model trained with 80 000 survey responses, regulatory files and behavioural telemetry, it produces a live portrait of the average iGaming player in any country.
The dashboard breaks that portrait into ten panels — age, income, education, employment, career vertical, betting motivations (sports and casino), preferred products, first brand touch-points and self-reported problem-gambling risk — so marketers see far beyond the limits of their own CRM.
🔗 Deep dive: What is Blask Customer Profile
Put the right game in the window with Games Dashboard.
Two views, two questions
Placement lives in the Avg Lobby GVR widget; player appetite lives in the Blask Index / Share-of-Interest widgets just below it. Blask lets you see at a glance whether a title is well-positioned and whether anyone still cares.
📖 Learn more: Inside Blask’s lobby-position engine
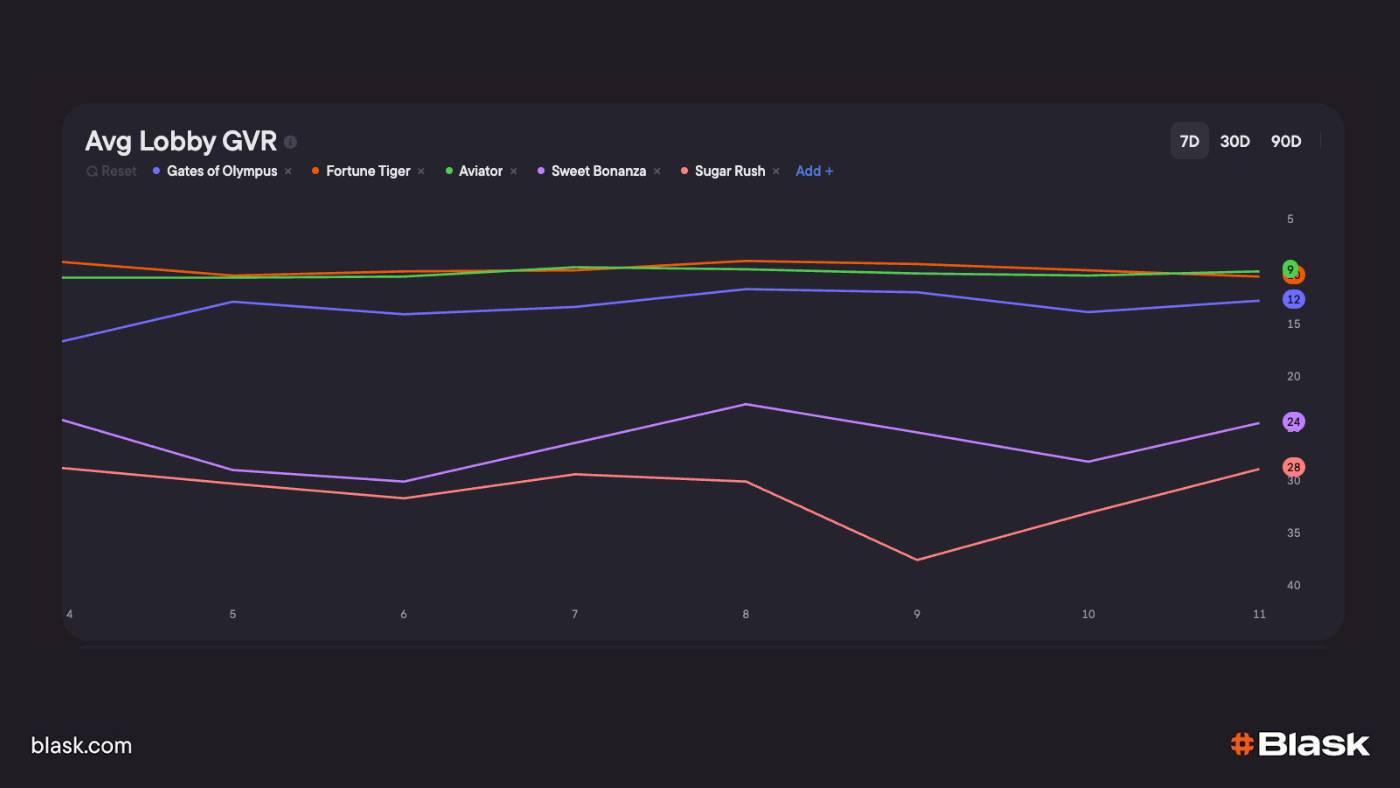
Blask Games in lobby positions
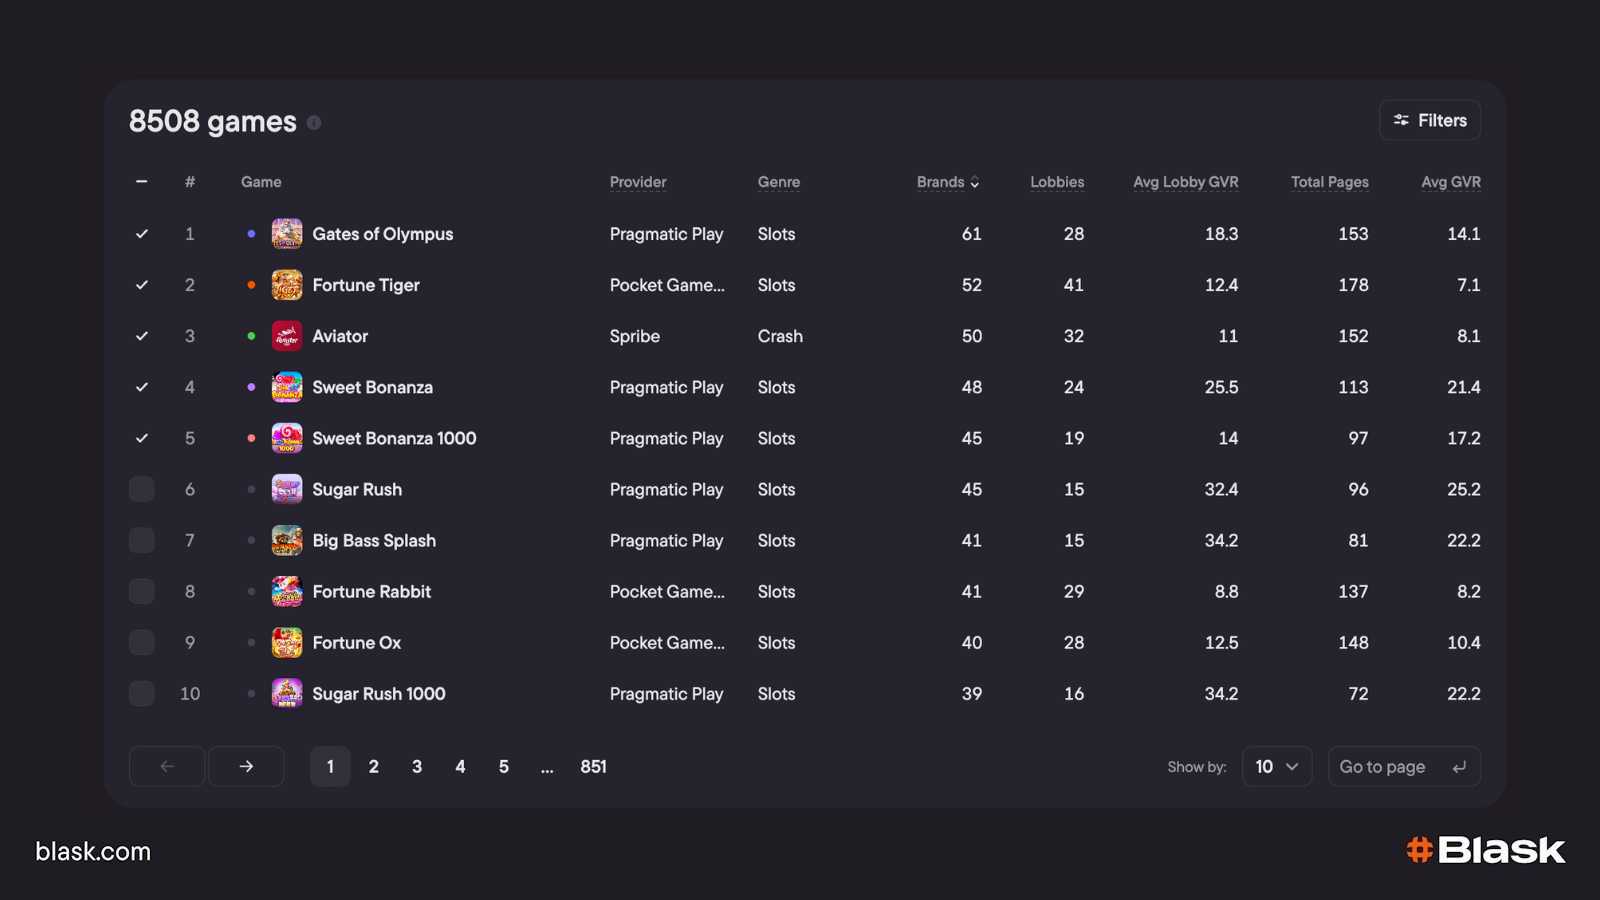
Blask Games in lobby position table
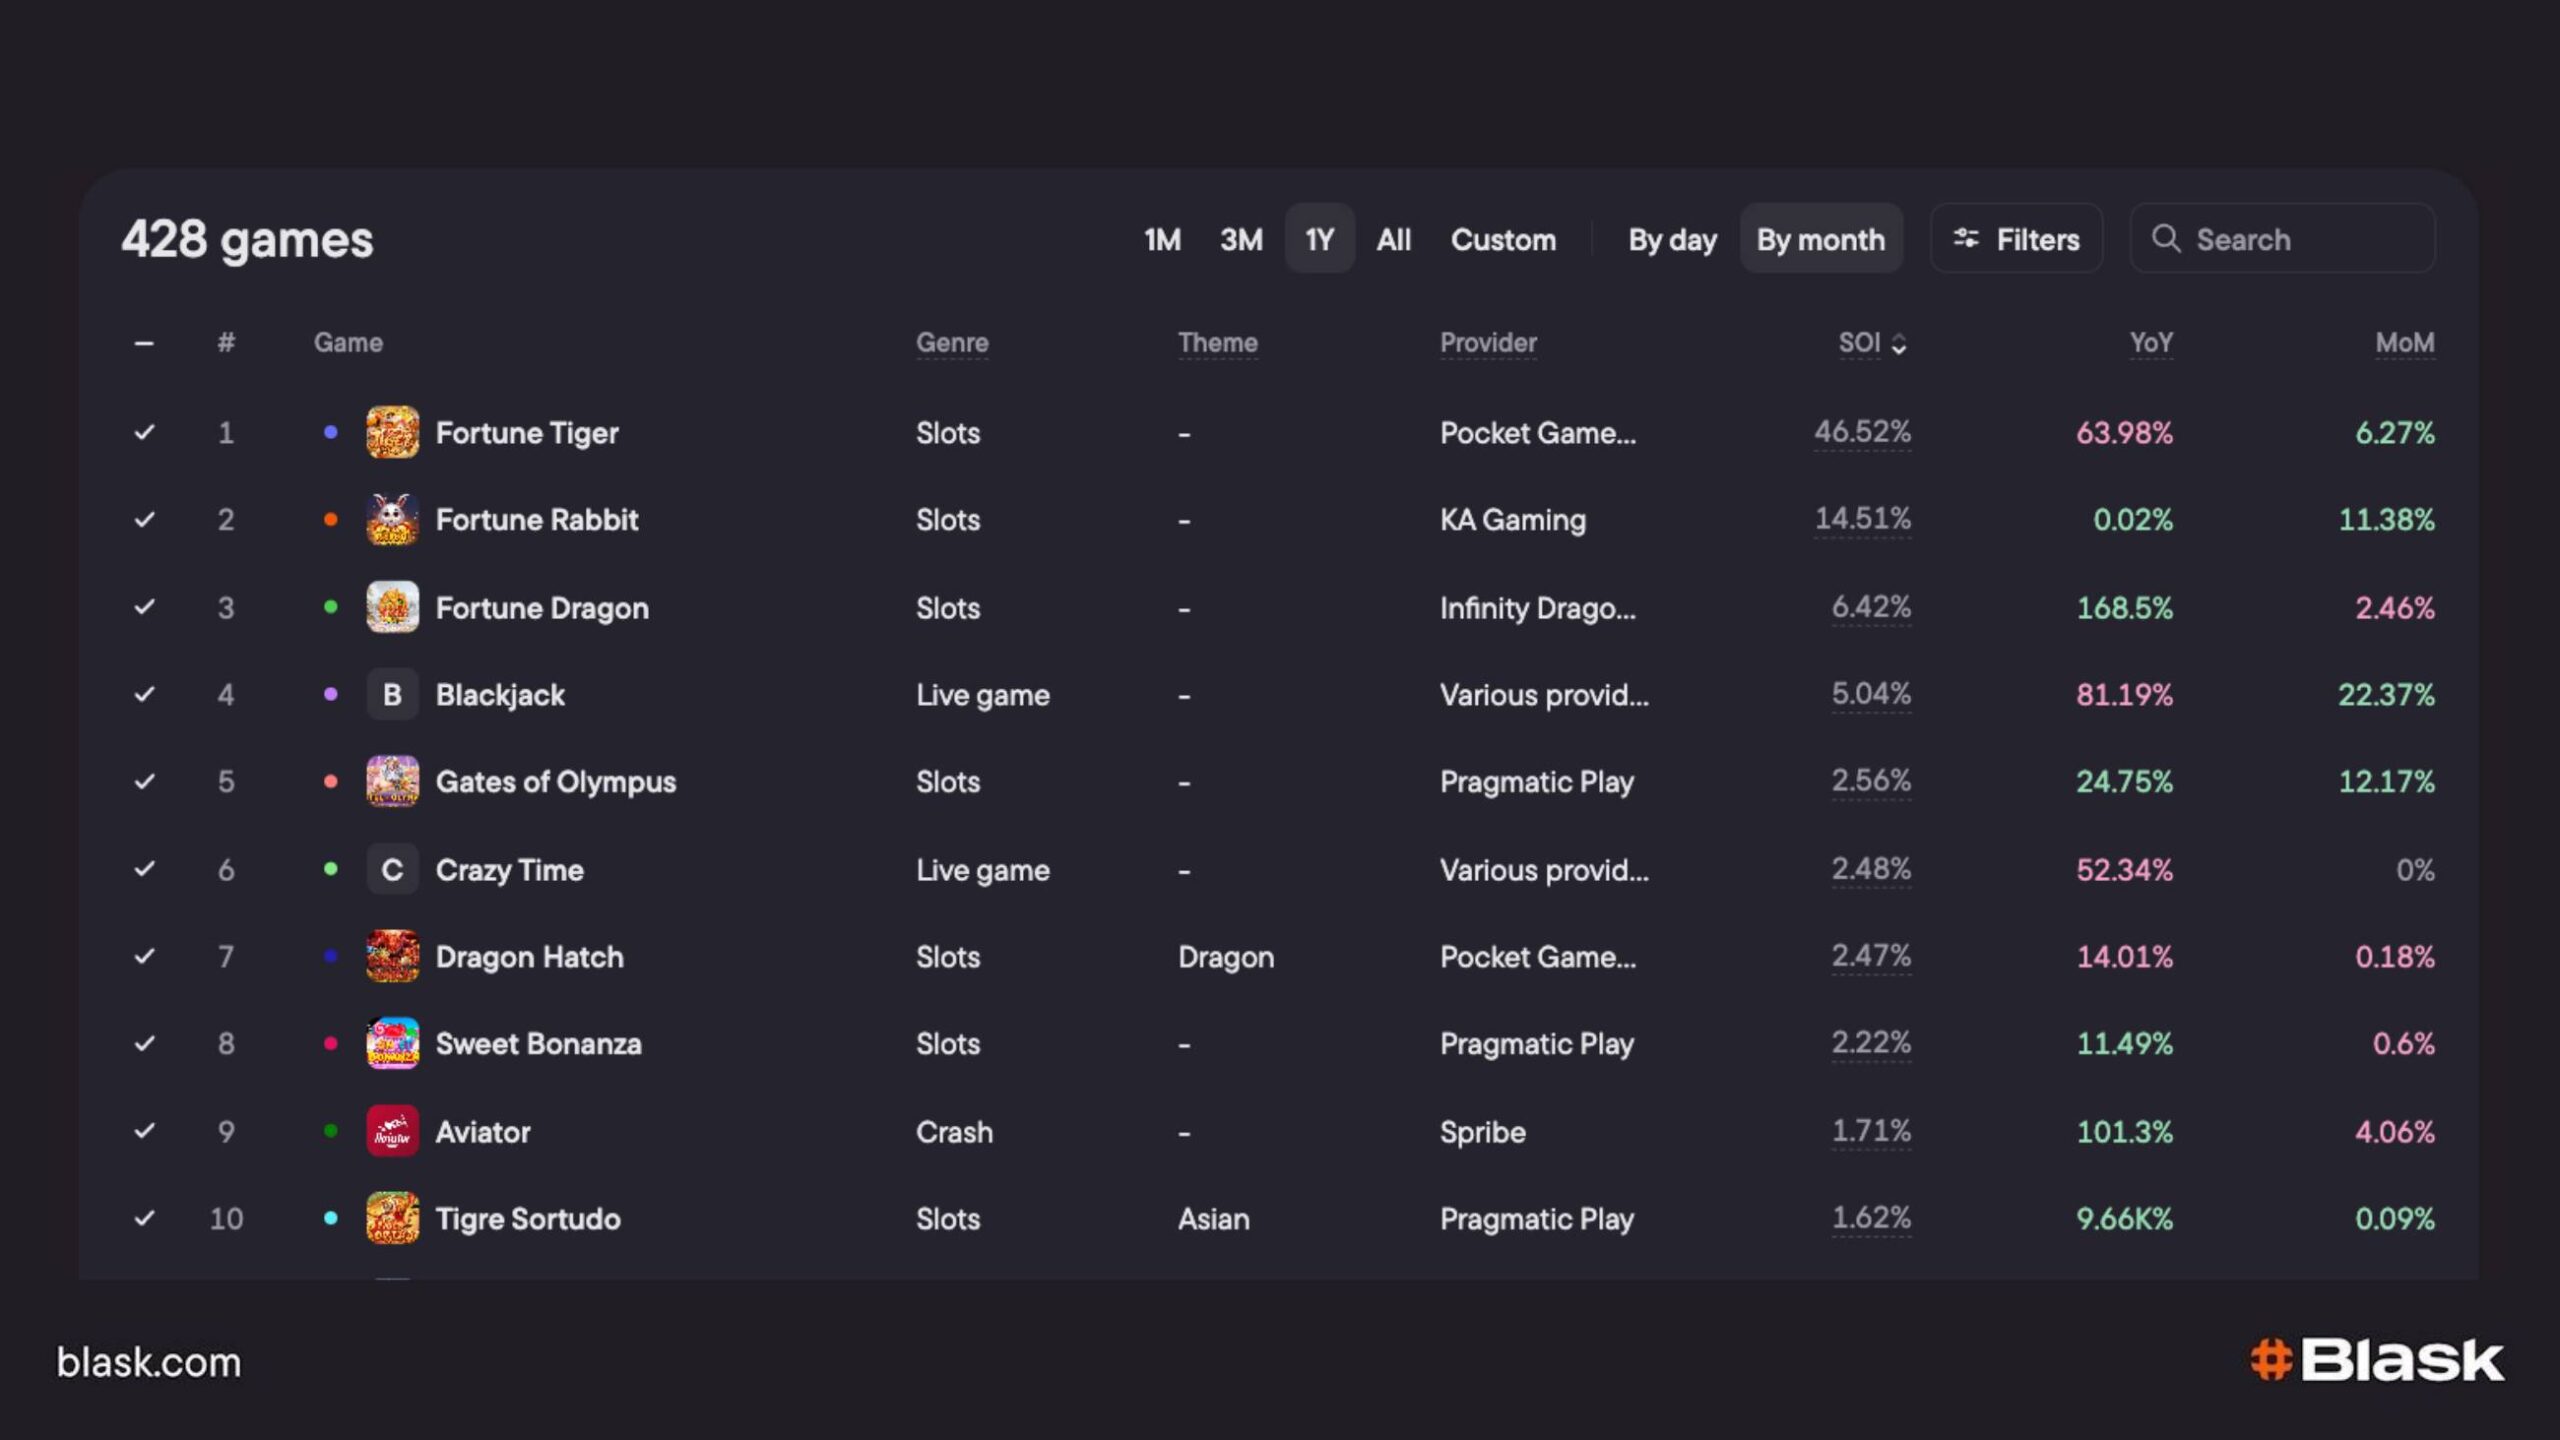
Blask Games table
How to use it:
- Promote sticky hits — Filter table to Avg Lobby GVR less then 25. Bump any result into the first screen.
- Catch hidden demand — Look for games whose Index line climbs.
- Run fatigue sweeps — If a flagship sinks below seat 25 and its Index plateaus, rotate in a fresh crash title or add a mission overlay.
- Provider scorecards — Sort by studio, compare GVR vs. dwell-time; renegotiate rev-share or request exclusives from suppliers whose games over-deliver on placement.
Measure the funnel end-to-end in Growth Values (APS + CEB).
What the metrics mean
- APS (Acquisition Power Score) – the number of first-time depositors you should have landed last month, calculated from your BAP, national demand and funnel friction.
- CEB (Competitive Earning Baseline) – a green three-lane revenue corridor (Worse │ Average │ Better) showing what those newcomers should have spent, based on APS plus peer yields and macro context.

APS for India
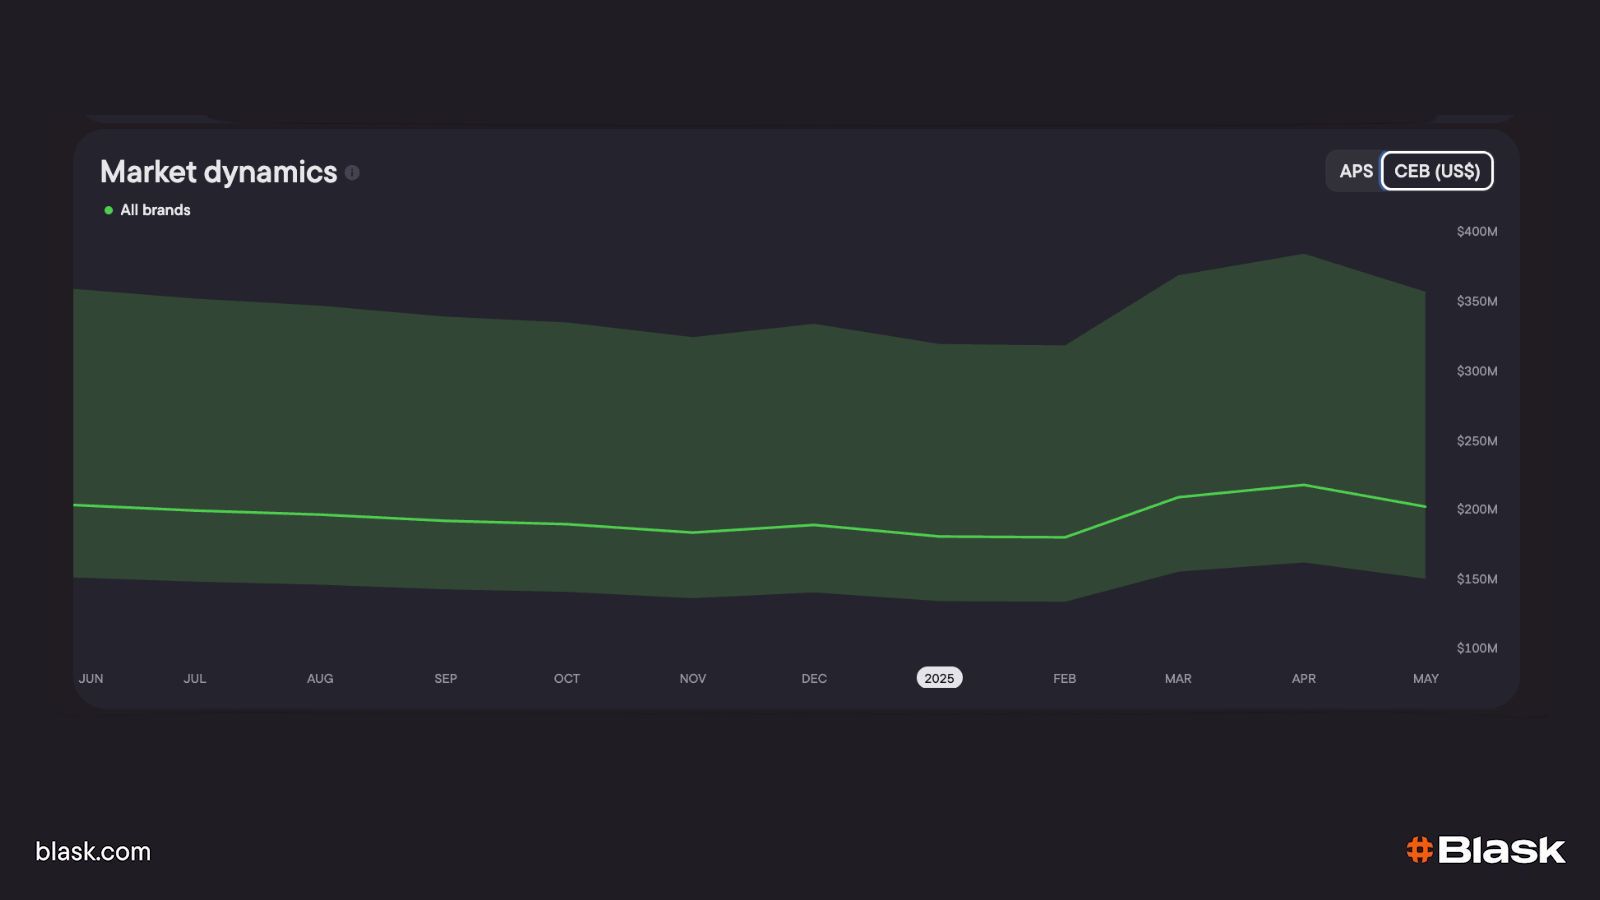
CEB for India
How to use APS + CEB — three quick plays
- Health-check your own funnel – Compare APS to real FTDs and CEB to actual GGR. If sign-ups lag APS, widen the top of funnel; if GGR falls below the CEB band, patch post-deposit leaks with cross-sell, VIP or RTP tweaks.
- Benchmark the neighbours – Sort the Brands table by APS and CEB gaps. A rival beating your APS converts awareness better; one outscoring you on CEB monetises deeper. Copy their sign-up flow or VIP cadence instead of guessing.
- Pick the right market tactic – In Countries view toggle between APS and CEB. A high-APS / low-CEB market needs retention-heavy entry; a low-APS / high-CEB market repays aggressive awareness spend once players arrive.
📚 Read more: Ushering in APS & CEB for a new era of brand performance
Conclusion: from gut-feel to guaranteed ROI.
Hunches built the first wave of iGaming growth; hard numbers will decide who wins the next. By chaining Blask’s dashboards in order — Countries → Market Overview → Customer Profile → Games → Growth Values — you turn scattered data into one tight feedback loop:
- Blask Index flags where demand is bubbling.
- BAP shows how much of that attention you already control.
- APS checks whether visibility converted into new players.
- CEB grades how well those players monetized.
- GVR keeps the lobby fresh so engagement never stalls.
Run the circuit each month (or faster), and every decision carries a measurable upside you can prove on the next refresh. That’s data-driven marketing in action; that’s how tomorrow’s leaders will protect margin while rivals still gamble on intuition.
Download the checklist “Blask for iGaming operators”