Breaking into a new jurisdiction used to feel like a controlled gamble: you paid for a thick market report, flew a team to the capital, met a few local partners, and tried to make sense of a market that was already moving on without you.
In 2026, the advantage has shifted toward operators who can read markets in near real time — not just how big they are, but why they move, who is converting, what players actually want, and where regulation quietly changes the economics.
This guide lays out a practical market-entry workflow built around five Blask modules — Blask Index, Brand Accumulated Power (BAP), Acquisition Power Score (APS), Customer Profile, and Blask Games (with Game Visibility Rank (GVR) and Share of Interest (SoI)). Used together, they help operators size demand, benchmark rivals, forecast first-time deposits (FTDs), localize offers, and validate game/content fit — before the first media plan is even signed.
If you want extra context before diving in, here are three operator-grade market reports:
What follows isn’t a glossy manifesto. It’s a playbook for making a decision your board can defend: where to enter, when to enter, and what you’re actually entering.
Most expansion decks start with a familiar set of claims: “growing market,” “underpenetrated,” “favorable demographics.” The language can be true and still be useless.
What operators need is a chain of evidence: demand → acquisition headroom → revenue reality.
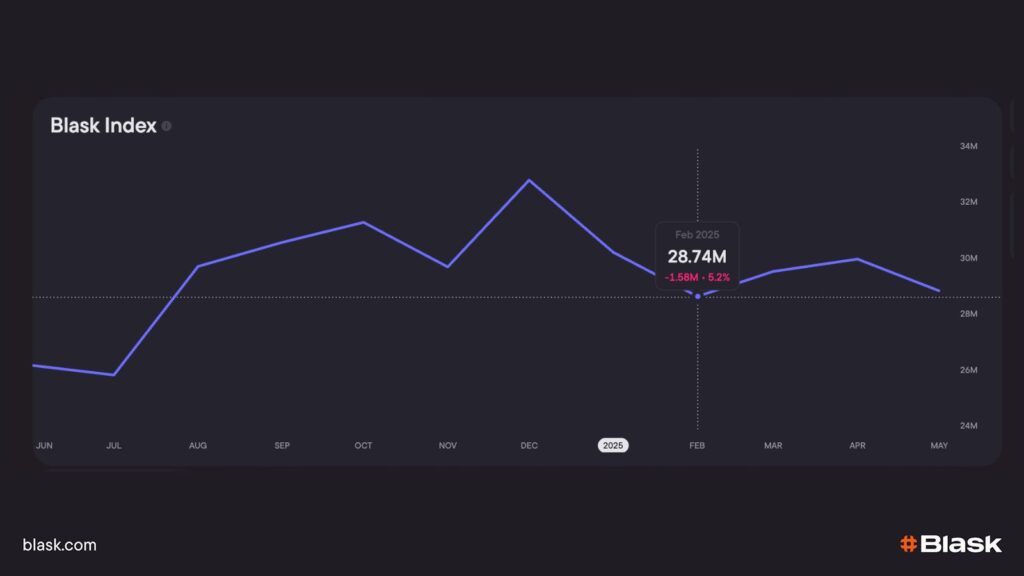
Blask Index — a live demand signal, updated hourly
Pull the country-level Blask Index to see hourly interest across all operators operating in this market. A steep, sustained climb signals genuine, organic demand rather than short-term media hype.
Blask Index in Italy
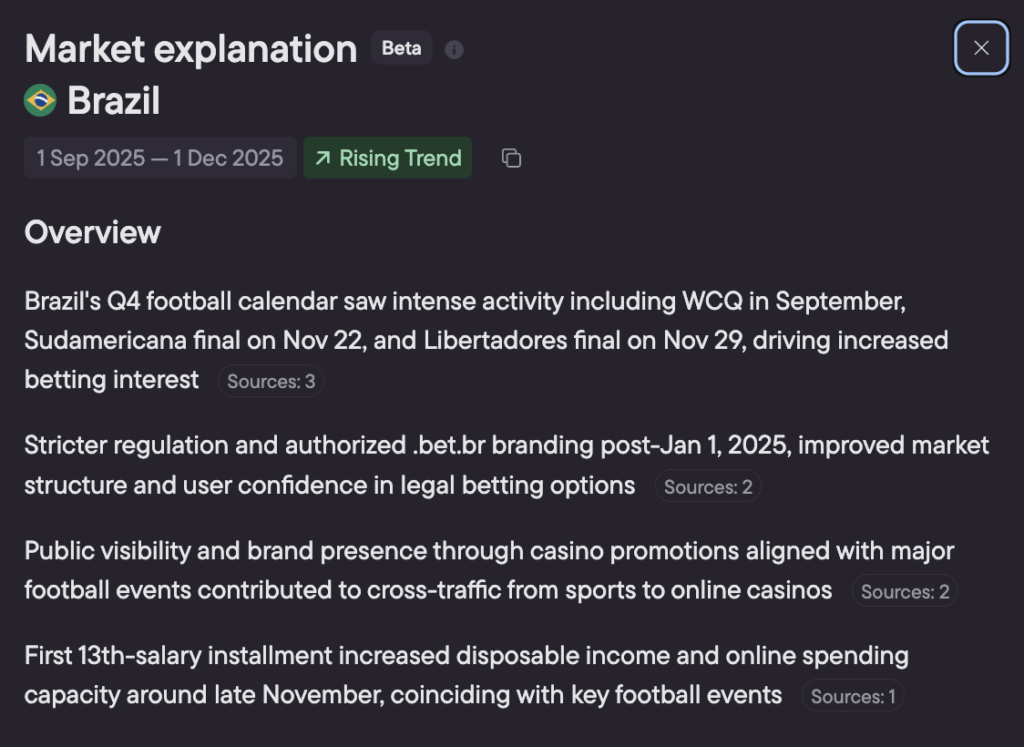
Market Explanation — the “why” behind the trend line
A trend line is rarely the full story. A market can surge because football season returns, because payment rails fail in the background, or because a regulator tightens the screws. Those events don’t show up in a single number — but they determine whether your entry economics hold.
That’s where Market Explanation comes in. Built as an AI feature, it turns a Blask Index movement into a structured breakdown of what’s driving it, so teams aren’t left arguing in hindsight.
“Brazil. In 2025, there was massive hype around this country — the entire market rushed there because it was in the news daily. But the market proved far more complex than expected.
Regulation, taxes, and cost structure made it practically unprofitable for most operators, who quickly faced high entry costs, low margins, and no clear monetization model. By year’s end, excitement turned to disappointment, and most realized the ‘Brazilian dream’ was hype rather than real opportunity.” — Dmitriy Belianin, Co-Founder & Managing Partner, Blask
The point of the quote isn’t Brazil. It’s the recurring pattern: operators often confuse visibility with viability.
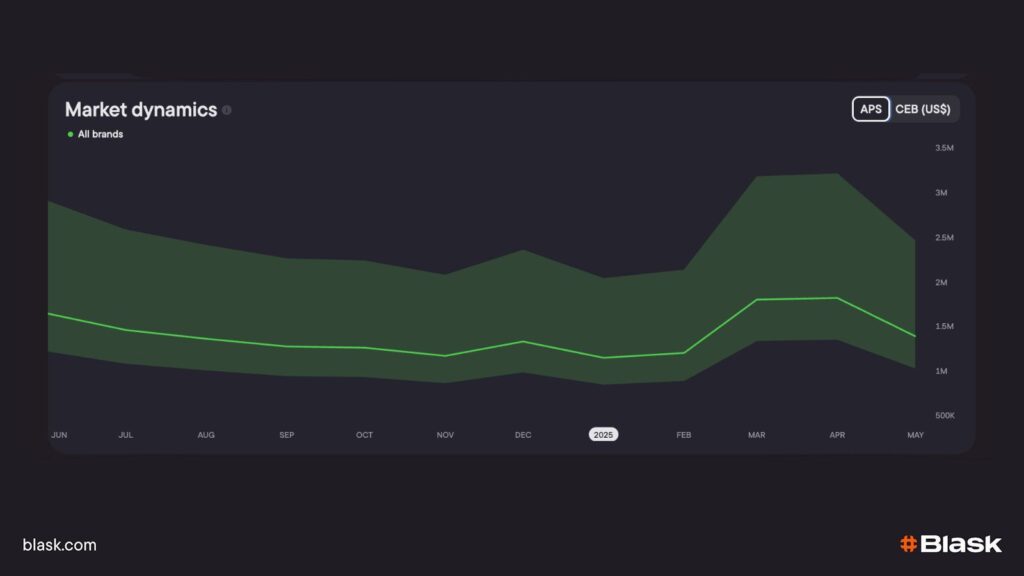
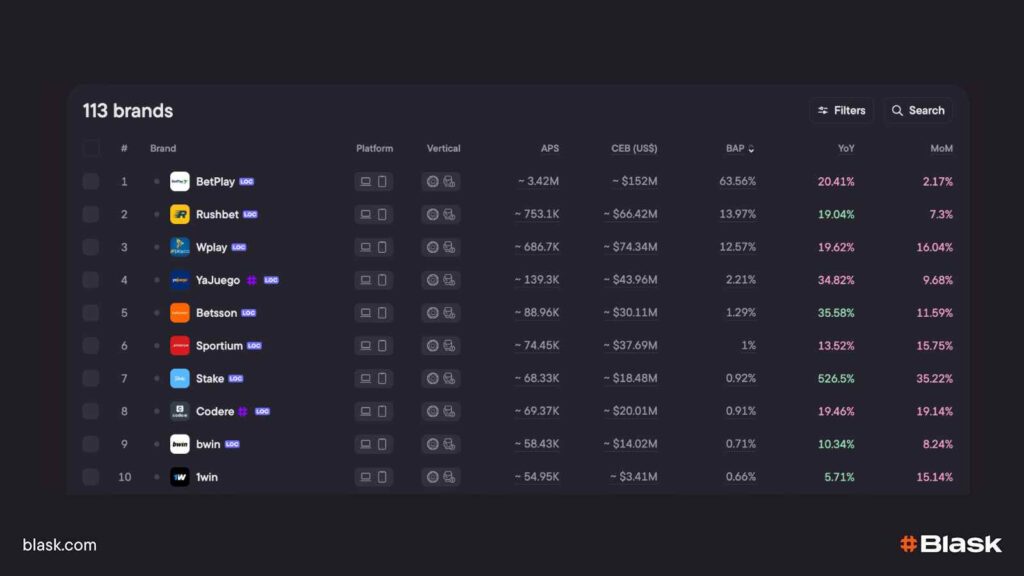
Total APS – acquisition head-room
Add the Acquisition Power Score (APS) for every brand in that market. APS blends search share, affiliate coverage and social chatter, so it answers: “How many FTDs could a well-executed entrant capture?”
APS in India
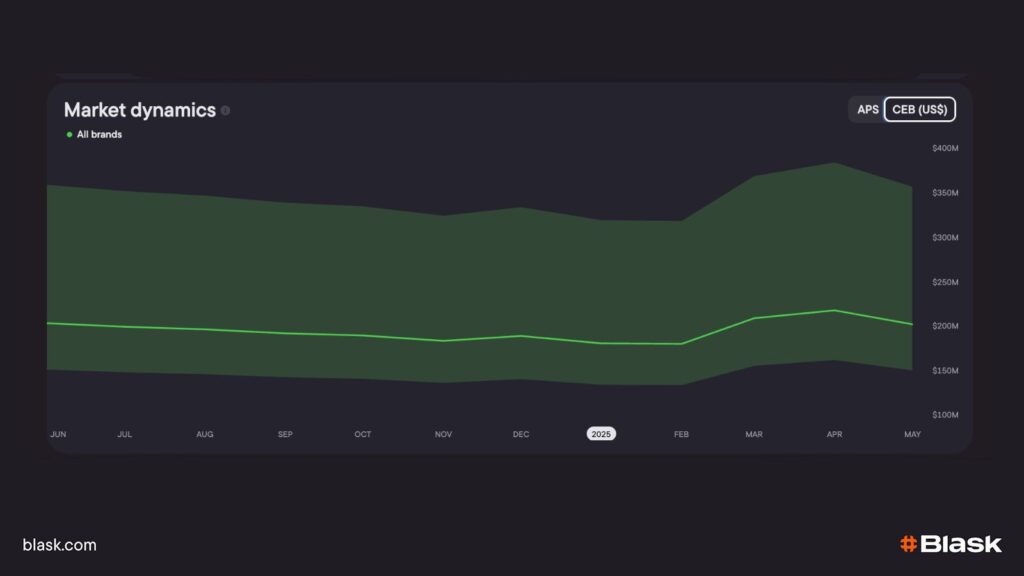
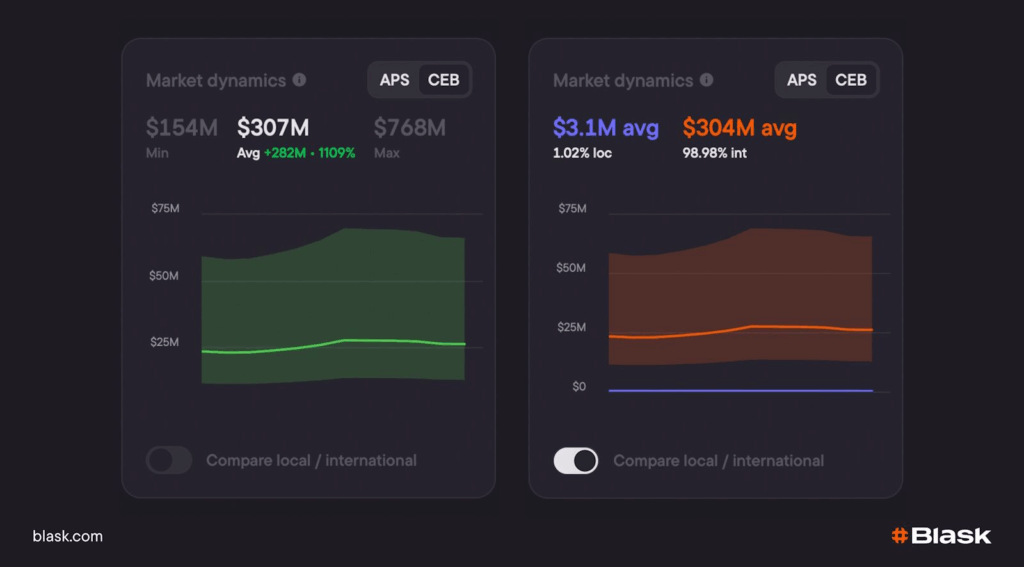
Five-year CEB – revenue ceiling
Overlay Blask’s five-year Competitive Earning Baseline (CEB) projection to gauge maximum attainable GGR if you win average share. Industry forecasters put global online-gaming revenue at ≈$153bn by 2029, CAGR ≈ 10%. CEB lets you drill that headline into a single-country P&L.
Plot demand (Blask Index) on the Y-axis and APS on the X-axis. Upper-left squares (high demand, low acquisition) are prime beach-heads: fans are searching, incumbents aren’t converting.
📚 Recent case studies in Africa prove the model — betPawa topped the region with 22 m APS after identifying exactly that gap. Read the full story.
Player-first feasibility.
Even the juiciest macro numbers fall flat if the people behind them don’t convert.
This step flips the telescope: instead of asking “Is the market big?” we ask “Is the player we want actually reachable — and responsibly sustainable — in that market?”
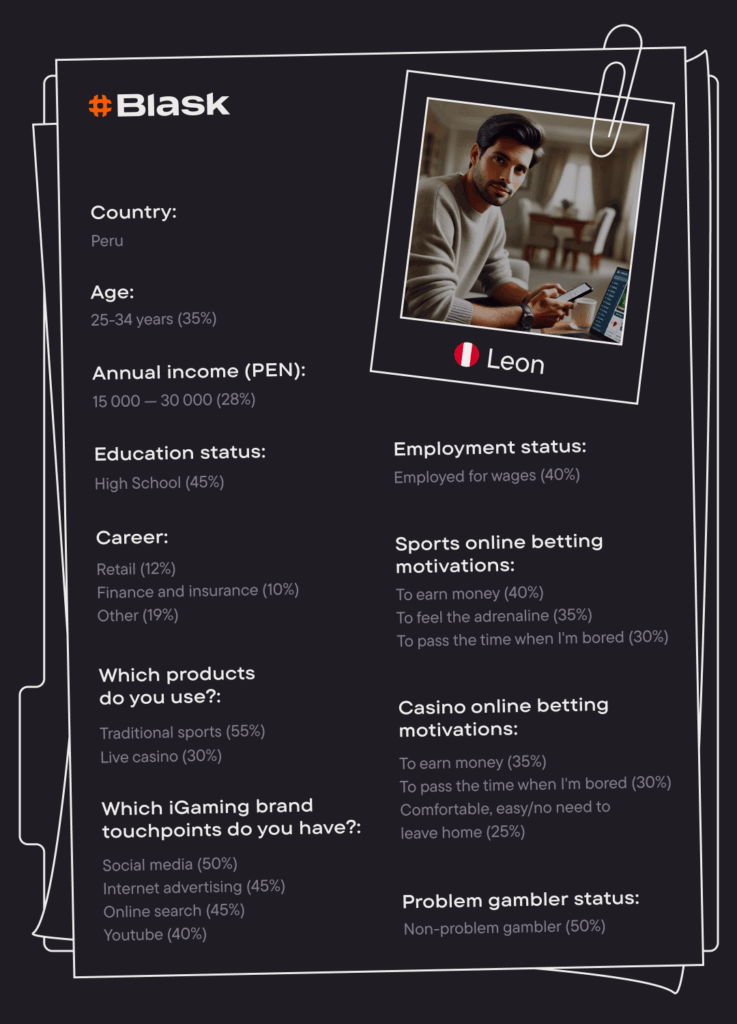
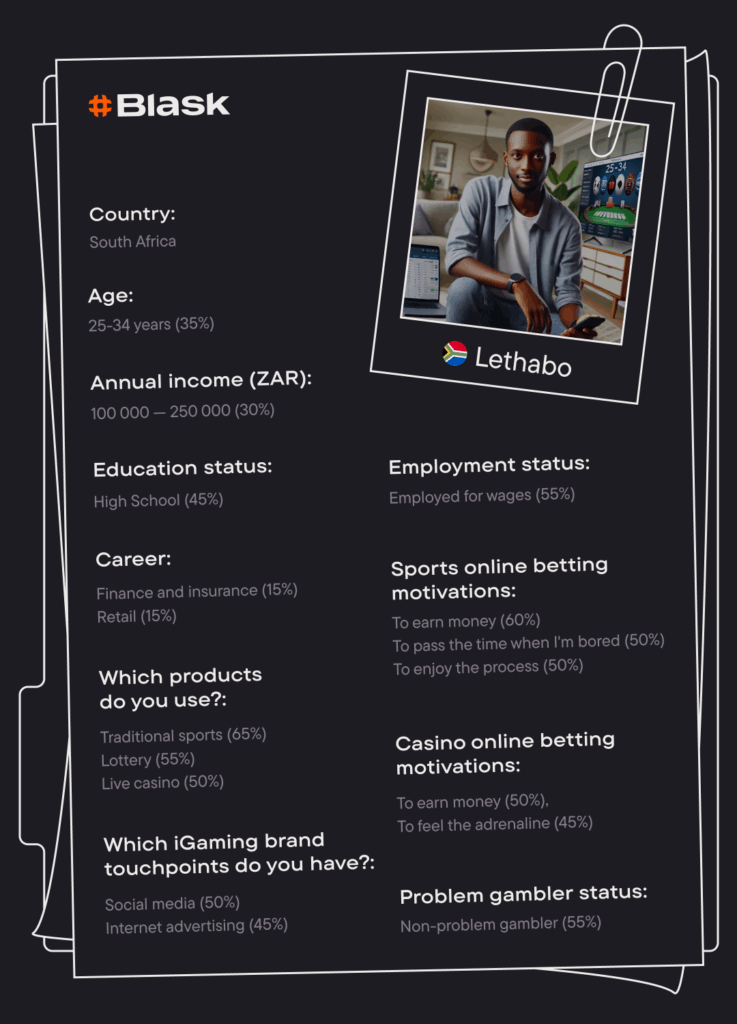
Blask Customer Profile deep dive
Blask’s Customer Profile module fuses 80 000+ survey records with live behavioural feeds to paint a 360° portrait of each country’s iGaming audience. Here’s what you get — and why it matters:
What you can do with it
Build hyper-local funnels – copy tone, stakes and UX that mirror the dominant cohort’s habits.
Pre-clear compliance – know the PGSI risk distribution before you file licence paperwork.
Benchmark ARPU headroom – overlay median ARPU on your P&L to see if the economics fly.
Learn the full workflow in our deep dive: Blask Customer Profile.
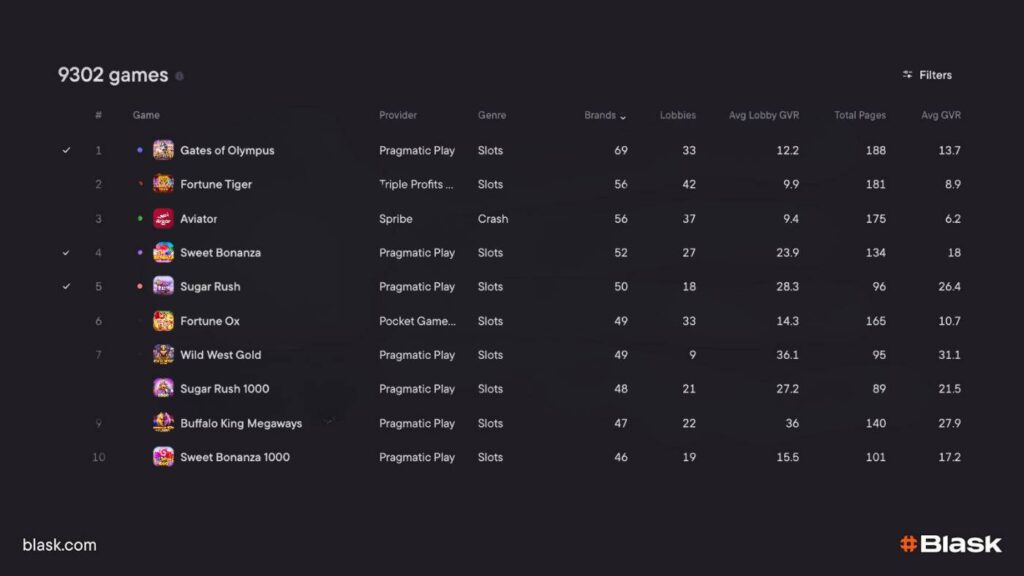
Game & content fit
A brilliant bonus falls flat if the lobby is stacked with the wrong titles. Blask Games solves the visibility-versus-demand puzzle in three daily snapshots:
Metric
What it tells you
Example insight
Game Visibility Rank (GVR)
Average game position across local casino lobbies
Game X holds seat #7 in Brazil but #53 in Greece.
Blask Index — Game
Country-level search demand for each title
Blask Index for “Crash Rocket” make a spike after influencer stream.
Share of Interest (SoI)
% of Blask Index a title commands
“Mega Hot 40” owns 5.2% SoI, signalling evergreen appeal.
How to action it
Pick must-have games – Cross-filter by GVR + SoI to shortlist studios that already pull demand (no guesswork).
Align with local sport calendars – Overlay Blask Index spikes against fixtures (IPL, AFCON, Copa Libertadores) to time themed jackpots or sportsbook cross-promos.
Negotiate smarter rev-shares – If a game’s GVR is tanking while its SoI climbs, you’re over-paying for lobby real estate; flip terms or swap titles.
Blask Games pumps a fresh dashboard every dawn: visibility crawls, demand curves, and SoI percentages for every indexed title. The up-shot? You see the lobby shift — and can rearrange tonight’s hero row before competitors even notice.
Games lobby position table in Brazil
Together, Customer Profile + Blask Games turn the abstract “player potential” into a concrete feasibility score — so your market-entry deck speaks the language investors love: real, risk-adjusted numbers.
Regulatory & hyper-local readiness.
Entering a new jurisdiction isn’t just a marketing bet — it’s a licensing chess match. Use a three-step checklist to keep the board in view before you invest:
What to capture
Why it matters
Where Blask helps
Licence path, tax band, ad & sponsorship rules
Up-front clarity on cap-ex, promotional leeway, and go-live lead-times.
The market overview panel in every Blask country dashboard surfaces regulatory status.
Local vs International brand split
Regulators often give home-grown operators preferential visibility or softer promo caps. Benchmarking against “your own tier” avoids skewed forecasts.
Toggle the badge to isolate domestic brands, then compare APS & CEB ranges. You’ll see instantly whether home licences (LOC) or offshore structures dominate acquisition in that market.
Blask in one line: switch the LOC filter on, watch APS/CEB charts re-shape, and decide whether you need a local licence or can compete as an international brand without losing acquisition head-room.
Below is a single-screen cockpit your team can refresh every morning. It aligns funnel stages to the Blask metric best suited for that decision window and bakes in cadence discipline so red flags never wait for month-end.
Funnel stage
North-star metric
Blask view / tool
Decision rhythm
Awareness
Spike vs 30-day baseline on Blask Index
Custom “Blask Index Alert” rule
Daily / Hourly
Acquisition
Actual APS vs quarterly target band (min / mid / max)
APS dashboard with brand & country filters
Monthly
Deposit
Real FTD rate vs modelled APS
APS panel + internal cashier data
Monthly
Early LTV
CEB delta vs forecast
CEB panel (brand / local / international split)
Monthly
TL;DR.
Entering a new jurisdiction used to hinge on instinct and backward-looking market reports.
In 2026, the playbook has flipped. Blask’s AI stack — Blask Index, BAP, APS, Customer Profile, and Blask Games (GVR/SoI) — gives operators a live, 360-degree view of demand, competition, player reality, and content fit. Macro signals (Index + APS + CEB) size the prize; micro signals (Customer Profile + Games) test whether real players, on real devices, with real budgets are ready to convert. Local/international segmentation exposes licensing dynamics before projections harden into bad decisions.
And with Market Explanation, the trend line stops being a debate and becomes a diagnosis: not just “what happened,” but “why it happened,” and what that means for conversion, margins, and timing.
The result, for operators who execute with discipline, is a faster go/no-go cycle, lower discovery costs, smarter game portfolios, and more predictable FTD performance — while keeping regulators and player sustainability in view from day one.
Yana Makarochkina is the Chief Marketing Officer at Blask, specializing in B2B and iGaming content marketing. With a background in journalism and agency experience across industries from hospitality to logistics, she combines strategic thinking with a passion for fact-based storytelling — making complex ideas clear, compelling, and actionable.
Legal poker rooms operate in fewer US states than legal online casinos — offshore operators fill the gap. In the US, online poker is regulated in eight states, but only six of them have licensed operators actually running games. That is a consequence of how the vertical works — and it does not help channelise […]
Most iGaming operators benchmark against their own past performance. That only tells you if you’re growing — not whether you’re winning. This article explains how demand-based signals reveal where any brand actually stands in a market, from #1 to #164.
Blask data shows how much the Indian iGaming market depends on cricket events, especially on the domestic league. Cricket is the number one sport in India — Blask data reveals that iGaming demand in the country strictly follows the cricket calendar. The main booster is the Indian Premier League (IPL) — domestic league, running roughly […]