- Updated:
- Published:
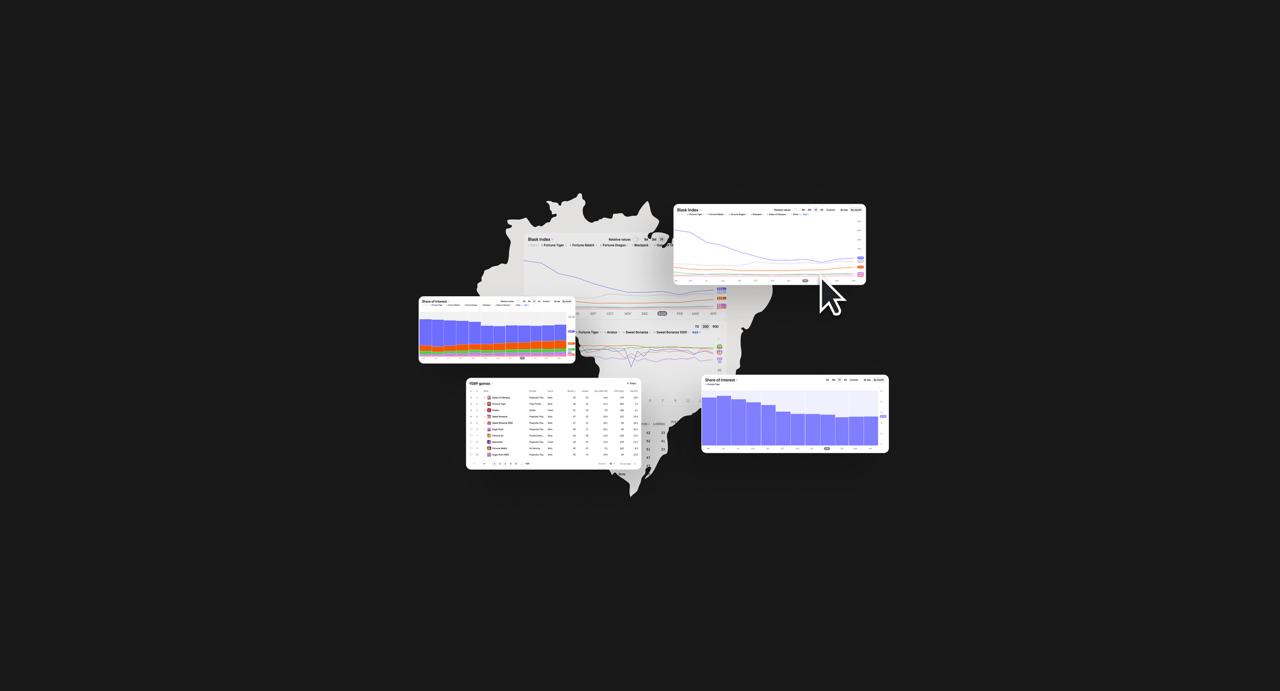
Quick tour: the “Countries” view in Blask Games
The Countries view is built to take you from “How big is this market?” to “Which games are trending right now?” without ever losing your place on the screen. Below is a quick, story-style walk-through that follows the page from top to bottom and shows where to click next if you want to dig deeper.
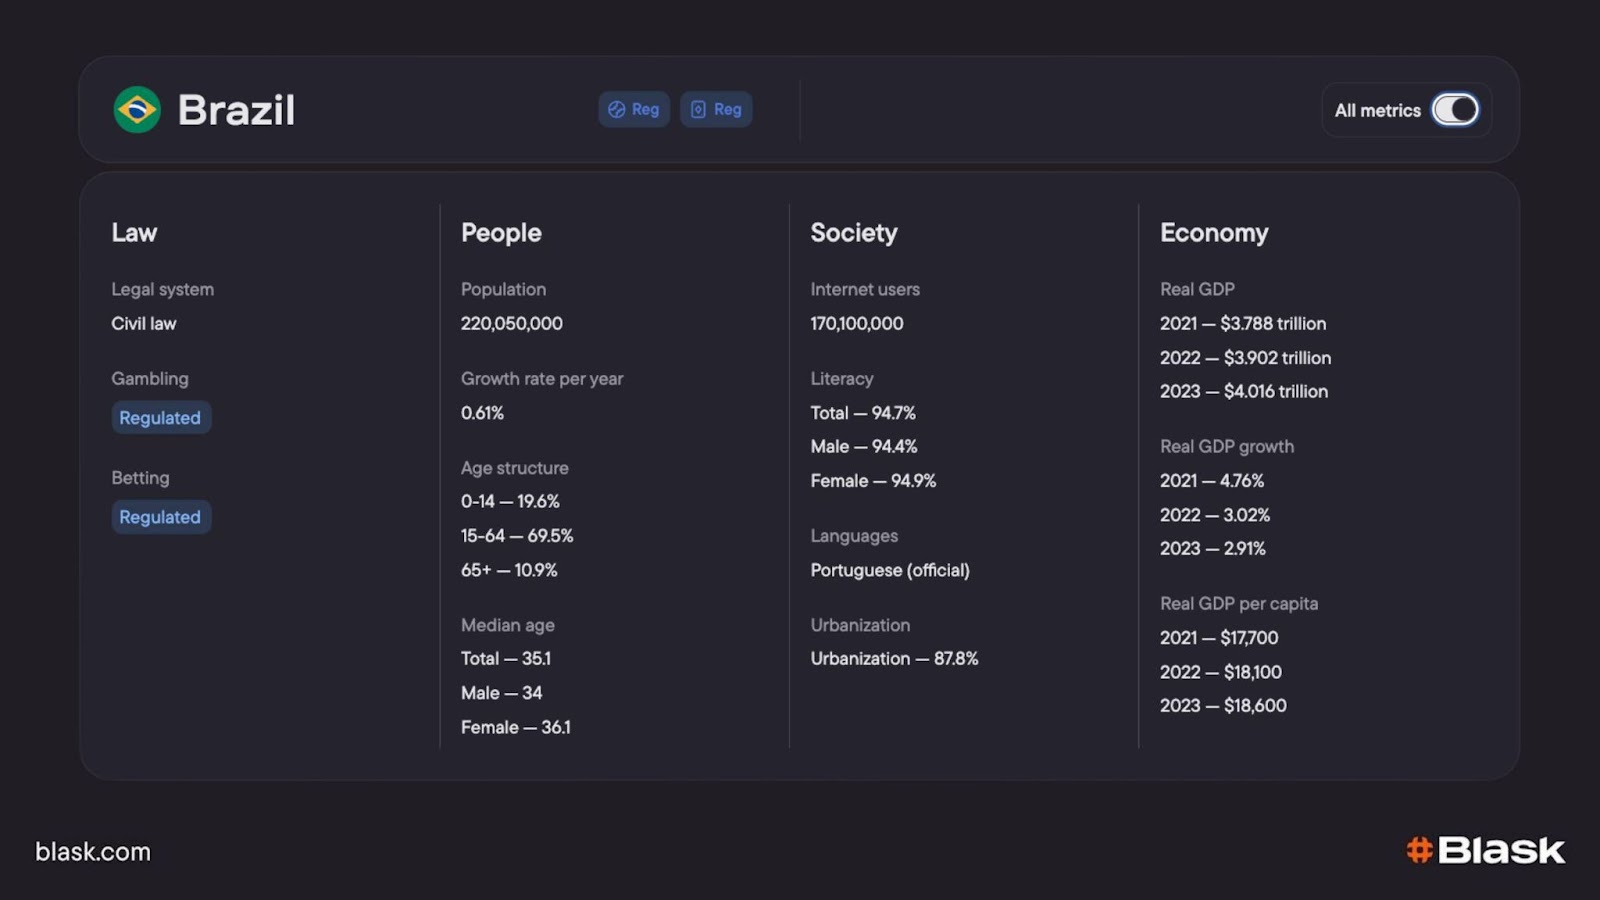
Country header.
The top bar shows the country flag + name, two blue badges for casino and betting regulation, and counters for population / internet users.
Toggle All metrics and that slim bar unfolds in place, revealing the four-column Country Profile (Law, People, Society, Economy). The same panel appears in every Blask dashboard, so you never have to leave the page to check fundamentals.
💡 Read more: Quick tour – the Game view in Blask game
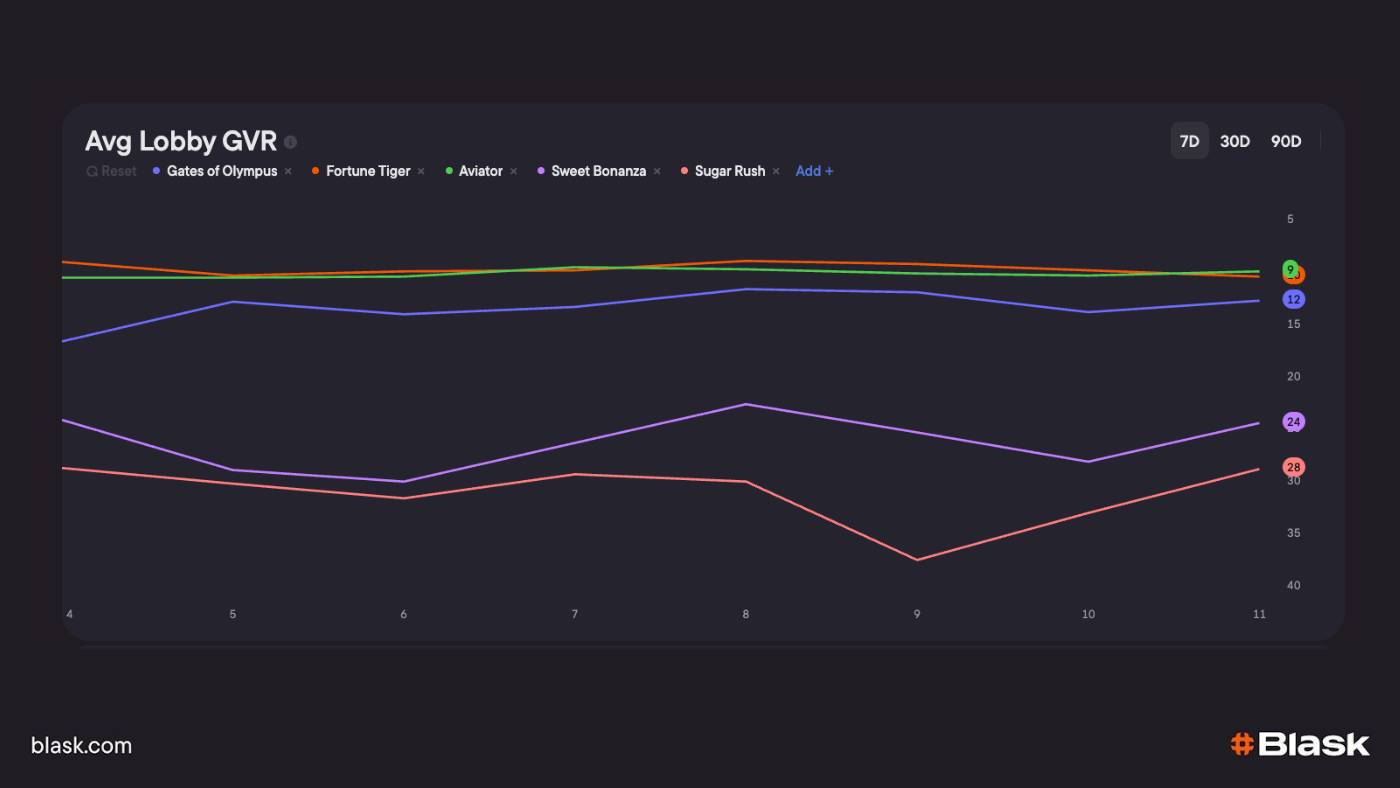
Watching lobby momentum.
Scroll once and the Avg Lobby GVR chart slides into view.
This line graph tracks the average seat a game occupies in casino lobbies across the market; seat 1 is front-and-centre, seat 100 is buried under a hundred tiles.
By default you’ll see the current top five games. If you prefer a different mix, tick any row in the table directly under the chart and the line is added or removed in real time.
A tiny time-range selector in the top-right lets you replay the last 7, 30 or 90 days.
🚀 Discover: 30 ways Blask Games empowers iGaming professionals
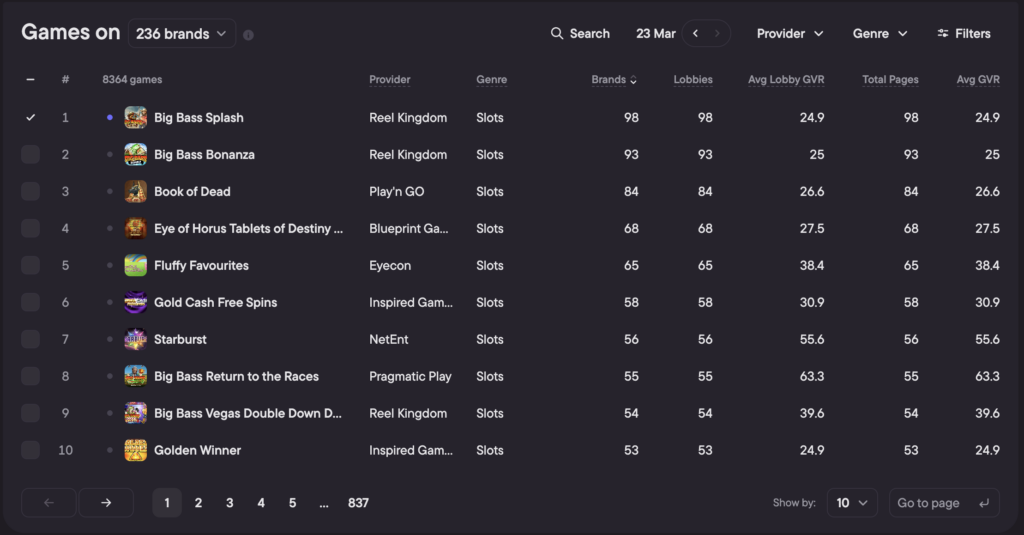
Diving into the full games table.
Below the chart sits a searchable list of every tracked game in the country — often thousands of rows. Standard columns show provider, genre, how many brands carry the game and how many lobbies feature it.
Two averages help you rank importance: Avg Lobby GVR (just the lobby pages) and Avg GVR (all pages, categories included).
Drop-down filters across the top edge let you narrow the list by genre, provider, visibility band, page count or brand count. A date selector with back/forward arrows lets you browse any historical day’s data. You can also nudge the page-size selector to show ten, twenty or thirty rows at a time. Click a game’s title and you jump to its dedicated page.
📌 Dive into: Inside Blask’s lobby‑position engine
✨ A word on GVR itself.
Game Visibility Rank is intentionally simple. Blask crawlers take a full-length snapshot of every lobby in the small hours, read the tiles left-to-right, top-to-bottom and assign sequential numbers.
Position 1 is the first tile, 2 the second, and so on.
When the site only shows ten tiles, the highest possible rank is ten; when it shows two hundred, every one of those seats is counted. The “average” variants on this page are just the arithmetic mean of those raw seats across all relevant pages.
Smoothly tucked just beneath the Lobby-GVR block, the interest cluster adds the “why players care” layer to the “where games sit” story.
Blask Index line-chart.
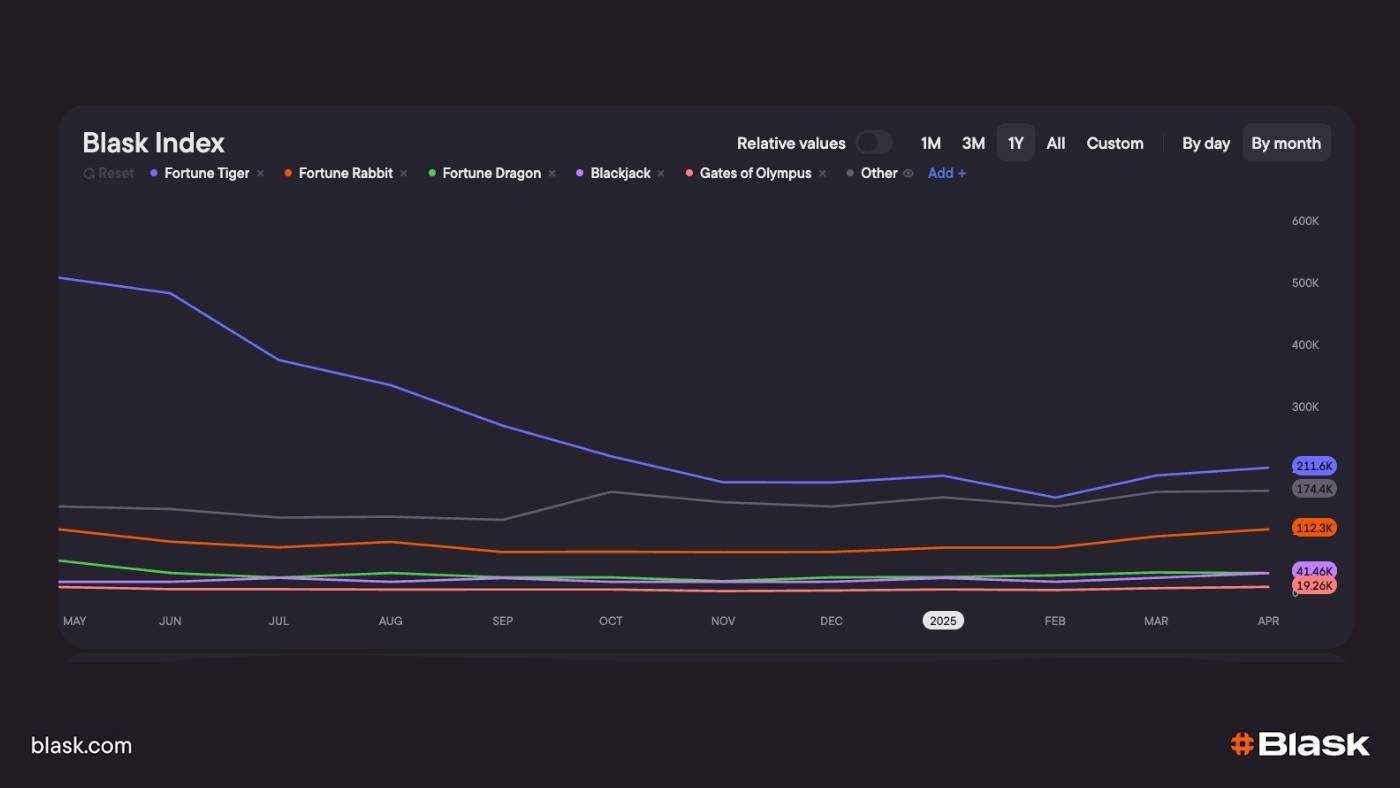
As soon as the page loads you’ll see a deep-navy canvas headed Blask Index.
Five colour-coded lines (the country’s most popular games by default) drift across the months. Hovering any point pins the exact search-volume proxy; clicking a title in the legend drops it from view so you can focus on the outliers.
A switch marked Relative values hides the grey Other ribbon (with the games from 6 to +100 positions) and normalises scales, handy when one hit title dwarfs everything else.
To the right you can flip the period (1M, 3M, 1Y or a custom range) and decide whether each dot represents a day or a month. Together these controls let you zoom from a single weekend spike to a multi-year trend in two clicks.
📊 Understand: How Blask calculates player interest for casino games
✨ Heads-up
Every point is the game’s Blask Index for that date – a figure that acts like a Nasdaq ticker for iGaming demand. Lower line? Interest cooled. Sudden lift? Something (a promo, a Twitch stream, a sponsorship) just worked.
Share of Interest stacked bars.
Directly underneath, the SoI chart turns those same numbers into percentage slices of a 100-point column. In moments you can see who truly “owns” attention each month and how quickly the pie is being re-cut. The time-range, granularity and Relative values toggle behave exactly as on the Blask Index widget, so exploration feels seamless.
Game table.
All underlying data lives in the master list that follows. Each row carries the game’s genre, theme, provider and three live metrics — SoI, YoY and MoM. Click any column header to re-sort; use the inline drop-downs (Genre, Theme, Provider, Share of Interest, YoY, MoM) or the Filters drawer for multi-criteria slicing; choose to display 10, 20 or 30 rows at once; and tick a game to push it straight onto both interest charts above.
Selecting the title itself opens its dedicated detail page for a lobby-plus-search deep dive.
✨ That’s it — one strip for placement, one strip for demand, and a table that binds them. Nothing t learn, everything to discover.
Tailor the page to the way you think.
Every widget — Blask Index, Share of Interest, Avg Lobby GVR, the master table — can be dragged up or down the stack, or folded away entirely. Click the ⬍ icon in its header to move it, tap the ▾ chevron to collapse it into a compact strip (as in the screenshot), and build a workspace that shows only the signals you care about.
Your layout is stored locally, so the next time you open a country profile the dashboard snaps back exactly as you left it.
How new games appear so quickly.
Whenever the crawler meets an unfamiliar thumbnail, a computer-vision model flags and stores the logo.
Brand Discovery then reads publisher sites, press releases and social media to discover the phrase real players use when they search for the game.
A human editor rubber-stamps edge cases such as “Crazy Time” versus “Crazy Time Live”. At the next nightly run the crawler can already recognise the newcomer everywhere, so its GVR values a land in the dashboard within twenty-four hours of the original sighting.
Ready to try it on your own data?
Book a live demo and we’ll load your market, your games, your competitors — so you can rearrange the widgets in real time and see how Blask Games streamlines your daily workflow.