
- Updated:
- Published:
iGaming industry trends 2026 from Blask experts
In 2026, iGaming trends feels less like a marketing arms race and more like a regulated, data-driven consumer economy. The winners aren’t the loudest brands or the fastest bonus spammers. They’re the teams that can prove trust, move money instantly, ship product iteratively, and measure quality over the full customer life cycle.
The new game grammar
Light mechanics, instant formats, and decision-based play take over
The most surprising “innovation” of 2026 is restraint.
Game design is moving toward lighter mechanics and faster comprehension — the kind that works in a scroll-first world, where attention behaves more like a feed than a session. This isn’t a niche preference.
It’s a distribution strategy: the simpler the mechanic, the easier the replay loop, the easier it is to travel through streams, short clips, and messenger-native formats.
Instant games and decision-based games fit the moment because they compress time-to-reward and give players the feeling of agency. New formats are emerging not just from creativity, but from physics: mobile constraints, payment frictions, regulatory guardrails, and the realities of how games get discovered now.

Distribution moves upstream
Streaming-driven launches, creators > affiliates, and apps embedded in other products
A quiet reordering is underway: games increasingly launch in public, not in lobbies.
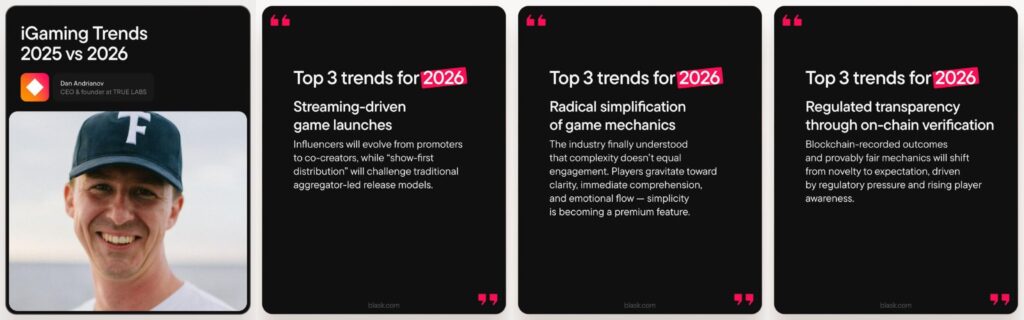
In 2026, the streamer is often the first storefront. “Streaming-driven game launches” describe a world where the first meaningful audience doesn’t discover a title inside an operator’s carousel, it meets it in a live moment, with social proof, frictionless narrative, and community energy.
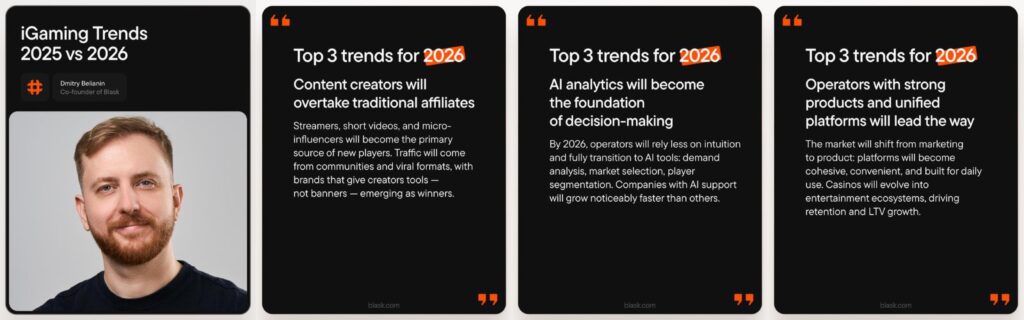
That same logic explains why content creators begin overtaking traditional affiliates. It’s not that affiliates vanish; it’s that the most valuable acquisition is shifting toward communities and repeatable culture, not placements.
And the final step in this chain is integration: iGaming apps increasingly show up inside other products —crypto wallets, messengers, streaming platforms, where identity, payment, and habit already live.
This is platform convergence applied to gambling: distribution becomes native, not routed. (It mirrors broader platform convergence trends across gaming more generally.)
Read also: How do iGaming affiliates use Blask?
The trust stack
Stronger regulation, emerging verticals, and on-chain transparency
The industry’s relationship with regulation has changed. In 2026, regulation is no longer the villain—it’s the sorting mechanism.
In the UK, for example, multiple rule changes have defined a clear direction: more consumer control, stricter marketing standards, and tighter guardrails around limits and fairness.
The Gambling Commission has published concrete timelines — such as requirements around deposit limits by 30 June 2026, and additional consumer-protection driven LCCP changes coming into force in March and April 2026.
🚀 Deep dive: Britain is still betting — but the tax rise turns steadiness into a stress test
Even promotional mechanics are being pushed toward clarity and reduced harm, with implementation dates landing in January 2026.
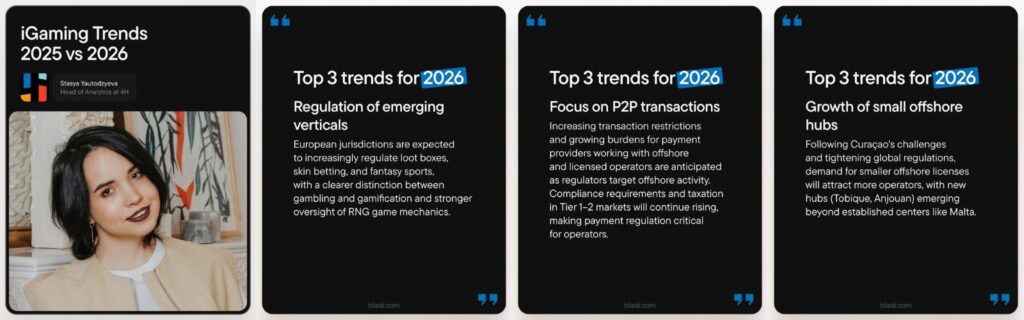
Meanwhile, “emerging verticals” (loot boxes, skin betting, fantasy-adjacent mechanics) keep drifting into regulators’ field of vision. European debates around addictive monetisation features and loot boxes are intensifying, with 2026 often treated as a plausible policy horizon.
On the transparency front, the industry is flirting with a concept borrowed from crypto: don’t ask players to trust — let them verify. “Provably fair” systems and on-chain verification models promise auditability by design, making transparency part of the product rather than a PDF in the footer.
Money rails become product
Instant payments, P2P focus, stronger controls, and crypto adoption
In 2026, payments are not plumbing. They are the experience.
Across Europe, instant bank payments and “pay-by-bank” models are becoming mainstream infrastructure, shaped by open-banking rails and regulation like PSD2 and the EU’s instant payments push.
Industry commentary increasingly treats “waiting for withdrawals” as a relic — players expect speed, and operators want predictable costs.
This is why several payment-related trends collapse into one story:
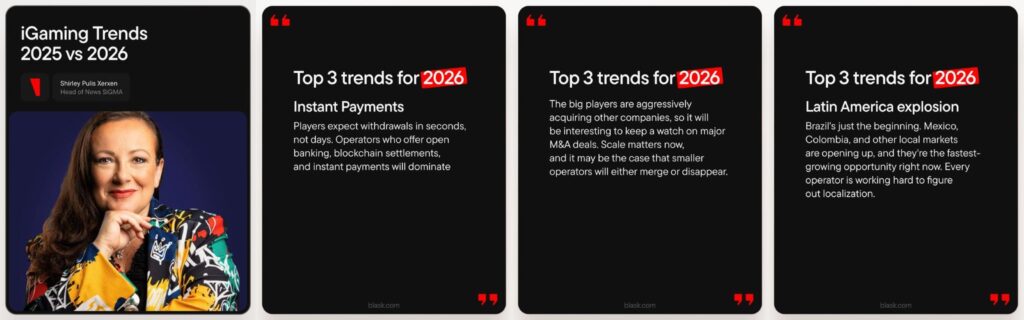
- Instant Payments: a retention feature disguised as finance.
- P2P transactions: a response to restrictions, chargeback risk, and regional fragility.
- Stronger payment controls + fraud prevention: the price of speed, and the consequence of stricter oversight.
- Crypto & blockchain adoption: still uneven, but persistent — especially where it reduces friction or expands distribution.
The market splinters — then consolidates
LATAM explosion, offshore hubs, WL stress-tests, and M&A gravity
Two forces define the market map in 2026: expansion and sorting.
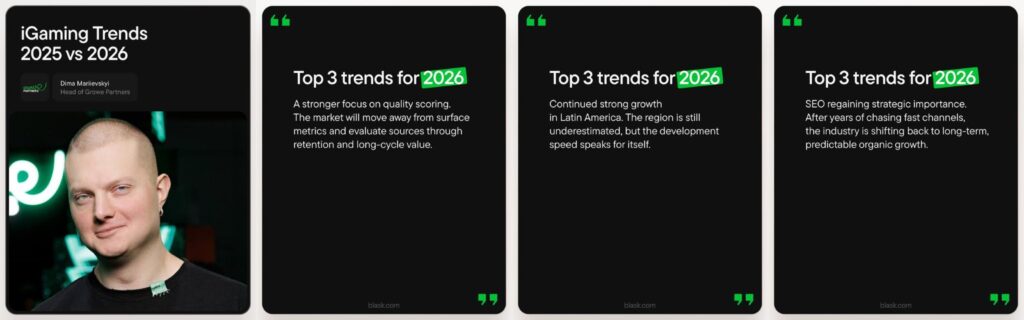
Latin America remains the headline growth narrative. Forecasting groups expect strong expansion in regulated online gambling across the Americas through 2026 and beyond, and industry reporting continues to highlight Brazil, Mexico, Colombia, and Argentina as the main storylines — each with distinct regulatory shapes.
Brazil is the clearest example of why growth is never simple: regulation arrives, enforcement ramps up, and the market becomes more expensive and more operationally demanding.
🛠️ Read more: Online gambling market forecast 2026: what the numbers actually say
At the same time, offshore doesn’t disappear, it mutates. New and smaller licensing hubs gain traction as operators search for speed and survivable economics, while traditional offshore jurisdictions reform to answer political and enforcement pressure.
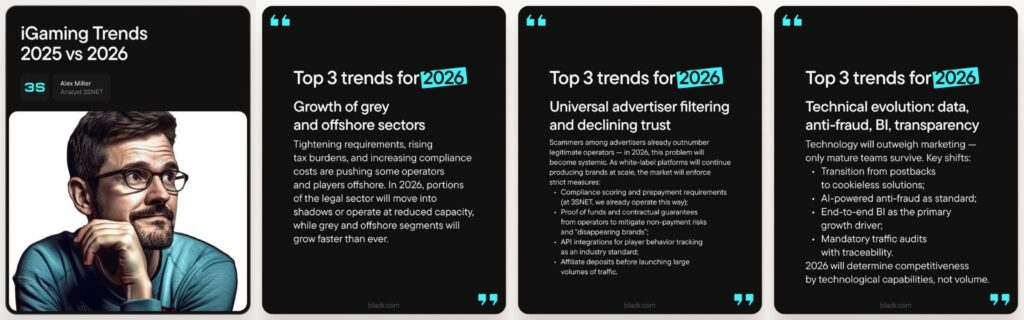
The result: continued “whitening” in some places, and growth of grey/offshore sectors in others.
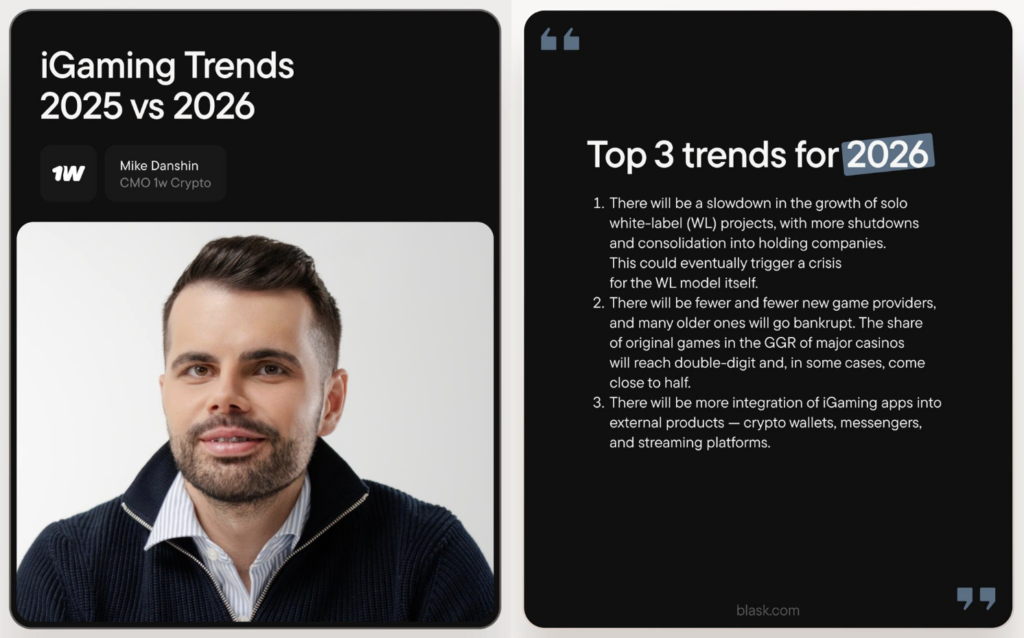
Now add the white-label story. White-label (WL) projects remain a gateway to launch, but 2026 looks like a stress test: partner oversight, compliance liabilities, and sponsorship optics increasingly fall under scrutiny.
The UK’s white-label controversies — high-profile enough to pull mainstream reporting — show how quickly “convenient” structures can become reputational risk.
Finally, consolidation. Top iGaming markets in 2026 are buying scale (licenses, distribution, user bases, tech) because the cost of building everything alone is rising. One example: Allwyn’s move into U.S. fantasy sports via a multibillion-dollar stake deal signals the broader appetite for adjacent growth engines.

The measurement regime
Quality scoring, advertiser filtering, long-term organic growth, and AI as infrastructure
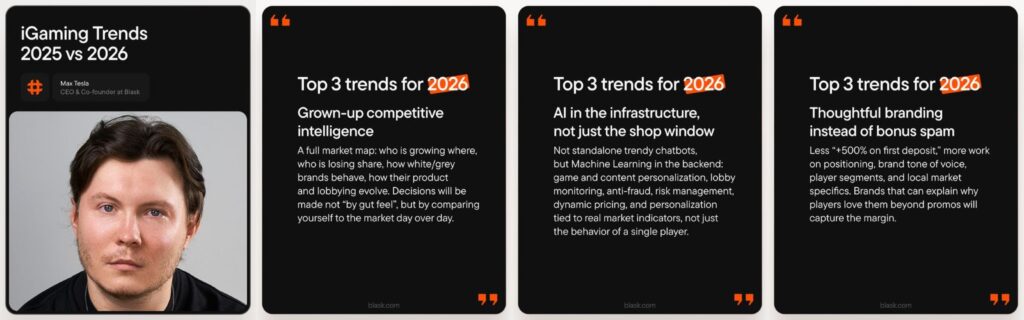
If 2026 had one governing idea, it would be this: the industry is moving from surface metrics to quality scoring.
Speakers call it “retention and long-cycle value.” Operators call it “unit economics.” Affiliates feel it as tighter terms and stricter vetting. The direction is the same: less tolerance for inflated KPIs, more appetite for durable value.
A parallel shift is happening in measurement itself. “Share of search” has gained credibility because it correlates strongly with market share across categories in published studies (often cited around the low-80% range on average).
That matters in iGaming because it supports a more market-level, comparable signal, useful for detecting momentum before finance closes the month.
This is also where AI stops being a product demo and becomes the operating layer. The industry rhetoric is converging on the same point: AI doesn’t replace teams; it replaces delays by pushing analytics, fraud detection, compliance monitoring, and decisioning closer to real time.
Universal advertiser filtering and declining trust — one of the core trends — fits here too. As the ecosystem fills with micro-brands and faster-to-launch setups, verification becomes a competitive advantage.
This extends beyond operators to networks and affiliates, who increasingly adopt privacy-safe and first-party measurement practices as the web turns “cookieless.”
And then there’s the old channel that becomes new again: long-term organic growth. After years of chasing fast acquisition, the industry swings back toward predictable demand capture: SEO, content, and brand search, because volatility is expensive.
Read also: iGaming market growth by region: who runs the table in 2026
Brand is Back
Thoughtful branding, authenticity, and unified platforms
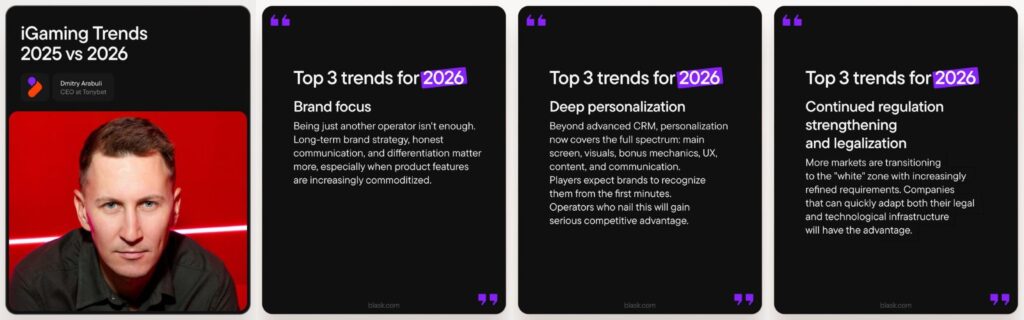
As promotions tighten and acquisition channels fragment, operators rediscover that “bonus spam” doesn’t build resilience. Regulation pushes clarity; payments push trust; content pushes tone. And players — especially in hyper-competitive markets — start choosing based on recognition, frictionless UX, and coherence.
At the same time, the “operator with a strong product and unified platform” becomes the default winner archetype: fewer disconnected tools, more integrated stacks, faster launches, and stable operations under load. (The platform convergence story isn’t unique to gambling; it mirrors broader gaming’s direction heading into 2026.)