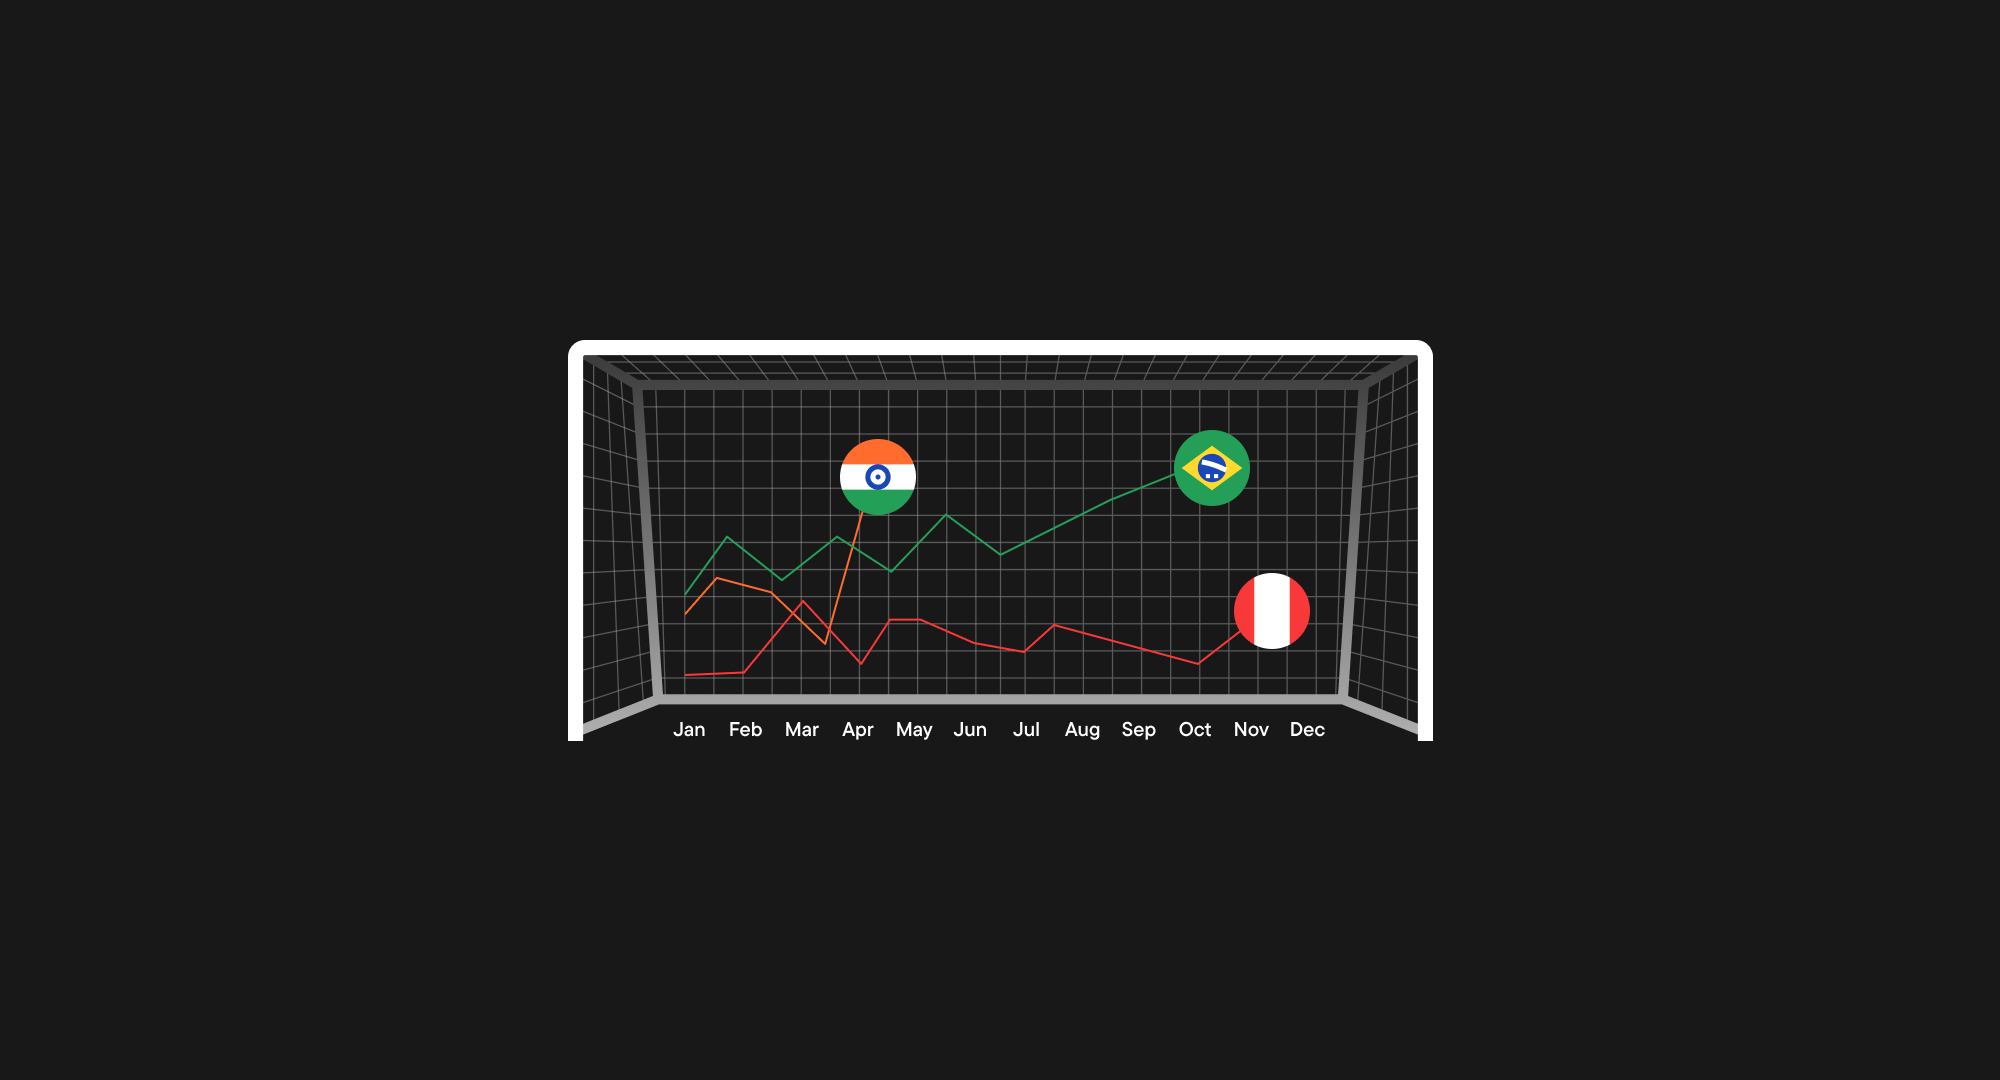
Every country has a handful of “magnet” dates when betting attention explodes — IPL double-headers in India, World-Cup openers in Brazil, national-team qualifiers in Peru.
Blask’s daily-granularity Index pinpoints those exact days (and, on the hourly view, the hottest 15-minute pocket), letting operators time promos, influencer drops and server scale-ups with surgical precision.
Find the events that trigger the biggest Blask Index peaks.
Blask Index now goes back to 2017 in daily resolution, so the tallest needles on the curve reveal the very day a market went white-hot. A Blask study tagged every yearly peak since 2019 and tied each to a single sporting fixture.
Country
Record daily peak
Magnet event
Insight
India
3M (28 Apr 2024)
Mid-table IPL double-header: Sunrisers v CSK & GT v RCB
IPL spikes grow yearly and cluster around days when four marquee teams share the schedule — not at the opener or final.
Brazil
10M (24 Nov 2022)
Brazil v Serbia, first World-Cup group match
World-Cup appearances and Copa América finals dwarf even Flamengo-Flu derbies.
Peru
2.8M (18 Dec 2022)
Argentina v France World-Cup final
Neutral-fan markets still spike for global finals; national qualifiers drive the other peaks.
How to use it
Open the daily Index for your target country and mark the top five peaks.
Cross-check with sports calendars to confirm the event (Blask’s study sheet is a shortcut).
Build a “magnet calendar” so every campaign, bonus or server-capacity plan rides those pre-known waves.
✨ Next step? Check whether those surges repeat every season (IPL has, six years running) and which rivals harvested them best.
Check if the spike repeats every year — history usually rhymes.
Blask’s daily-granularity view lets you scroll back to 2017 and verify whether the same event lifts the curve season after season.
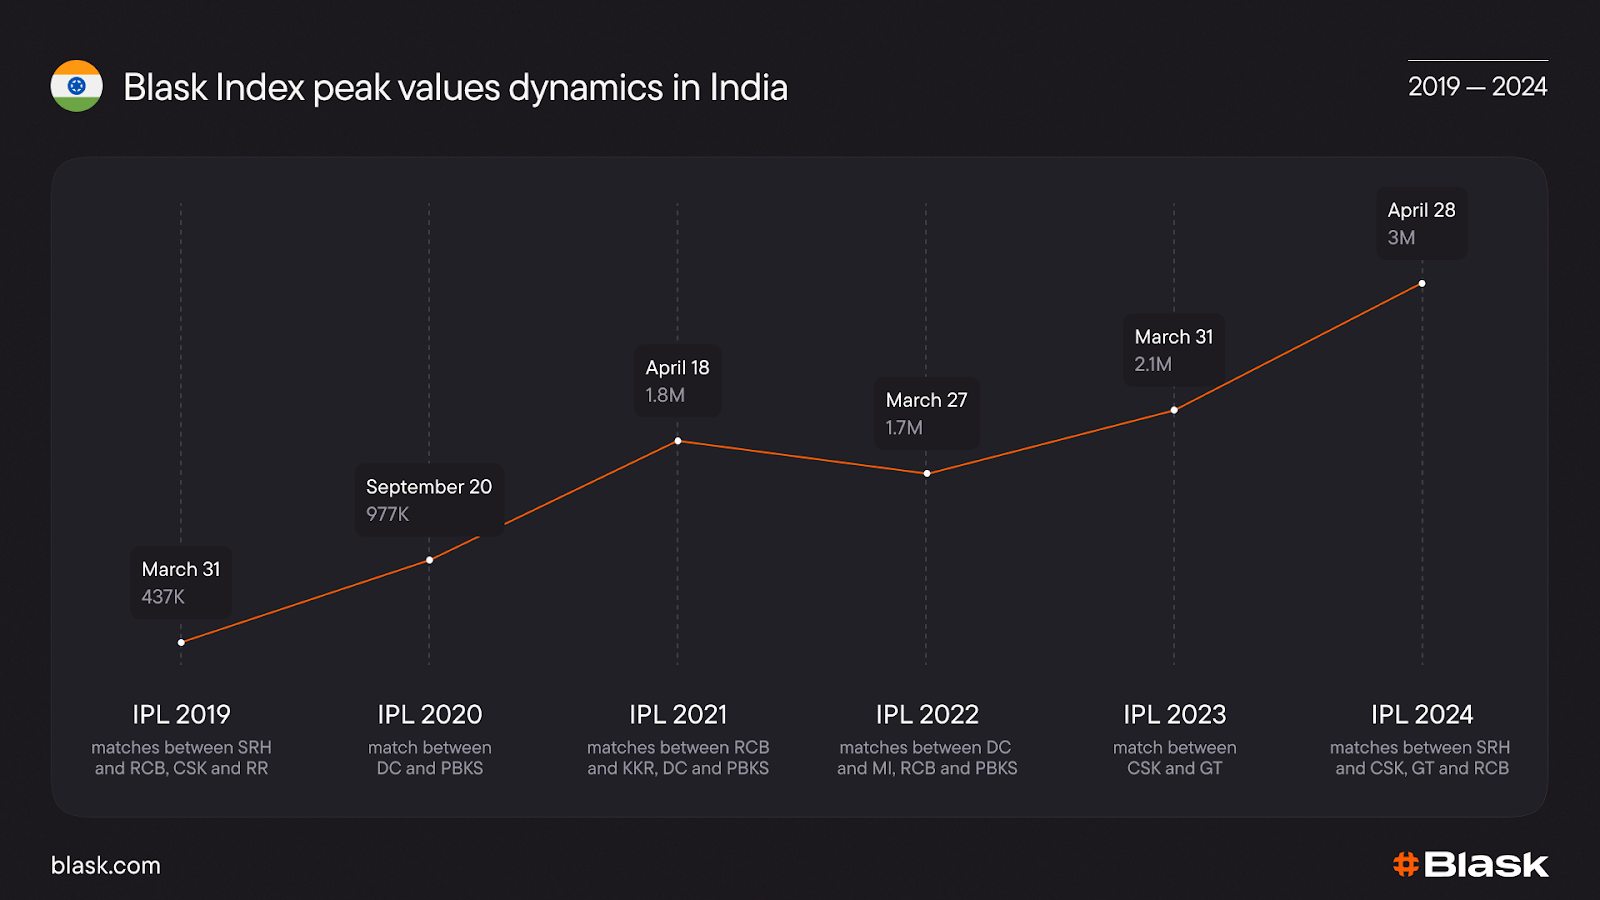
In India, the answer is a loud yes: every year since at least 2019 the highest point on the Blask Index has fallen on an IPL match-day, and the magnitude keeps snowballing — 437K in 2019 till the record 3M in 2024 when two mid-table double-headers featured four marquee teams.
Blask Index peaks in India
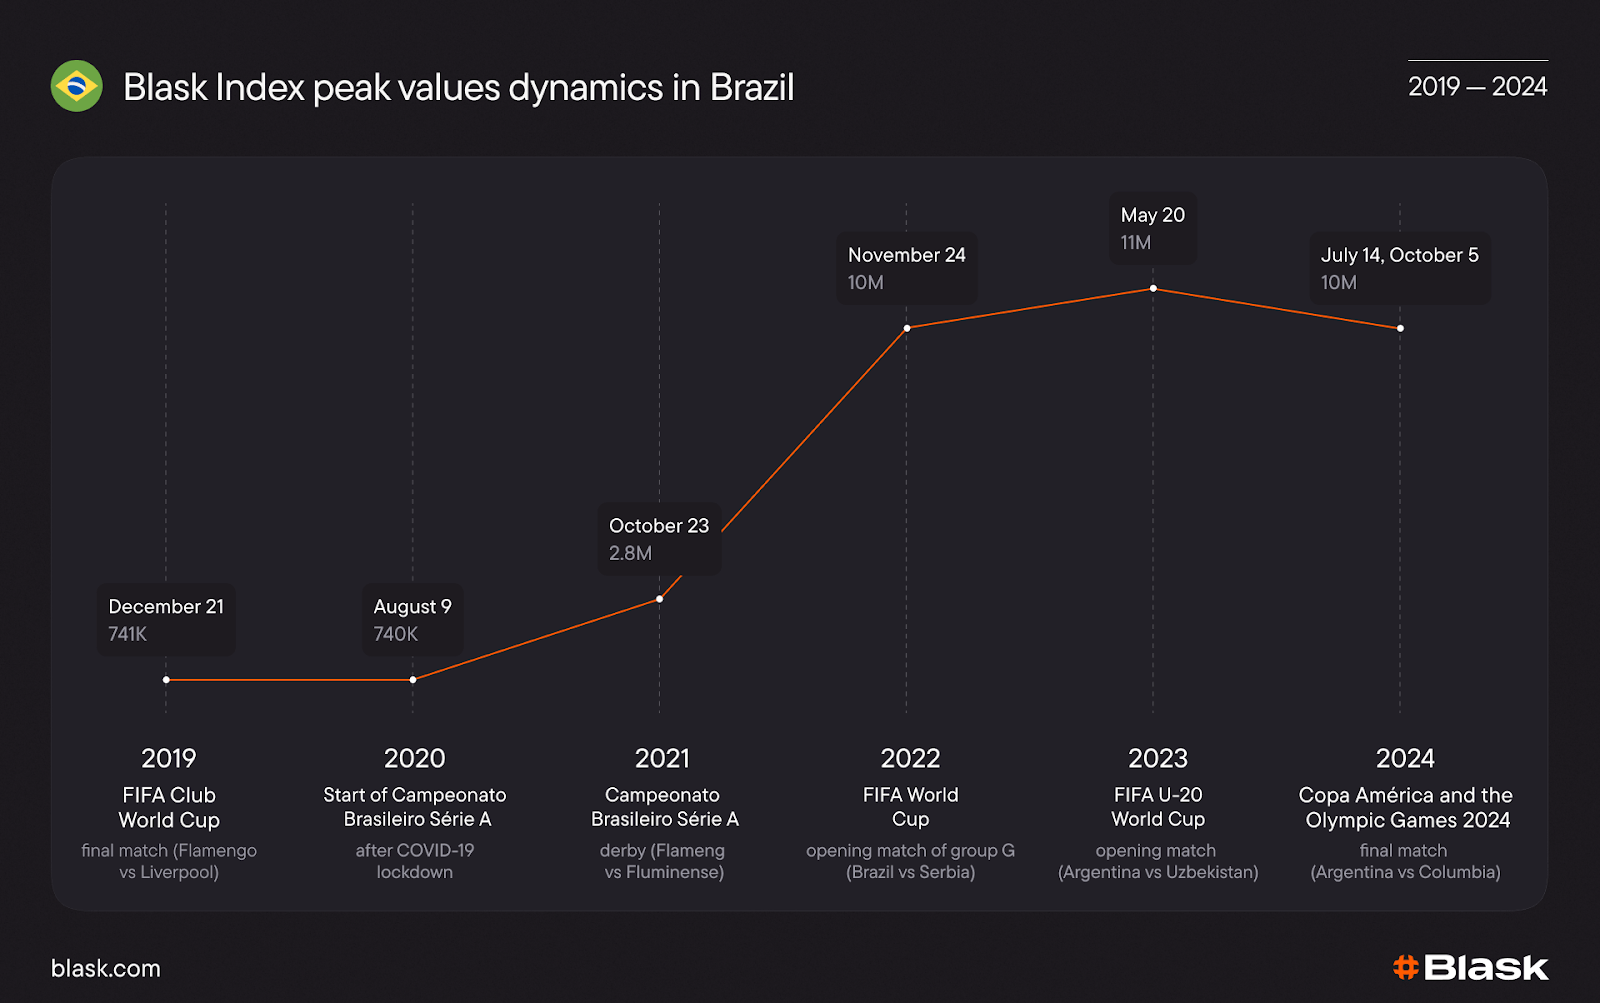
Brazil shows a similar pattern, but with a rotating cast of football magnets: Club World Cup final 2019 (741K), pandemic-postponed Brasileirão restart 2020 (740K), Flamengo-Fluminense derby 2021 (2.8M), Brazil’s first World-Cup group match 2022 (10M), FIFA U-20 opener 2023 (11M) and the Copa América final / Paris Olympics double-peak in 2024 (10M).
Blask Index peaks in Brazil
Football is the constant; the tournament that delivers the punch changes year to year.
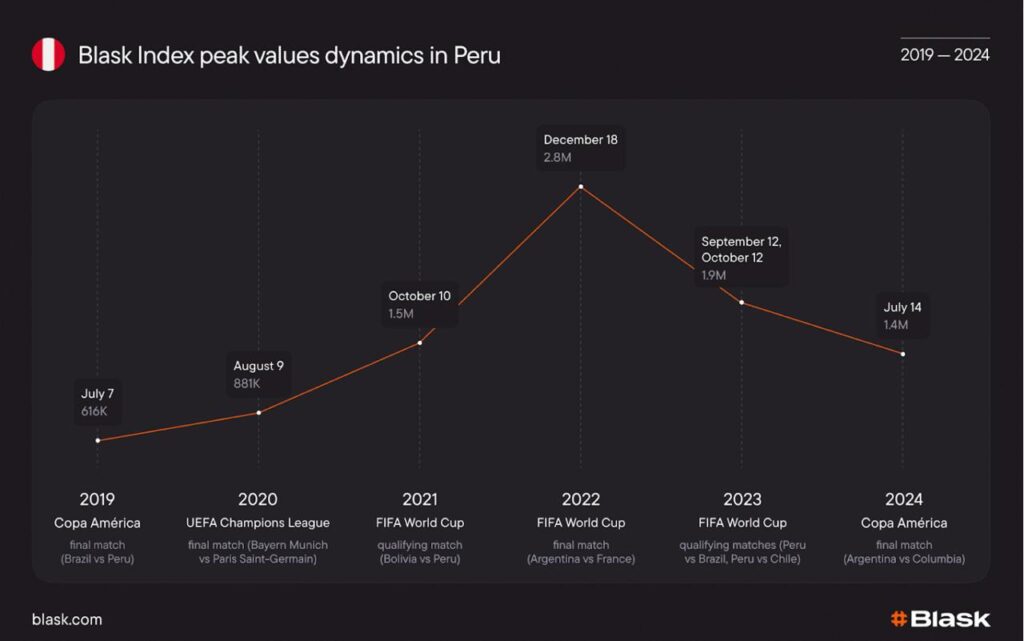
Peru’s curve is even more event-specific: Copa América final 2019 (616K), Champions-League final 2020 (881K), Bolivia WC-qualifier 2021 (1.5M), Argentina-France WC final 2022 (2.8M), home WC-qualifiers in 2023 (1.9M) and the Copa América final 2024 (1.4M).
Peaks always align with matches carrying national-team pride.
Blask Index peaks in Peru
Why this matters
If an event drives the top spike every year, you can lock promo budgets 6–12 months ahead, negotiate early media and influencer slots, and pre-load campaign assets—confident the surge will return.
The magnitude trend tells you how much extra capacity (servers, KYC staff, risk monitoring) to stage: India’s IPL peak has grown 6× in five seasons, so infra needs scale accordingly.
For markets with rotating magnets (Brazil), build a flexible creative template you can skin for club derbies, World-Cup nights or Olympic finals without starting from scratch.
✨ Next up: identify which competitors already exploit those magnets — Stake’s 2024 IPL coup is a textbook example — and what offer mechanics won them the extra share.
See which rival milked the spike and how with Blask Index
Once the calendar magnet is fixed, switch Blask Index to brand view and replay the curve across the event window.
The steepest vertical jump reveals who captured the surge and, via promo forensics, how they did it.
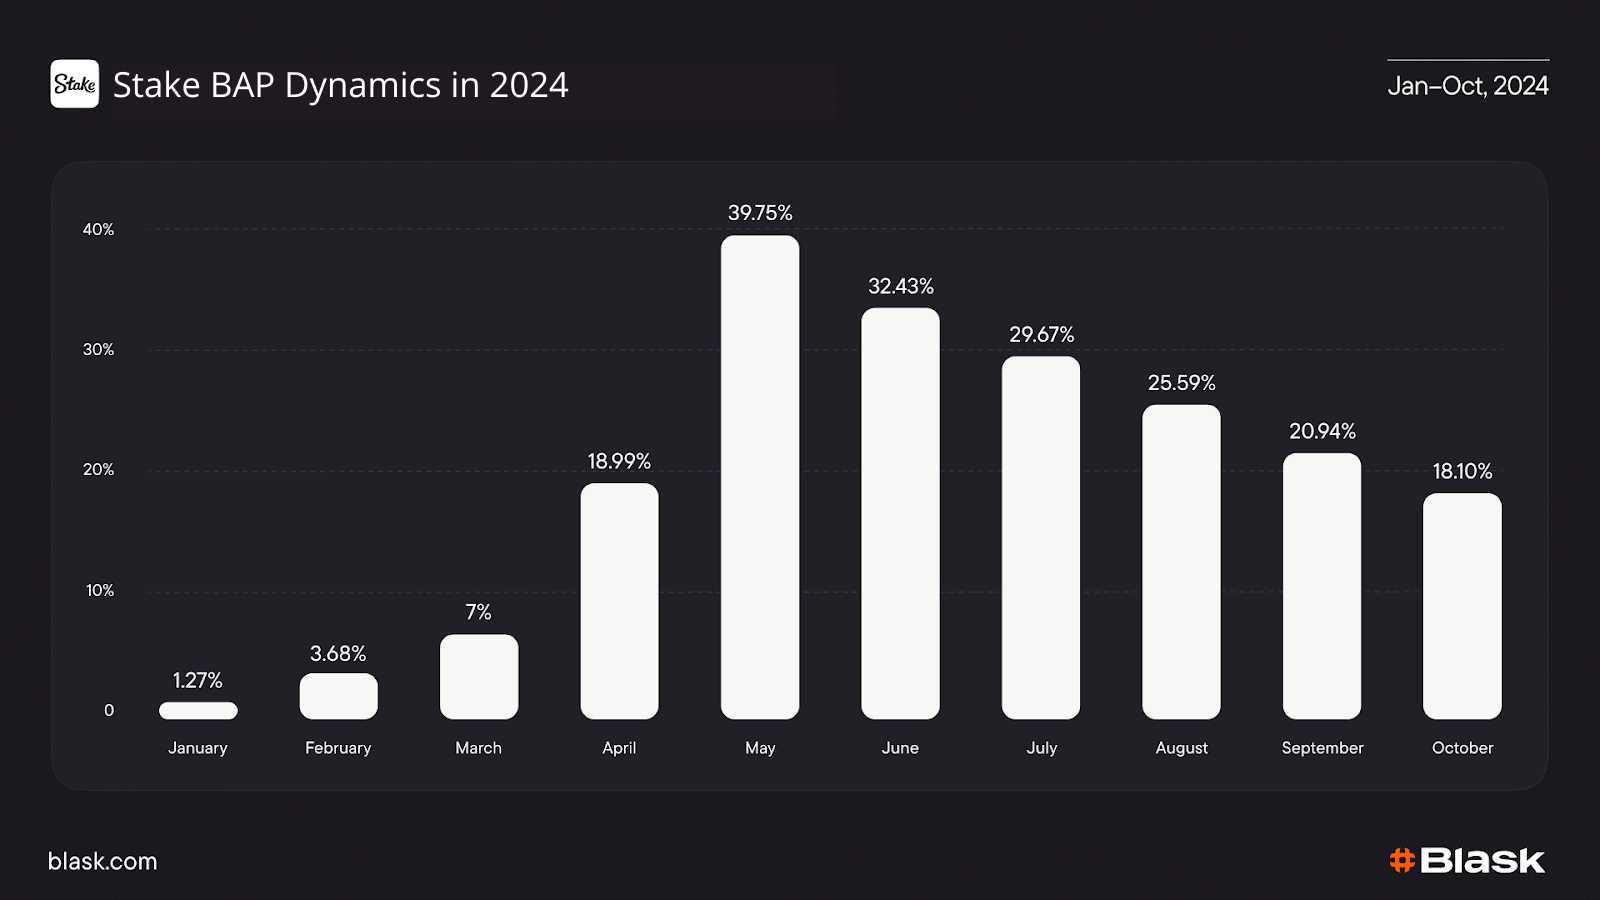
Stake, IPL 2024 (India). Brand-level Index shows a 2.7M → 25M climb between March and May.
The lift starts the week Stake enables INR deposits and explodes when its “Early Six, You Win” promo pays bettors if their team hits a six in the first four overs—63 % of chosen matches triggered the payout.
What the numbers mean. The same chart confirms that 80 % of promo participants were first-time depositors and pushes Stake’s Relative Market Share to 39.7 % at the IPL peak.
How to replicate the competitive scan
Filter Index by brand for the event month; sort by largest single-day delta to spot the winner.
Open the rival’s promo feed (site footer, socials, affiliate mailshots) and log mechanics, stake limits, payout moments.
Compare with your own curve. If their vertical jump beats yours while BAP is similar, their offer or timing — not budget — is the gap.
With Blask Index you don’t have to guess who won the event-week battle; the line tells you, and the timestamp tells you when to strike back.
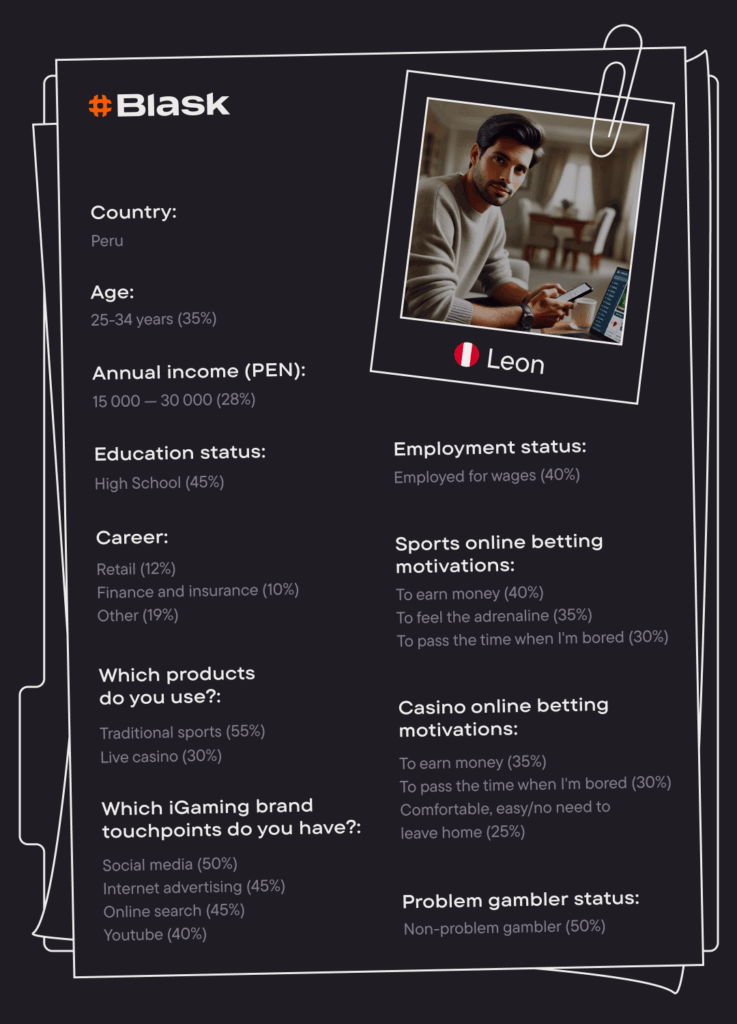
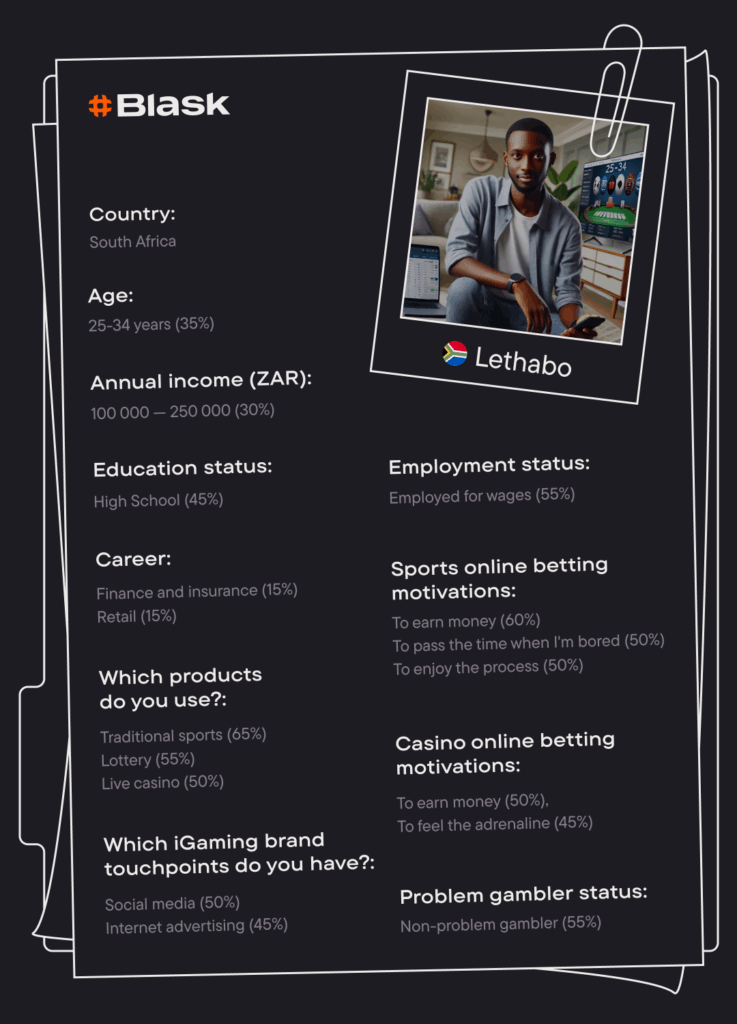
Aim the right message at the right cohort — use Customer Profile and “All Metrics”
Blask’s Customer Profile turns 80 000 survey interviews, open-web behaviour and regulatory datasets into nine hard metrics for every national audience: age band, income range, education, career, preferred product, sports-betting motive, casino-motive, first brand-touch-point and problem-gambling risk.
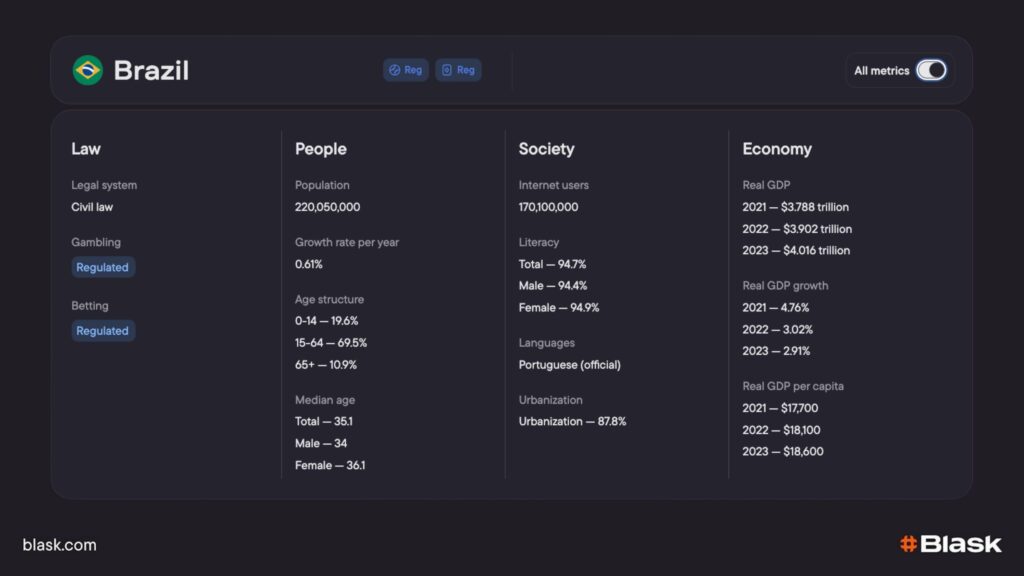
✨ Bottom line: All-country metrics tell you where momentum lives; Customer Profile tells you who fills it; the hourly Index tells you when that cohort peaks. Combine the three and every local surge becomes a precision-guided acquisition moment — without collateral spend or regulatory headaches.
Brazil all metrics
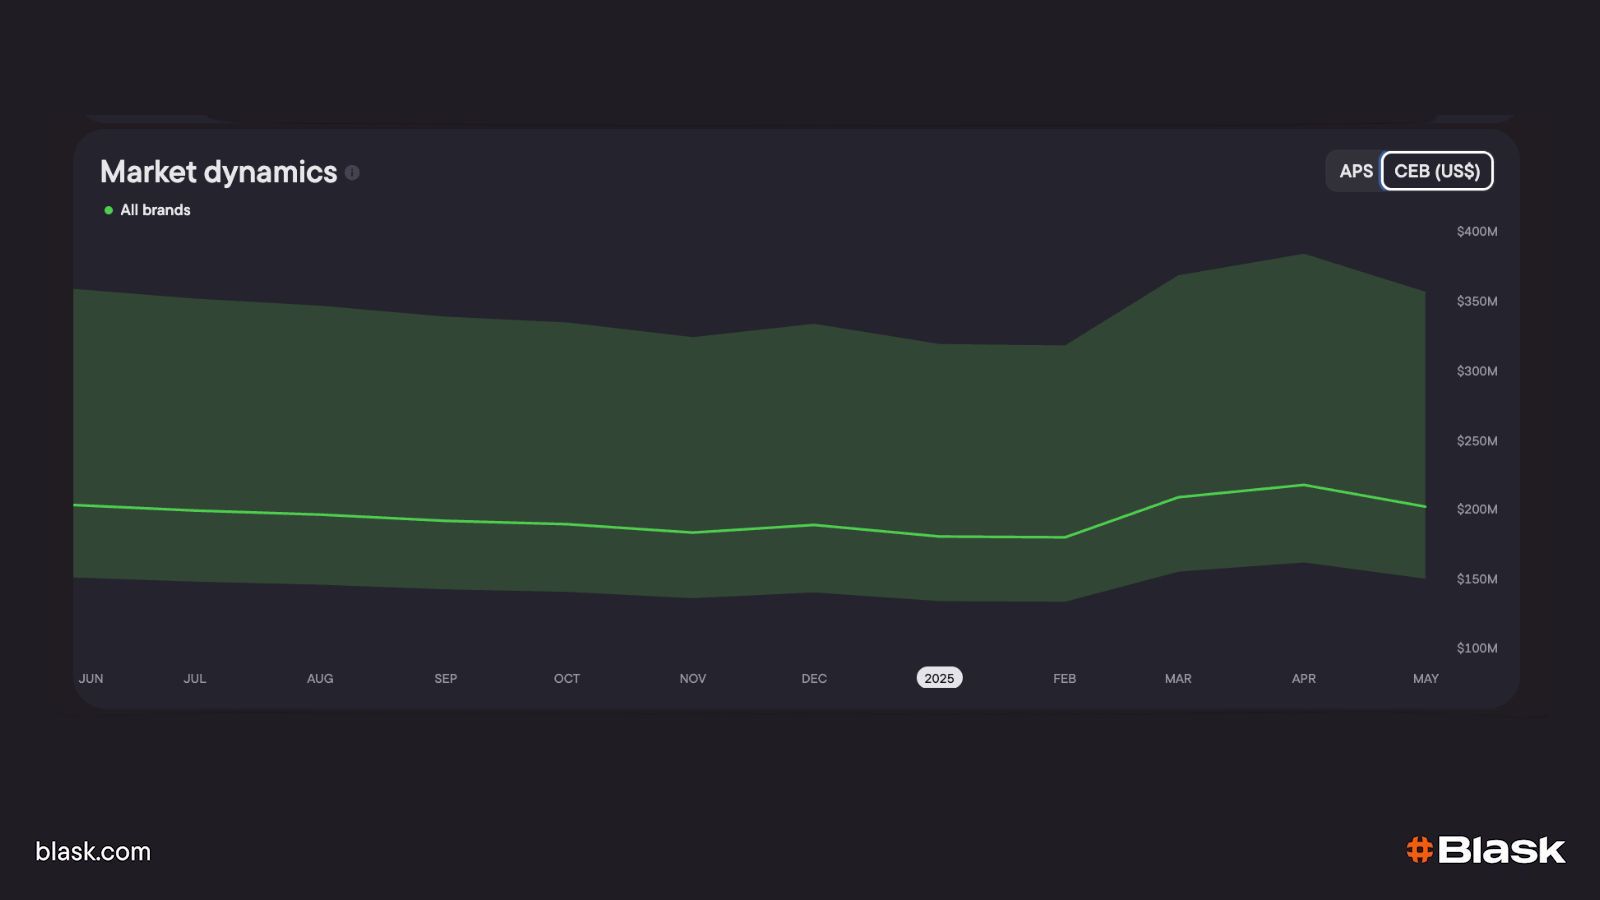
Track BAP in real time — then grade the whole campaign with APS & CEB.
Watch the bar while the promo is live
Brand’s Accumulated Power updates every hour, so you can literally see the curve bend the hour a banner, bonus or influencer post lands.
Keep the dashboard open during the magnet event: if the bar chart of your brand climbs faster than your competitors, the campaign is compounding; if it stalls, you still have hours to tweak placement or raise odds before peak traffic subsides.
Post-event scorecard — internal vs. Blask benchmarks
The morning after the surge ends:
Pull your own KPIs – FTD count, net gaming revenue, retention.
Open APS (published on the 10th). It shows the FTD range you should have hit, calculated from last month’s Index, social buzz, app-store rank and affiliate reach.
Open CEB for the same month. It converts your APS + BAP + macro factors into a USD corridor of realistic GGR.
Filter the Brands table to operators sitting ±1 pt of your BAP. If a neighbour with the same share of attention converts a green APS band while you languish in red, the gap is funnel efficiency — copy their promo timing or payment mix.
If their CEB ceiling is double yours, they monetise better; study their product breadth or licence footprint. Blask’s launch note on APS/CEB stresses that the twin metrics exist to make cross-brand comparisons transparent.
Wrapping it up
Local sporting “magnets” – IPL double-headers, Brazil’s first World-Cup kick-off, Peru’s must-win qualifiers – are predictable, measurable and wildly profitable once you run the full Blask stack.
Daily + hourly Blask Index tells you exactly when the surge hits.
Brand-view Index & BAP show in real time who is winning the surge – and whether your own curve is compounding or stalling.
Customer Profile narrows the target to the cohort most likely to click, while keeping high-risk players out of scope.
APS & CEB grade the whole sprint after the dust settles and let you benchmark funnel- and revenue-efficiency against rivals with the same slice of attention.
Run that loop for every recurring spike and you turn a calendar of local events into a rolling, data-backed growth engine – no guesswork, no wasted bonus spend, no regulatory blind spots.
Yana Makarochkina is the Chief Marketing Officer at Blask, specializing in B2B and iGaming content marketing. With a background in journalism and agency experience across industries from hospitality to logistics, she combines strategic thinking with a passion for fact-based storytelling — making complex ideas clear, compelling, and actionable.
Legal poker rooms operate in fewer US states than legal online casinos — offshore operators fill the gap. In the US, online poker is regulated in eight states, but only six of them have licensed operators actually running games. That is a consequence of how the vertical works — and it does not help channelise […]
Most iGaming operators benchmark against their own past performance. That only tells you if you’re growing — not whether you’re winning. This article explains how demand-based signals reveal where any brand actually stands in a market, from #1 to #164.
Blask data shows how much the Indian iGaming market depends on cricket events, especially on the domestic league. Cricket is the number one sport in India — Blask data reveals that iGaming demand in the country strictly follows the cricket calendar. The main booster is the Indian Premier League (IPL) — domestic league, running roughly […]