Gross Gaming Revenue (GGR)
Gross Gaming Revenue (GGR) is the total revenue from iGaming, calculated as deposits minus payouts. Blask provides monthly GGR data in USD, helping brands assess market position and compare performance. Compare GGR with competitors to optimize strategies.

GGR (Gross Gaming Revenue) is the total revenue generated from iGaming activities. It is calculated as the difference between the amount deposited by players and the amount paid out in winnings.
Blask calculates GGR monthly and provides this metric for both brands and countries. GGR is measured in US dollars and available only for completed months and at a monthly granularity.
When Blask collects the data: We collect data for the previous month during the first week of the current month. For example, during the first 7 days of June, we gather data for the entire calendar month of May.
How to interpret the GGR chart in Blask?
Blask defines the Gross Gaming Revenue (GGR) metric as a range rather than a specific value. If your brand's figures fall within our calculated range, it means you are performing in line with the market. If your figures are below the range, you should pay attention to your conversions and product. However, if your values exceed Blask's calculations, congratulations—you outperform the market!
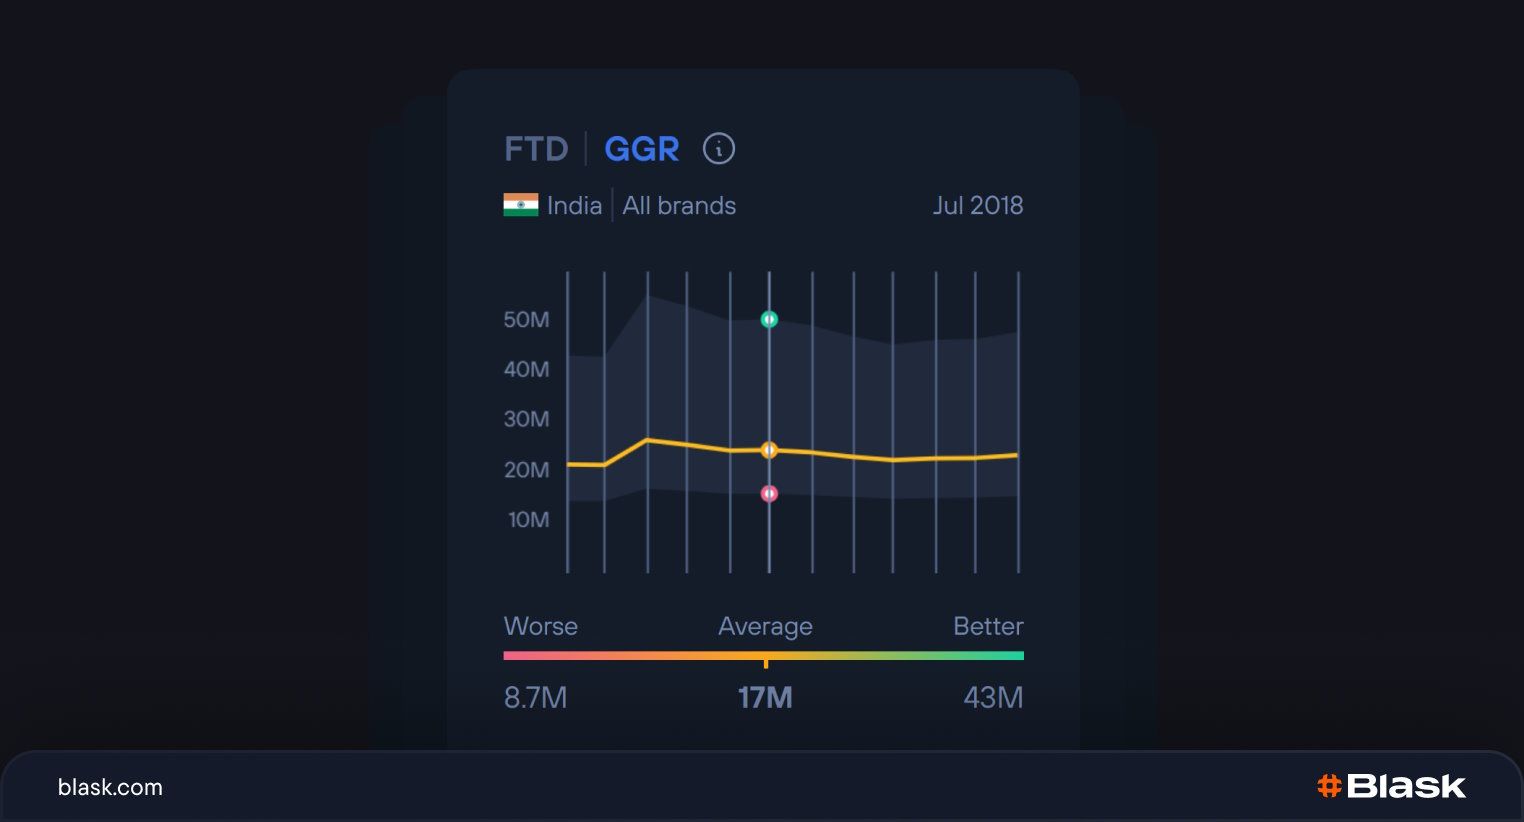
From this chart, we observe the fluctuations in GGR for India over the period of 2018-2019. For June 2018, Blask estimates the GGR to range from $8.7 million to $43 million, with the most likely value being $17 million.
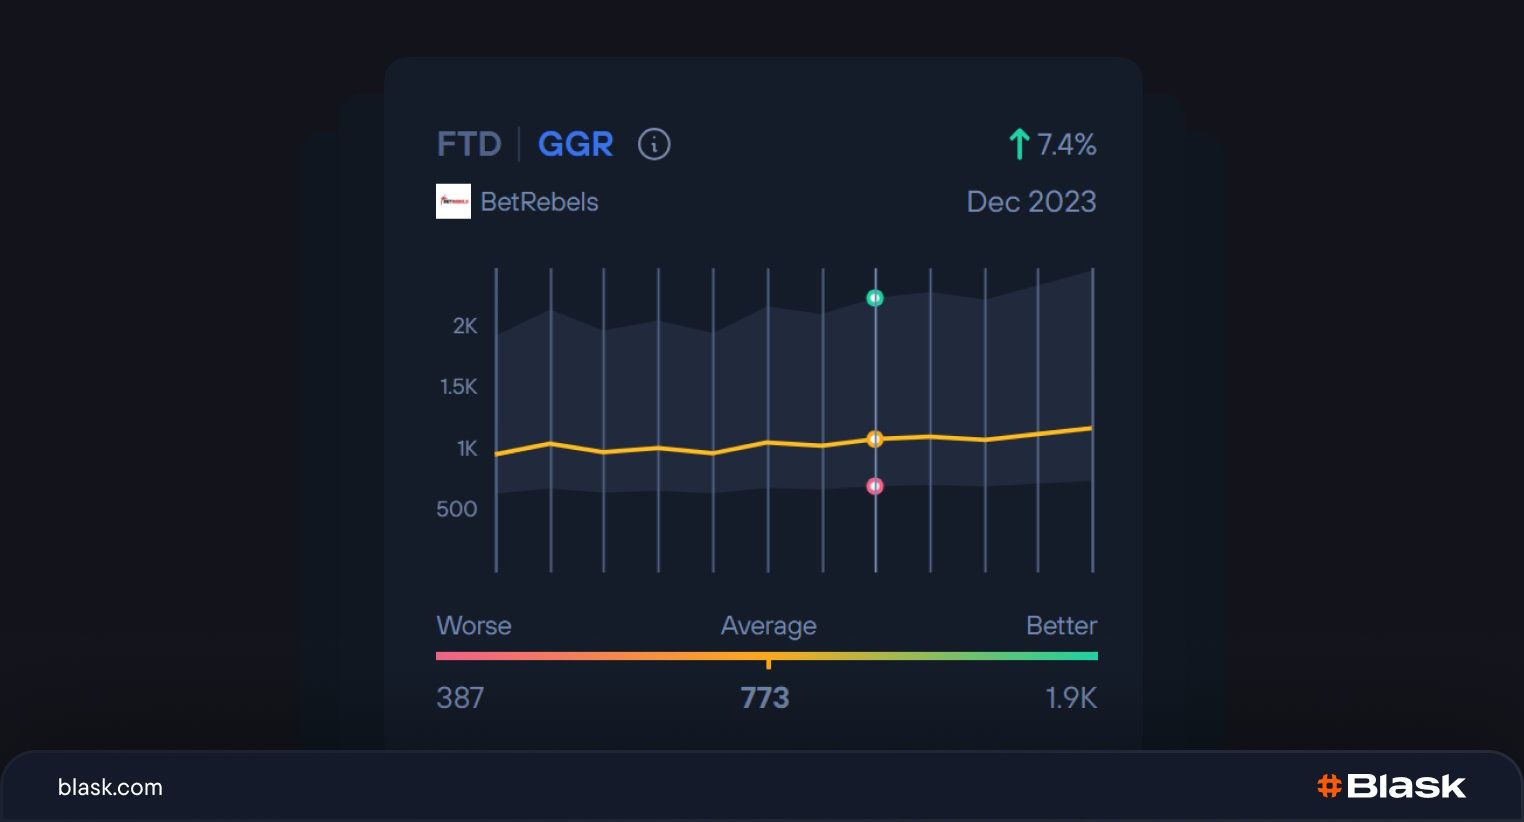
The GGR chart is also available for each of the brands that Blask collects statistics for.
From the above screenshot, it is evident that the brand BetRebels saw a 7.4% increase in GGR in December 2023 compared to the previous month, earning approximately $773.
Our AI models can achieve remarkable accuracy in predicting GGR indicators, reaching up to 95%. However, it's not just about the numbers. You have the ability to compare performance indicators not only through your internal analytics but also through Blask with your direct competitors, enabling you to see who is performing better.
For instance, consider Brand A, with a GGR of 27k on Blask, and Brand B, with a GGR of 30k. Brand B is performing better.
How does Blask calculate Gross Gaming Revenue (GGR)?
To predict the GGR for a brand for a specific month, Blask considers the following factors:
- The calculation of GGR starts with our core metric, the Blask Index.
- Using the Blask Index, our AI model derives data on First-Time Deposits (FTDs) for the selected month for the chosen brand.
- Then Blask multiplies the FTD count by the average market revenue per player.
- Takes into account the brand's existing player base based on previously calculated FTDs and average market conversion rates.
- Blask sums the revenue from new players and the revenue from previously acquired players.
Blask obtains data on average market conversion rates and revenue per player from industry experts or publicly available data from regulatory committees.
To obtain a brand's GGR over a period of several months or years, Blask sums the GGR for each individual month.
To calculate a country's GGR, Blask aggregates the GGR of each brand present in the selected country's market.
How to use the Gross Gaming Revenue (GGR) metric effectively?
The GGR metric summarizes the success of an iGaming brand by quantifying the amount of profit it generates over a specific period of time.
Measure your brand's market position.
If your GGR values are below Blask's estimates, it means you are missing profit opportunities. Earned more than our estimates? You’re a superhero in the iGaming market! If your values fall within our range, your brand aligns with the average market performance.
Compare GGR alongside FTD.
Suppose you are planning to expand your brand into a new country. Analyze both metrics to make an informed decision:
- Some countries have many players but a low average revenue per player.
- Conversely, there are countries with fewer players but significantly higher revenue per player.
GGR and FTD: Chile vs. Mozambique. 2023.
| Chile (2023) | Mozambique (2023) |
|---|---|
| GGR: $77M | GGR: $73M |
| FTD: 1.8M | FTD: 4.4M |
Let’s compare Chile and Mozambique. In 2023, both countries show nearly identical GGR: $77M and $73M, respectively. However, Mozambique had to attract 4.4M new players, while Chile only needed 1.8M.
Track competitors' revenue sources.
Some brands actively attract new players and derive most of their revenue from them. Others balance new marketing activities with retaining existing players. Meanwhile, some brands rest on their laurels and continue to earn good profits without attracting a new audience.
As with the previous advice, analyze GGR alongside FTD to understand which players contribute most to the brand's revenue.
Track brands’ performance.
Compare brands using key performance indicators such as GGR and FTD, then align these metrics with the brands' marketing activities.
With Blask, you can accurately determine how attractive commercials, sports team sponsorships, and high brand awareness impact revenue (or don't). Emulate only effective marketing strategies from your competitors.