- Updated:
- Published:
5 ways to benchmark your iGaming brand in a crowded market
In a market where 160+ brands can fight for the same bettor, benchmarking starts with seeing everyone, tracking demand as it moves by the hour, then matching those signals to acquisition, revenue and lobby placement.
Blask’s AI toolkit does exactly that through Brand Discovery, Blask Index & BAP, APS, CEB, GVR and Customer Profile. The five tips below show where to look on the dashboard and what to do with the insight.
See every competitor — and gauge just how crowded the field really is.
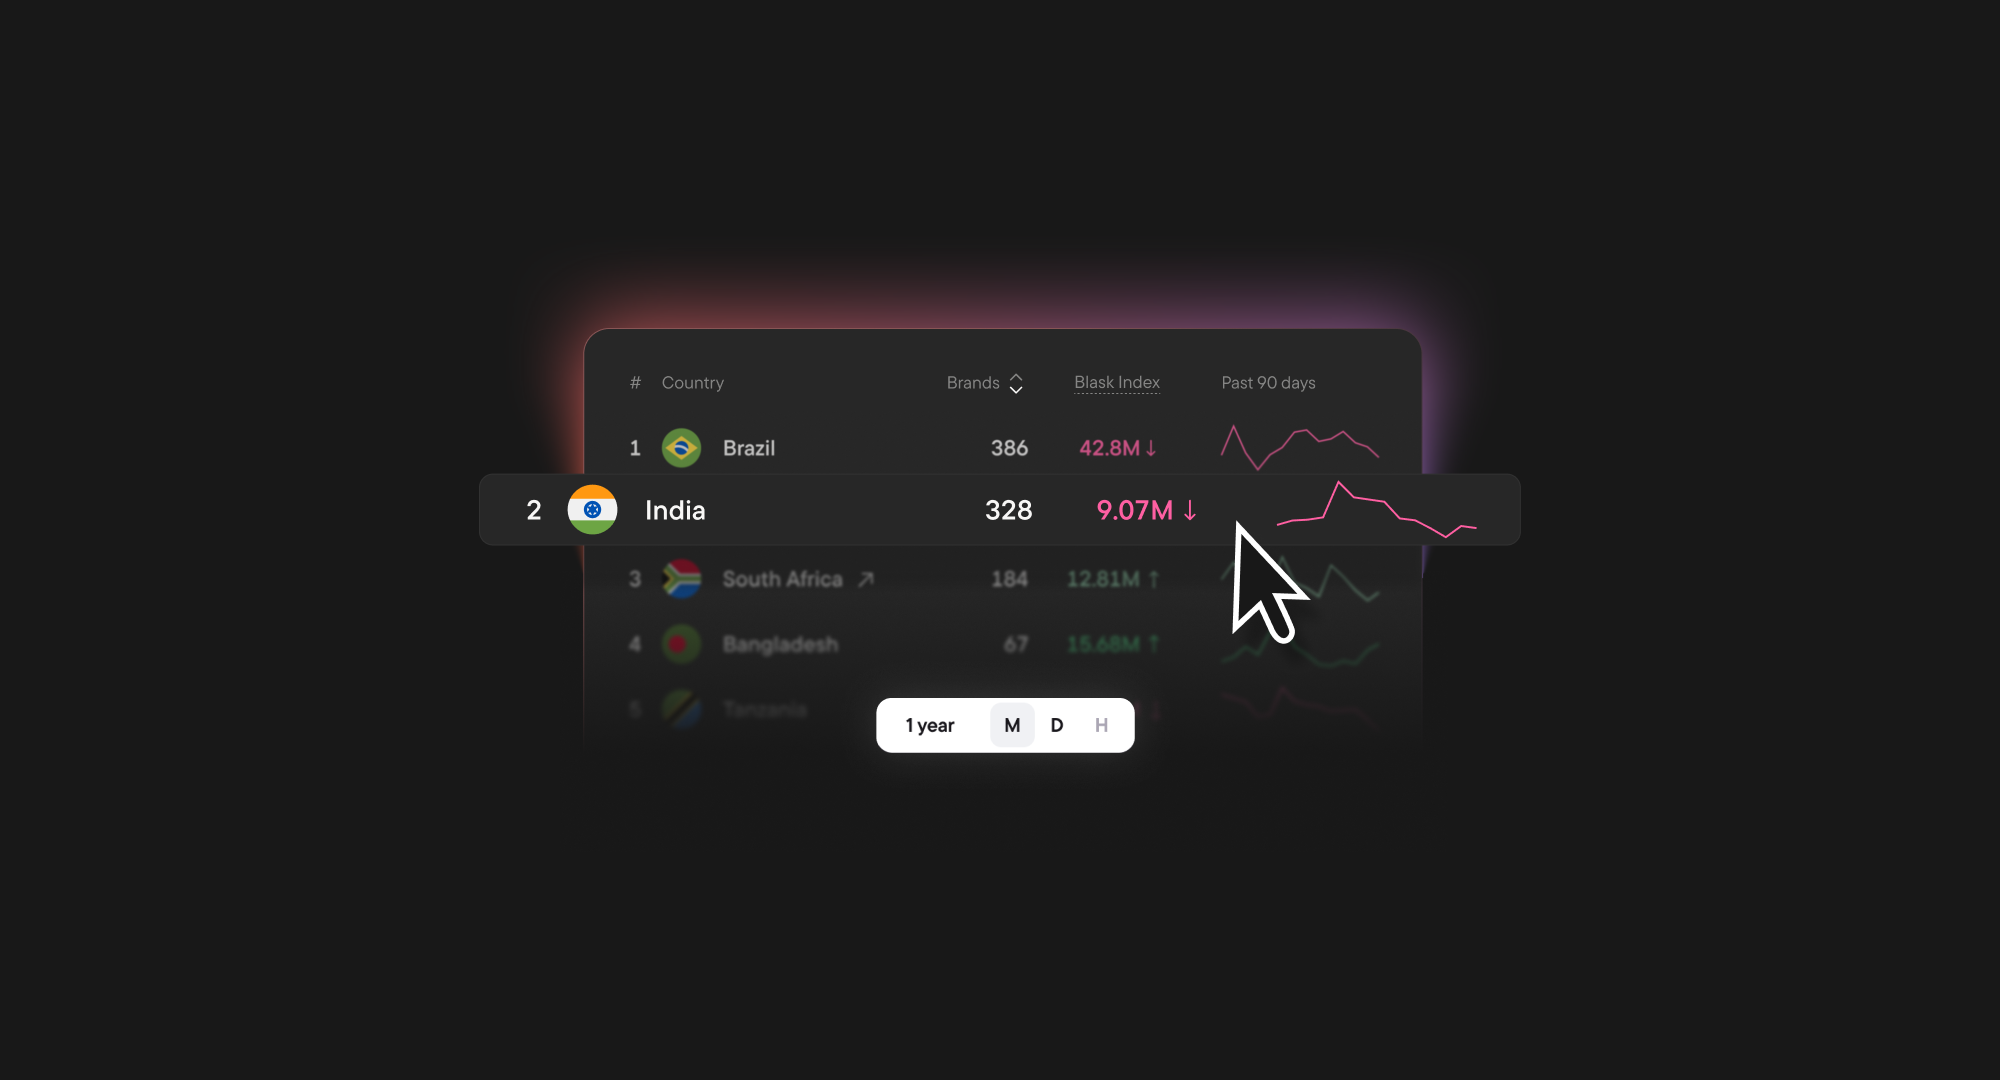
On the Countries page Blask prints a live count of Brands operating in each jurisdiction.
That figure is built in four AI-driven steps:
- Keyword harvest. Hundreds of phrases such as “online casino,” “sports betting,” and their local-language variants are fired at Google for the selected country.
- AI triage. A computer-vision logo detector flags slot tiles, odds tables and live-dealer frames, while an LLM text-classifier screens out affiliate blogs and news articles.
- Human checkpoint. Borderline domains go to a human reviewer; only verified operators survive, giving ≈ 95% precision.
- Auto-sync. Approved names flow into the All-Brands table and instantly bump the Brands counter in the Countries list.
📚 Read more: How does Blask search for new iGaming brands?
How to use the Brands column
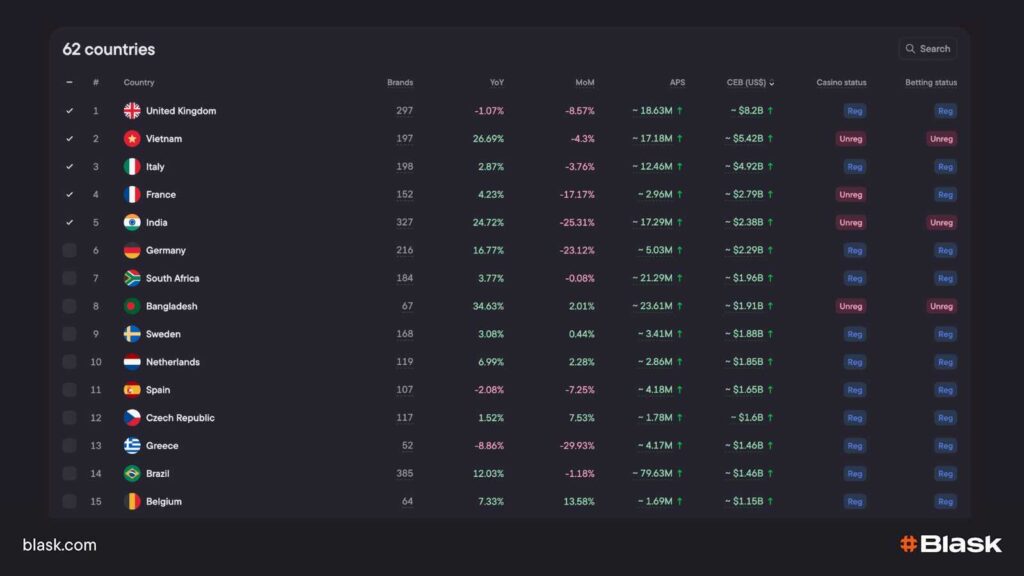
- Sort descending to reveal the densest markets first (e.g., Brazil with 385 operators) — a quick litmus test for marketing spend and CAC pressure.
- Sort ascending to expose thin markets with the minimum active brands; these often mean lower CPMs and cheaper SEO wins.
Drill down into any country — and know when the odds are stacked against you
Click a market in Countries and Blask opens a Brands table that exposes each operator’s real standing: platform mix, vertical focus, hourly Blask Index, monthly APS / CEB, and BAP, the share-of-attention metric built from search, visibility and competitive crowding.
📚 Read more: BAP is All You Need
Why the Brands table matters
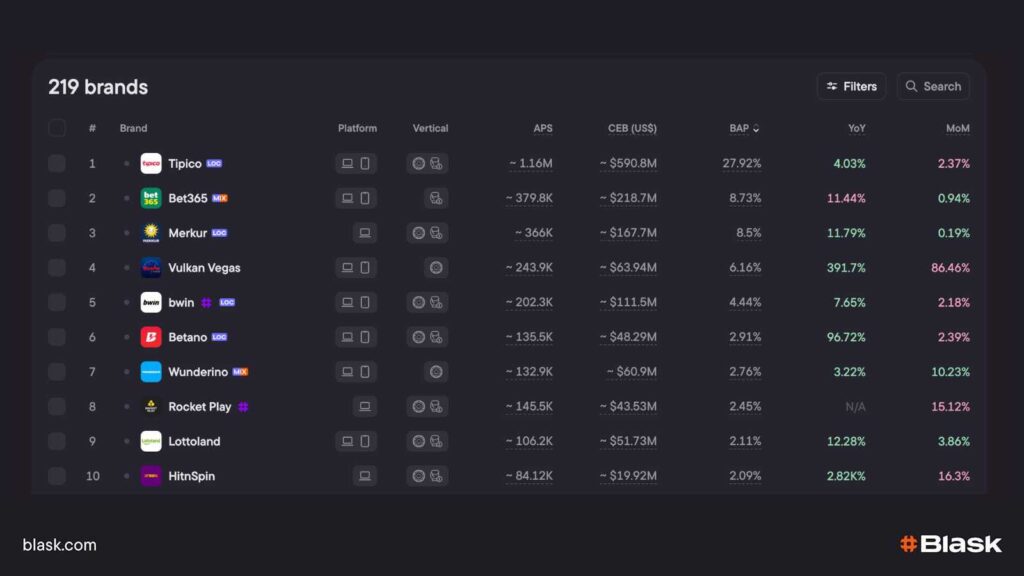
- Size of the field. Germany lists 219 active brands; Guinea shows only 13. Sorting the Brands column high-to-low tells you at a glance whether you’re entering a prize fight or a sparring session.
- Dominance alerts. In Germany, market leader Tipico commands ≈28% BAP — three times the next competitor.
- Fragmented goldmines. Italy is the opposite story: 198 brands and only 14 of them clear 1% BAP. The top four share the market within fractions of a percent, reshuffling almost monthly. Here, nimble campaigns and constant optimisation beat sheer budget because no one keeps the throne for long.
- Real-time trajectory. The Blask Index column ticks every hour, so you can watch every operator’s line dip the very day a local operator launches a TV blitz — or spike when a new game trends on Twitch.
Strategic takeaways
- Avoid single-leader markets unless your budget matches the giant’s; CAC inflation is brutal when one brand sits above 25% BAP.
- Target hyper-fragmented arenas, where even a 0.5 pt BAP gain can leapfrog five competitors overnight.
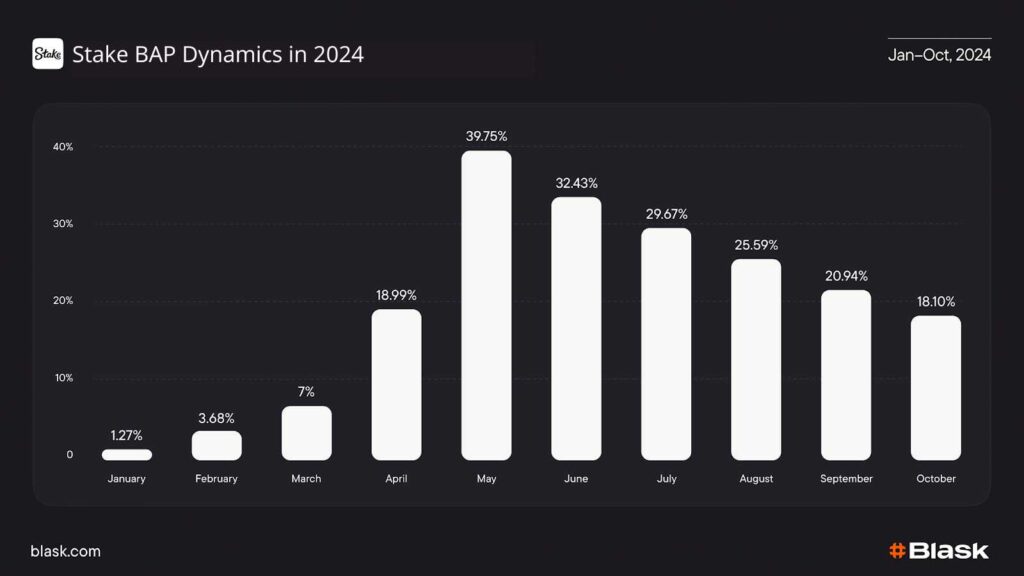
- Exploit event windows. Stake vaulted to #1 in India during IPL 2024 by syncing influencer payouts with every six hit—driving its BAP from 1.3 % in January to almost 40 % by the final over.
In short: the Brands table tells you not just who is in the ring, but whether the fight is worth entering—and which round to throw your heaviest punch.
📚 Read more: Share-of-Search: a new metric for understanding market volume
Convert attention into players and dollars with APS & CEB.
Acquisition Power Score (APS) drops on the 10-th of every month and tells you how many first-time depositors last month’s awareness should have produced. The model blends your 30-day Blask Index curve with social buzz, app-store rank and affiliate click-outs, then shows a three-band range: worse · average · better.
Competitive Earning Baseline (CEB) projects next-month gross gaming revenue. It takes your APS and BAP, then layers in macro signals—GDP growth, tax moves, new licensing rules—plus the yield peers get from the same demand. The result is a USD corridor that marks red (under-monetising), mid (on par) and green (out-performing) zones.
📚 Read more: A new era of brand performance: APS & CEB
Why benchmark against brands with similar BAP
Brands clustered around your BAP are fishing in the same pond: they enjoy comparable mind-share and visibility. When a neighbour sitting on 7% BAP converts 1.6M APS and you convert 900K, you have a live, quantified gap in funnel efficiency. If the same rival’s CEB band points to $500M while yours tops at $320M, you also know they extract more revenue from players you both attract.
✨ Line up brands that share your BAP, then let APS show who turns that shared attention into players and CEB show who turns it into dollars—before next month’s revenue report can hide the truth.
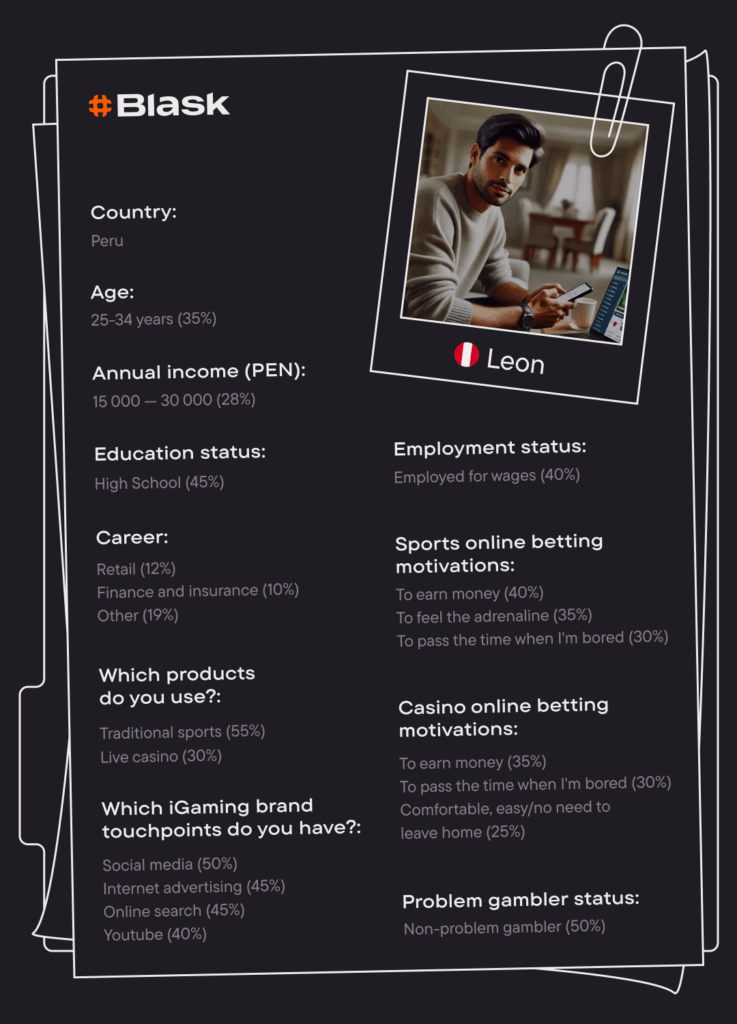
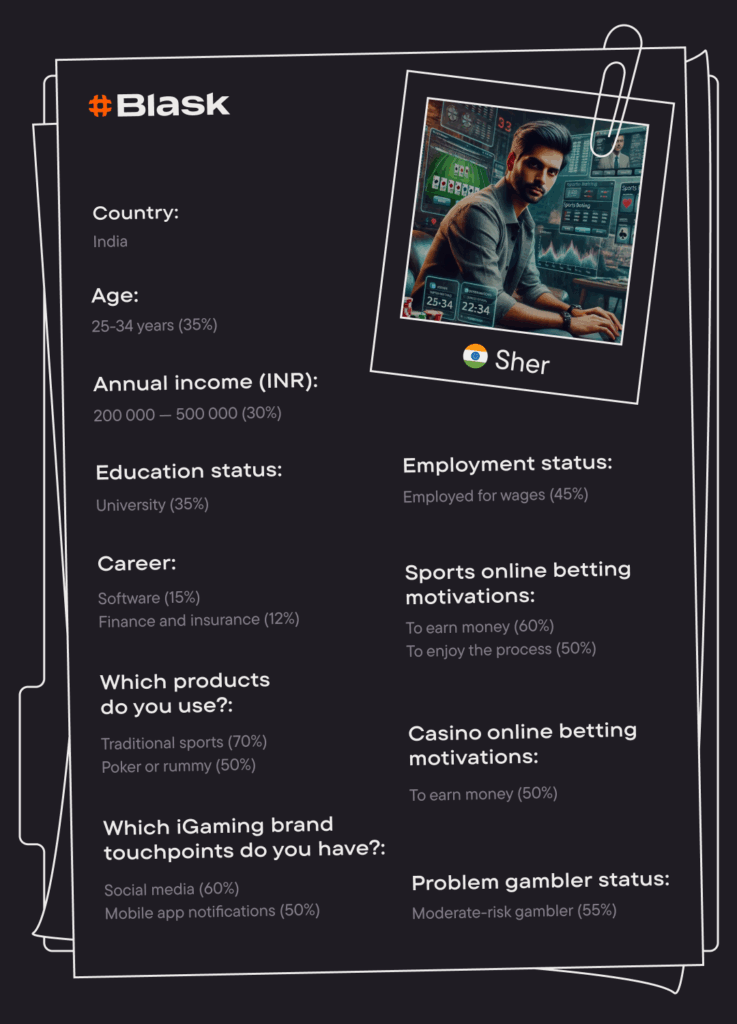
Understand the player behind every click with Customer Profile.
In a saturated iGaming battlefield, raw traffic is no longer enough — you need to know who that traffic is, why it plays, and how its habits change from one country to the next.
Blask Customer Profile delivers that clarity using an AI model trained on 80 000+ surveys, regulatory filings, open-web behaviour and proprietary Blask data.
From that blend it publishes nine fields for every market: age, annual income, education, employment/career, preferred products, sports-betting motivation, casino-betting motivation, first brand-touchpoint and problem-gambling status.
📖 Read more: How Blask AI powers Customer Profile
Key use-cases operators rely on
- Targeted campaigns that waste zero bonus spend – filter for “18-24, sports-first, high-income”
- Product-road-map proof – if 55 % of the market’s 35-44 cohort lists strategy as a casino driver and 48% already play poker, queue up a skill-based crash title instead of another fruit slot.
- Responsible-gaming triage – overlay problem-gambling status and throttle bonuses for “high-risk, thrill-seeker” segments before losses spiral; regulators in Denmark and Ontario now reward such proactive segmentation.
- Market-entry due diligence – before filing for a licence, preview the local age-income mix and top discovery channels; if YouTube and Telegram dominate touch-points, shift launch spend there and skip linear TV.
- Cross-sell & upsell mapping – see that casino dominates time-on-site but 37 % of that same cohort lists sports betting as a secondary interest; bundle free spins with risk-free bets to lift ARPU without adding new player cost.
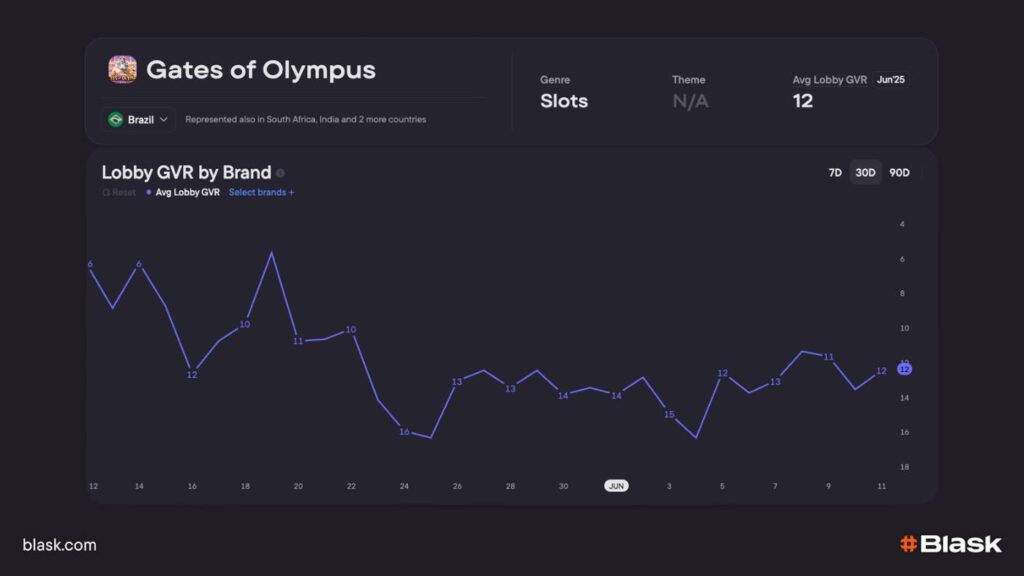
Audit the most interesting games
Every night Blask’s crawler renders each operator lobby, snaps a full-length screenshot and runs a computer-vision model that recognises 10 000-plus game logos in milliseconds.
It numbers the first 100 tiles left-to-right, top-to-bottom and outputs a single metric — Game Visibility Rank — that tells you whether a title sat front-row or page-three when 95% of clicks occur.
✨ Tie GVR to Customer Profile for maximum uplift
Knowing a segment’s favourite genres is useless if those games are buried at seat 42. Use Customer Profile to identify “sports-first, thrill-seeker” cohorts, check which crash or high-volatility slots trend highest in Blask Index, then pin those titles into hero rows and watch GVR fall (lower = better). Operators that align lobby rank with segment demand have lifted coin-in by 8-12 % in field tests.
Use the Blask Index to fine-tune campaigns in real time.
Ride the predictable spikes
- India. Every IPL season still out-pulls any other sport: Blask Index lifted from 437K in 2019 to 3M on 28 Apr 2024, with the biggest jumps not at the opener or final but on mid-table double-headers when four marquee teams share the day.
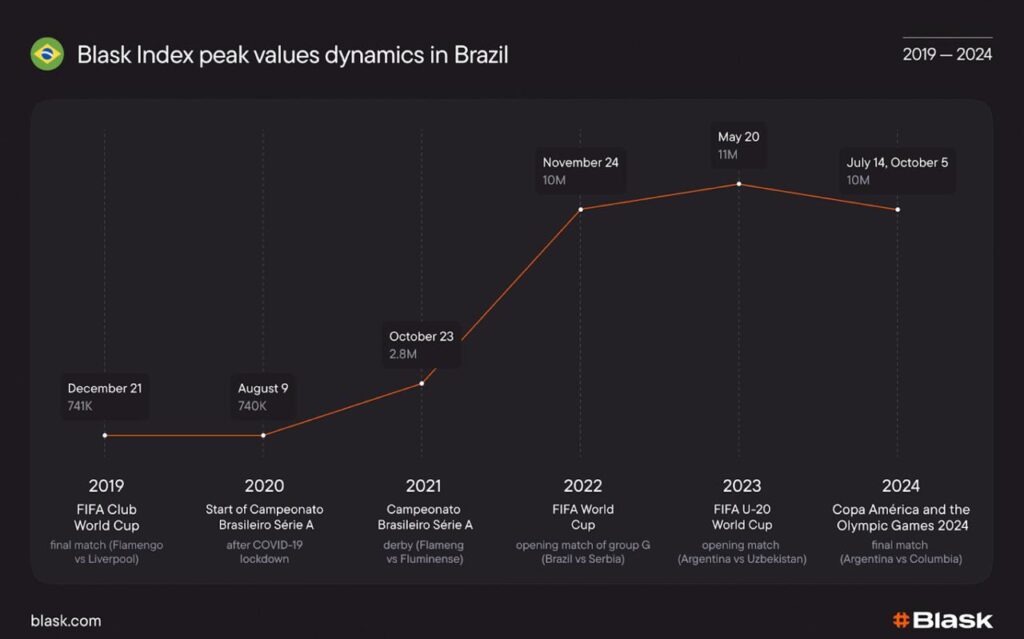
- Brazil. Football rules, but the magnet changes: Club World Cup final 2019 (741 K), delayed Brasileirão restart 2020 (740K), Flamengo-Flu derby 2021 (2.8M), first World-Cup match 2022 (10 M), U-20 World Cup opener 2023 (11M) and the Copa América final + Paris Olympics double-peak 2024 (10M).
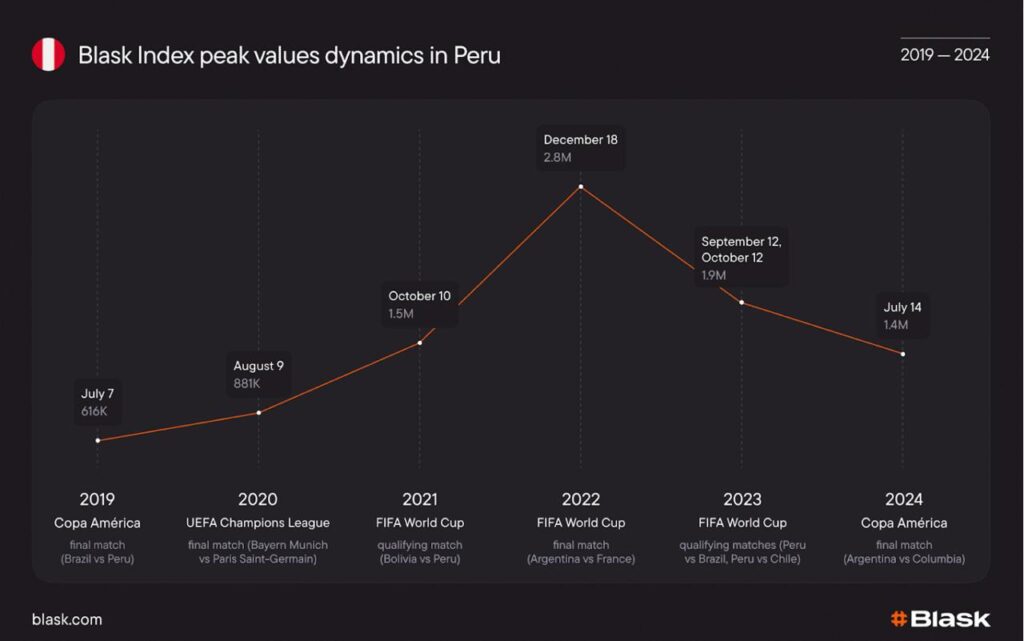
- Peru. National-team moments move the needle: Copa América final 2019 (616K), Bolivia WC-qualifier 2021 (1.5M), Argentina–France WC final 2022 (2.8M) and Copa América final 2024 (1.4 M).
Exploit the Index’s hourly granularity
The Blask Index refreshes every 60 minutes, rendering a heat-map that highlights the exact hour cohorts wake up, scroll socials or tune into pre-match shows. Use it to:
- Time influencer posts. Trigger football TikTok creators when the Index turns up instead of posting at fixed noon slots.
- Stage bonus rollouts. Release free-spin or odds-boost codes in the 15-minute block where yesterday’s Index peak occurred; watch BAP rise in the next refresh.
- Throttle spend. When the curve falls back to baseline after a match, pause CPA bidding to avoid paying Saturday-night CPMs for sleepy traffic.
With hourly visibility you stop guessing and start syncing every banner, push and influencer drop to the very moment your audience is most primed to click.
Conclusion.
Blask turns benchmarking from quarterly guesswork into an always-on dashboard: you see every new entrant, watch demand spike or sag by the hour, and measure exactly how many players and dollars you or your BAP-level rivals should be capturing.
Layer Customer Profile on top and each click resolves into a living persona, while GVR proves if the games those personas crave are actually front-row.
The result is faster, clearer decisions — before the next spin lands and long before the P&L tells the same story in arrears.