
- Updated:
- Published:
Brand’s Accumulated Power (BAP)
BAP in iGaming answers one question: out of all the demand players show for iGaming brands in a country, how much goes to this brand? Blask reports the answer as a percentage. A brand with a 12% BAP holds 12% of its market’s tracked demand. It does not hold 12% of the market’s revenue.
That distinction shapes everything below. This page covers the formula, how to read it, how BAP differs from revenue market share, Blask Index and share of search, and how to use it for competitive benchmarking. A UK case, William Hill against Bet365, shows what a falling BAP looks like in real data and what it cannot tell you.
What is brand’s accumulated power (BAP)?
Brand’s accumulated power is Blask’s measure of a brand’s share of total market demand in a given country and period. It is built on the Blask Index, which counts demand for iGaming brands from normalized search data. BAP converts that absolute count into a share, so what is BAP in practice? A brand’s slice of the market’s attention.
What does BAP measure?
BAP measures attention before it turns into money. A player who searches for a brand is choosing between options, and Blask counts those choices across every tracked brand in the country. The result is a position inside a market: Bet365 holds this share of UK demand, William Hill holds that one. BAP is not a count of players, deposits or revenue, and it says nothing about what happens after the search.
Why relative brand demand matters
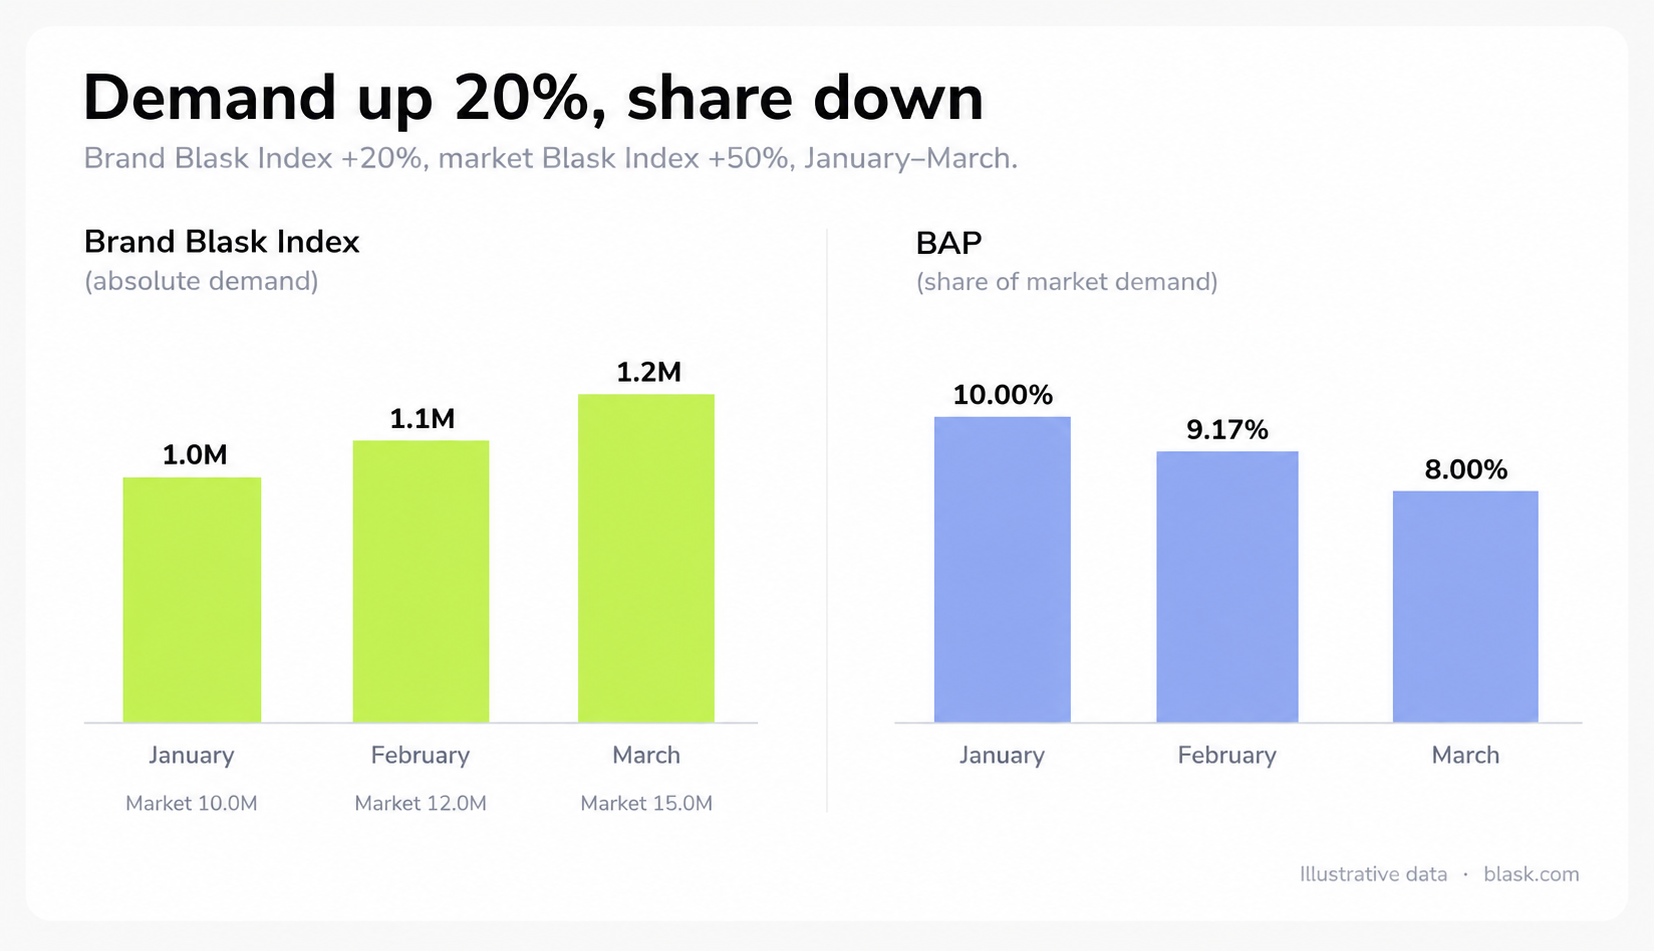
Absolute numbers mislead when the market moves. A brand adds 10% to its demand in a month when the whole market adds 25%, and it has lost ground even though its own numbers rose. Brand demand only tells you where you stand when you set it against everyone else’s. Max Tesla, CEO and co-founder of Blask, put the underlying problem plainly:
“Market share is no longer the sole measure of success.”
Max Tesla CEO and co-founder Blask
BAP is the demand-side counterpart. It shows relative position while players are still choosing, before revenue reports arrive.
How is BAP calculated?
BAP formula
The BAP formula is a ratio:
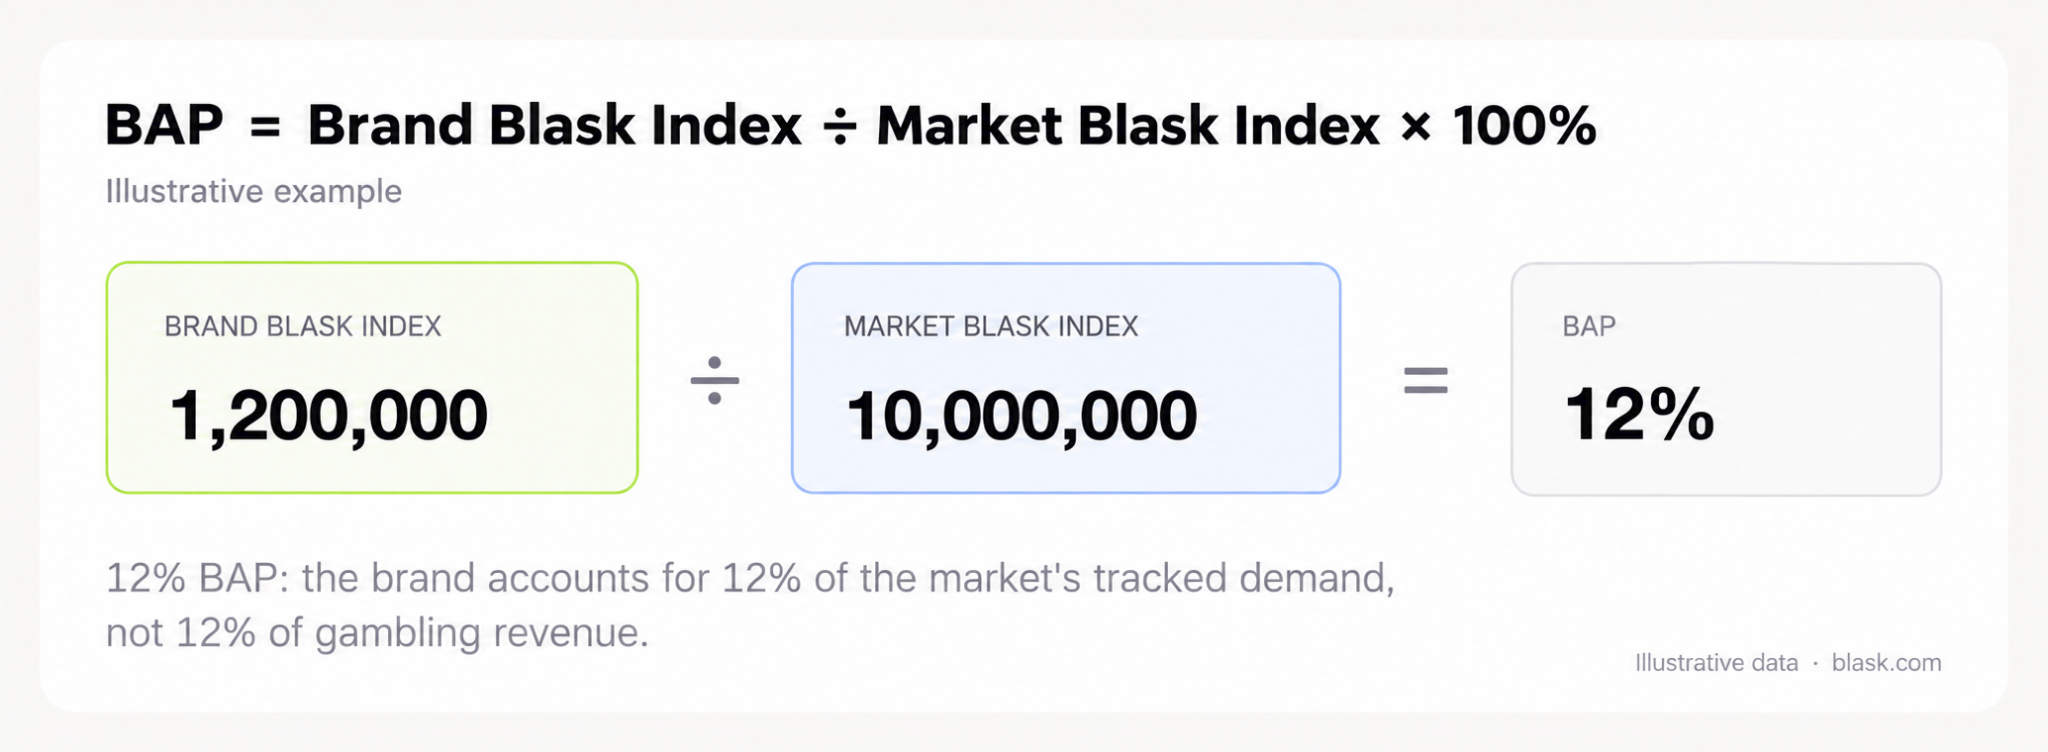
💡 Formula: BAP = Brand Blask Index ÷ Market Blask Index × 100%
The market figure is the sum of the Blask Index across all tracked brands in that country and period, so the BAP values of all brands in a market add up to 100%. The set of tracked brands grows over time. In the UK data used later on this page, the market total covers 294 brands in January 2024 and 444 in September 2026.
Step-by-step BAP calculation example
How to calculate BAP takes three steps. Take a market where tracked brands generated 10,000,000 Blask Index points in a month, and one brand generated 1,200,000 of them.
| Step | Action | Example |
|---|---|---|
| 1 | Take the brand’s Blask Index for the period | 1,200,000 |
| 2 | Take the market’s Blask Index for the same period | 10,000,000 |
| 3 | Divide and multiply by 100% | 1,200,000 ÷ 10,000,000 × 100% = 12% |
Both numbers must come from the same country and the same period. A monthly brand figure divided by a daily market figure produces a number that means nothing.
How to interpret a BAP percentage
A BAP percentage reads as a slice of demand: 12% means 12 of every 100 units of tracked demand go to this brand. Context decides whether that is high. In a market with 400 tracked brands, 12% is a large slice. In a market where three brands dominate, it may be third place.
Read BAP next to competitors and across periods. Report changes in percentage points. A move from 12% to 9% is a loss of 3 percentage points, or 25% in relative terms.
How does Blask measure brand demand?
Blask Index as the foundation of BAP
BAP has no data of its own. It divides two Blask Index values, so every strength and limit of the index carries over. The index follows the share of search approach of Les Binet and James Hankins and processes geo-tagged search queries from sources such as Google Keyword Planner and Google Trends. How Blask measures market intelligence describes the full methodology.
Search intent, normalization and brand identification
Raw search counts distort demand, so Blask cleans them before any share is calculated. Sentiment filtering keeps queries like “brand betting” and drops “brand scam” or “brand payout problems”. Variation unification merges spellings, so “merrybet” and “merry bet” count as one brand.
Multi-pass normalization re-collects the same periods to catch retroactive revisions by Google, and seasonal adjustment accounts for recurring swings. These steps happen at the Blask Index level. BAP only divides the cleaned values.
Reporting periods and data granularity
The Blask platform shows brand data at hourly, daily and monthly granularity. Max Tesla wrote that, “much like a ‘brand ECG,’ BAP can be updated at regular intervals (monthly or even more frequently)”.
The period changes the number. A daily BAP and a monthly BAP for the same brand can differ in level and sometimes in direction, because the sum of daily shares is not the share of the monthly total. Pick one granularity per analysis. Recent periods can also change slightly as Blask re-collects data, and the current month is flagged as partial until it closes.
BAP vs other brand performance metrics
Most brand strength metrics rely on surveys or on completed sales. BAP relies on search behavior. The table shows how it differs from the brand performance metrics it is most often confused with.
| Metric | What it measures | Unit | What it does not show |
|---|---|---|---|
| BAP | Brand’s share of measured market demand | % | Revenue, players, deposits |
| Blask Index | Absolute demand volume | Index points | Relative position |
| Revenue market share | Brand’s share of market GGR or NGR | % | Demand that has not converted yet |
| Share of search | Brand’s share of searches in a category | % | Revenue; values differ by provider and filters |
| Brand awareness | Recognition in surveys | % of respondents | What people actually do |
| Website traffic | Visits to a brand’s own site | Visits | Competitors’ demand |
BAP vs Blask Index
The Blask Index is the numerator of BAP. It counts demand in absolute terms and answers “how much?”. BAP answers “how much compared to everyone else?”.
Use the index for operational questions about volume and BAP for strategic questions about position. The two can move in opposite directions, as a later section shows.
BAP vs revenue market share
Revenue market share divides a brand’s GGR or NGR by the market’s. BAP divides demand. A brand that retains players well earns more per unit of demand, so its revenue share can sit above its BAP.
Regulators also report completed transactions with a delay, while BAP tracks demand as it forms. Both are valid and answer different questions. Measuring iGaming brand market share covers the revenue side.
BAP vs share of search
BAP applies the share of search method to the Blask Index. Classic share of search divides searches for a brand by searches for all brands in a category. BAP does the same on a cleaned, normalized series for the iGaming brands of one country.
The two share logic but not necessarily numbers, because providers use different keyword sets, filters and time windows. Share of search as a metric for market volume explains the method in detail.
BAP vs brand awareness
Awareness comes from surveys and asks whether people recognize a brand. BAP records what people search for. A brand can be widely known and rarely searched, or the reverse after a promotion or a major sporting event.
BAP vs website traffic
Traffic counts visits to a brand’s own site, including direct visits by existing users. BAP counts search demand for the brand name relative to every competitor, and a brand’s own analytics never show competitors’ demand.
How to interpret changes in BAP
When BAP increases
BAP rises when a brand’s demand grows faster than the market’s, or when the market’s demand falls faster than the brand’s. Check the Blask Index to tell the two apart. In June 2025 Bet365’s UK BAP was 10.13%.
In July it was 14.64%, as its Blask Index rose 54% (from 4.75M to 7.33M) while the UK market rose 6.6%. The data shows the shift, not its cause.
When BAP declines
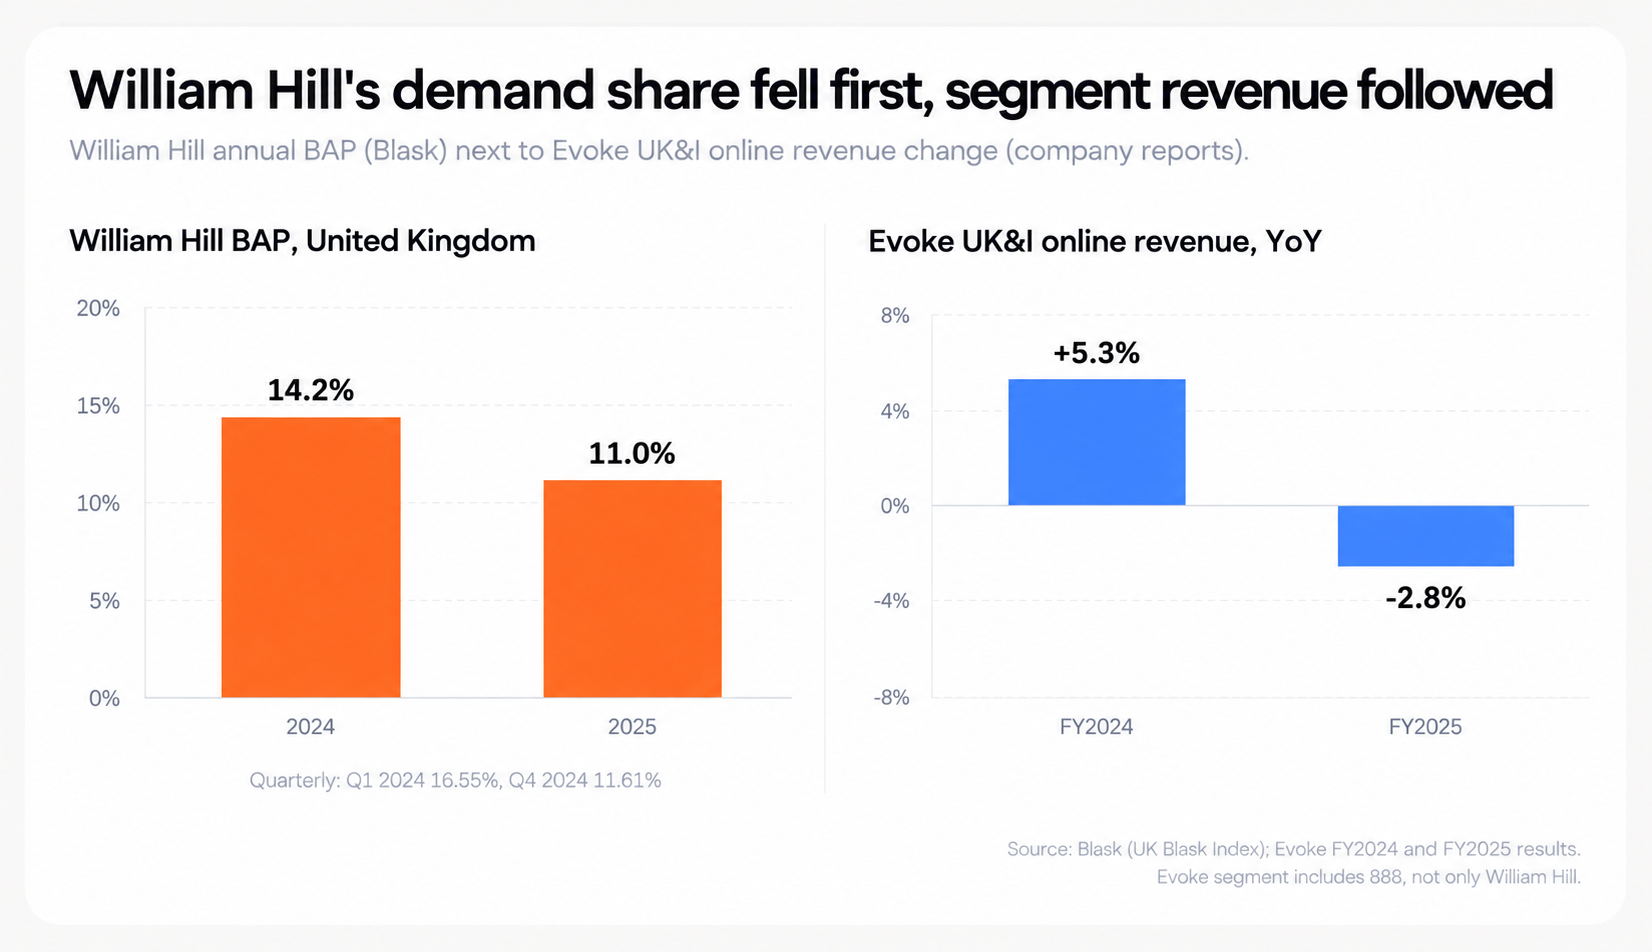
A declining BAP has three possible sources: the brand’s demand fell, the market’s demand rose faster, or both. William Hill in 2025 is a case of both. Its Blask Index fell 12.6% while the UK market’s rose 12.7%, so its annual BAP dropped from 14.21% to 11.02%.
When BAP stays stable
A stable BAP means a brand’s demand moves in step with the market. It is not the same as standing still. If the market doubles and BAP holds, the brand’s demand doubled too. Read the Blask Index before treating stability as inactivity.
Why BAP and Blask Index can move in different directions
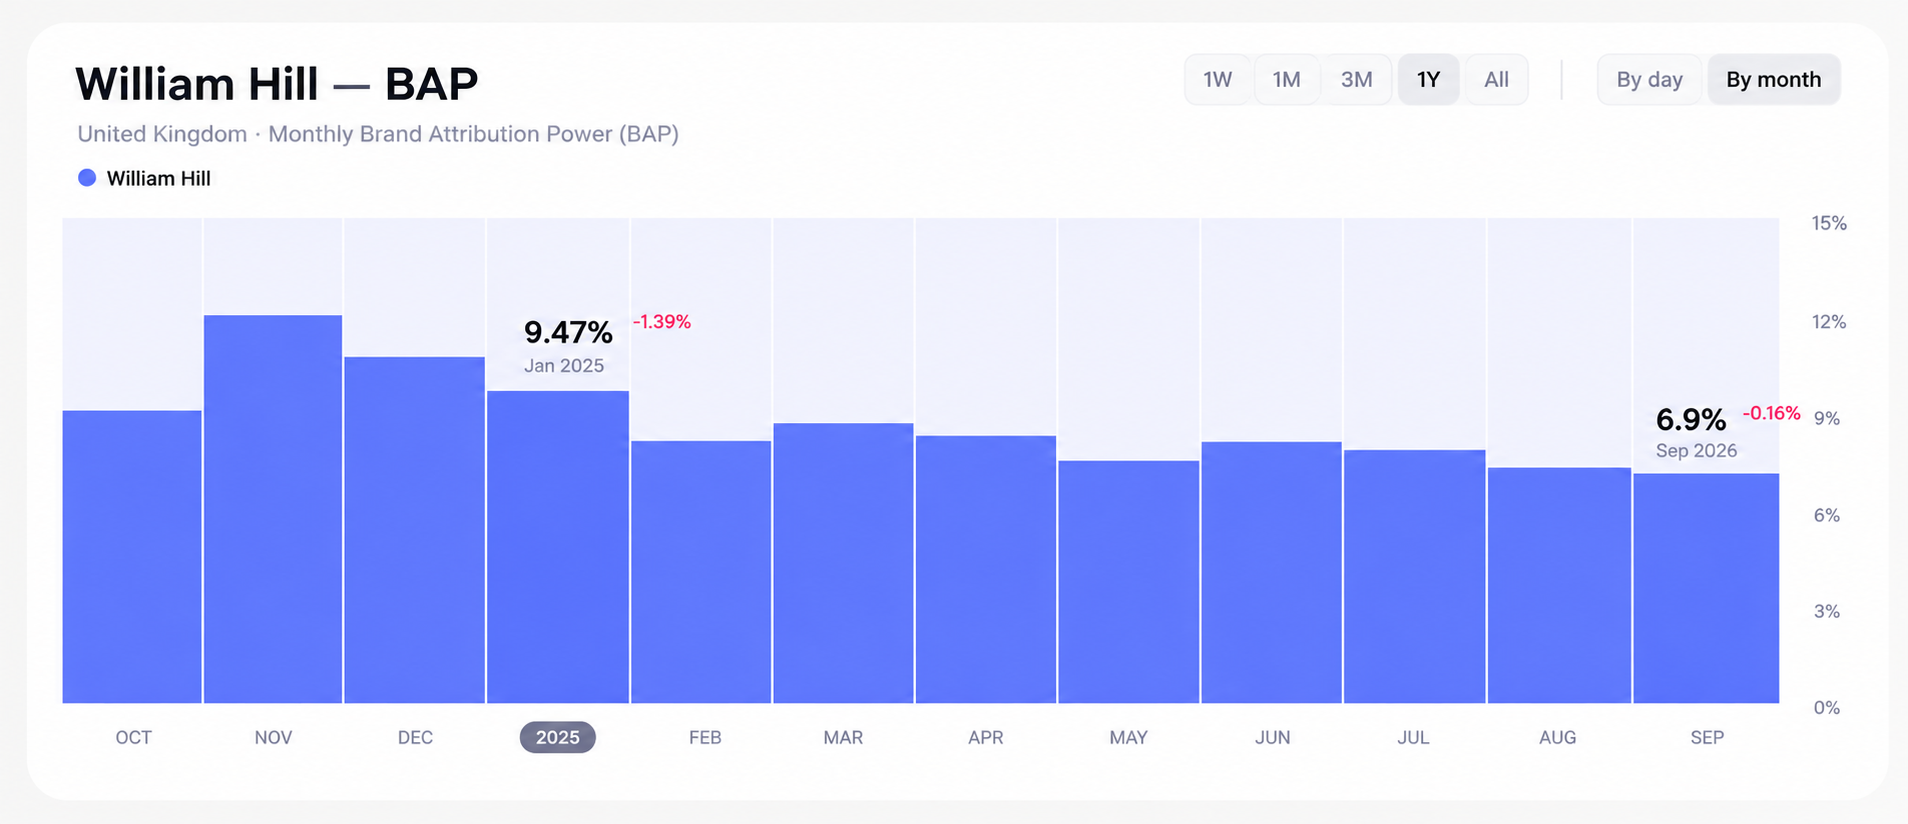
BAP is a ratio, so the denominator moves it as much as the numerator. In August 2025 William Hill’s UK Blask Index rose 4.6%, from 5.29M to 5.53M. The market rose 10.8% in the same month, and its BAP fell from 10.57% to 9.98%, a loss of 0.59 percentage points. Bet365 shows the same effect over a year: its index grew 15.2% in 2025, yet its annual BAP rose only 0.28 percentage points, from 12.37% to 12.65%, because the UK market grew 12.7%.
How to analyze BAP against competitors
Comparing brands within the same market
Competitive benchmarking with BAP starts with a fair peer set. Choose three to five brands of similar size or audience, in the same country, for the same period and granularity. Then compare the gap in percentage points and check whether it widens or narrows over time. A gap that closes slowly says more than one that jumps in a single month.
Tracking BAP trends over time
Single months move with sports calendars, promotions and regulatory news. Quarterly values smooth that noise, and a comparison with the same month of the previous year removes seasonality. The William Hill case below uses quarters for this reason.
Identifying emerging competitors
Sort a market by BAP change in percentage points over six to twelve months, not by percentage growth. A brand that moves from 0.05% to 0.5% grew tenfold and still holds half a percent of demand. Check when Blask started tracking the brand too: a recently added brand can show triple-digit growth from a near-zero base.
Understanding changes in market concentration
Add up the BAP of the top three or top five brands in each period. A falling total means demand is spreading to other brands. In the UK, William Hill and Bet365 together held 29.76% of demand in Q1 2024 and 19.27% in Q3 2026.
Most of that 10.49-point drop comes from William Hill. Part of the dilution also reflects a larger tracked set, 444 brands against 294.
📚 Read more: UK iGaming Market H1 2026: Brands & Trends
Real-world example: William Hill’s BAP in the United Kingdom
The data below comes from the monthly Blask Index for the United Kingdom, January 2024 to September 2026, summed by quarter. Pull date: October 23, 2026.
How William Hill’s share of demand changed
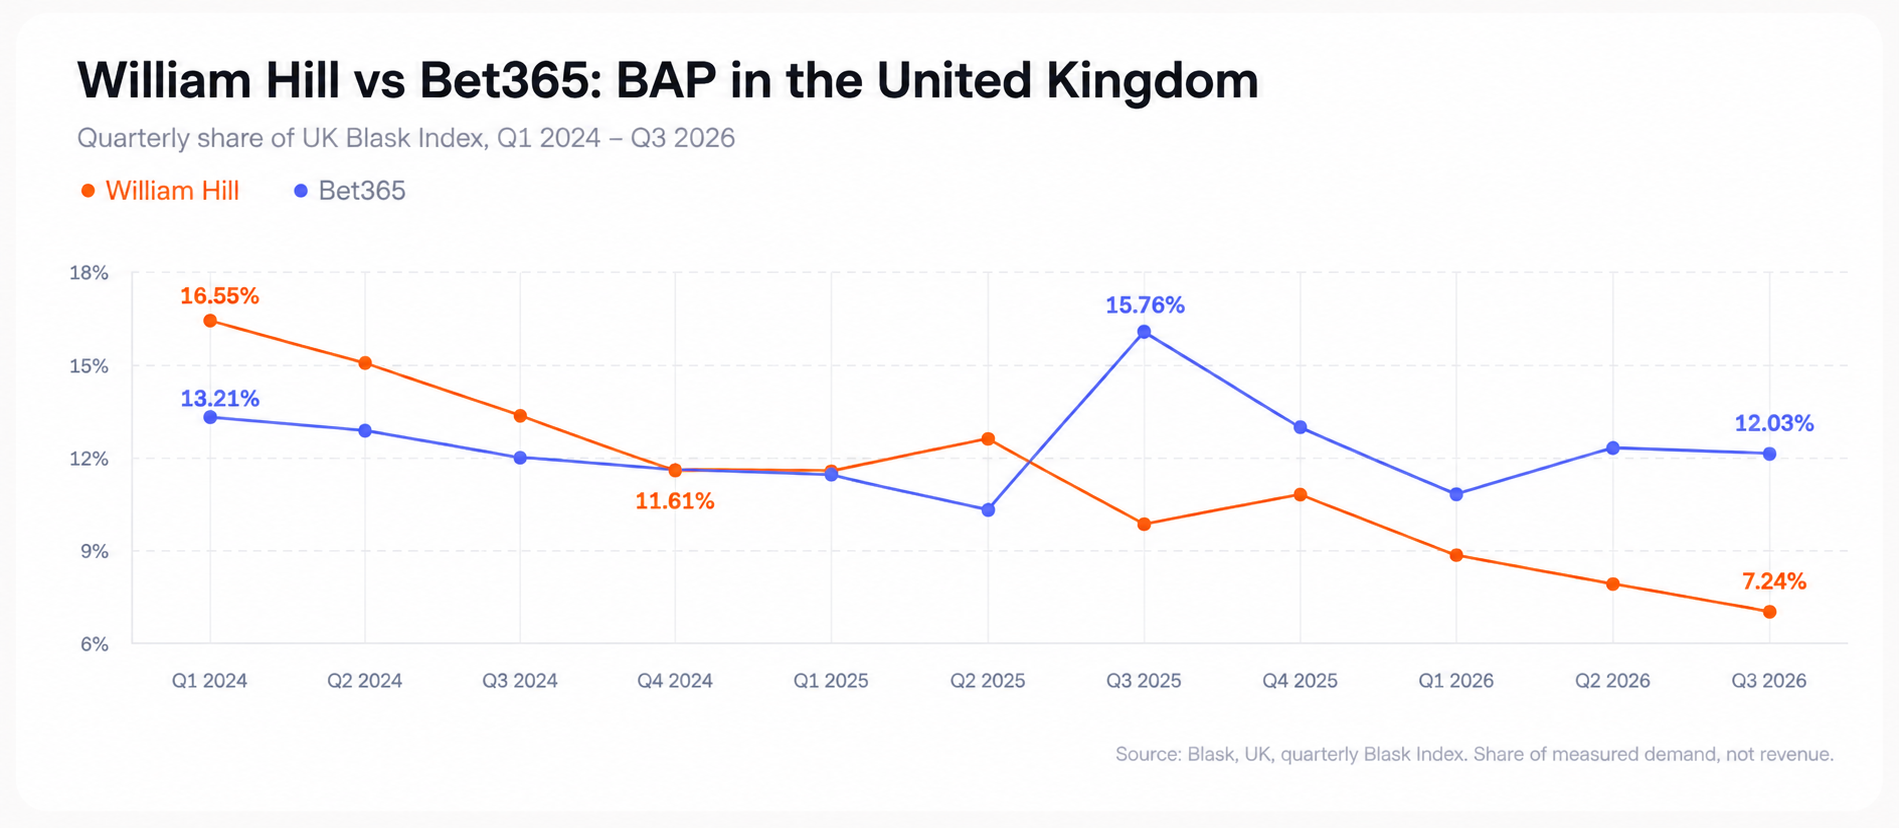
William Hill’s BAP fell from 16.55% in Q1 2024 to 11.61% in Q4 2024, a loss of 4.94 percentage points or about 30% in relative terms. By Q3 2026 it stood at 7.24%. Over the full period the brand lost 9.31 points, more than half of its starting share.
The absolute numbers confirm it was not only a market effect. William Hill’s Blask Index fell from 75.4M in 2024 to 65.9M in 2025, down 12.6%, while the UK market grew 12.7%, from 530.6M to 597.9M.
📚 Read more: William Hill Cheltenham record comes as the brand loses ground at home
Comparing William Hill and Bet365
| Quarter | William Hill BAP | Bet365 BAP | Gap, points |
|---|---|---|---|
| Q1 2024 | 16.55% | 13.21% | +3.34 |
| Q2 2024 | 15.15% | 12.79% | +2.36 |
| Q3 2024 | 13.47% | 11.96% | +1.51 |
| Q4 2024 | 11.61% | 11.51% | +0.10 |
| Q1 2025 | 11.50% | 11.31% | +0.19 |
| Q2 2025 | 12.15% | 10.49% | +1.66 |
| Q3 2025 | 9.91% | 15.76% | –5.85 |
| Q4 2025 | 10.66% | 12.70% | –2.04 |
| Q1 2026 | 8.75% | 10.80% | –2.05 |
| Q2 2026 | 7.92% | 12.20% | –4.28 |
| Q3 2026 | 7.24% | 12.03% | –4.79 |
The two brands show different patterns. William Hill’s decline was gradual and mostly continuous. Bet365 stayed between 10.49% and 13.21% for six quarters, then jumped 5.27 points in Q3 2025, from 10.49% to 15.76%, and took the lead. The jump faded to 12.03% by Q3 2026, but William Hill never regained first place.
What declining BAP does and does not tell us
William Hill’s parent, Evoke, reported that UK&I online revenue rose 5.3% to £693.2M in FY2024 and then fell 2.8% to £674.0M in FY2025. Demand share started falling in early 2024, about a year before the segment’s revenue turned down.
That sequence is a signal to investigate, not proof of cause. The Evoke segment also includes 888, and Evoke attributed part of the FY2025 sports decline to prior-year operator-friendly results and black market growth in horse racing, and a planned reduction at 888 offset the gaming growth. The same report credits William Hill with growth in gaming.
A falling BAP means a brand holds a smaller share of demand. It does not mean the brand earned less.
How BAP relates to share of search and market share
What share of search research shows
Les Binet presented share of search at IPA EffWorks in October 2020, testing it on cars, energy and mobile phones. A later IPA think tank deck from October 2021 covered 30 case studies across 12 categories and 7 countries. It reported an average correlation of 83% (Pearson 0.82) between share of search and share of market, mostly on revenue share and 12-month rolling averages. The deck also says the ratio between the two varies by category and country.
Max Tesla called share of search a powerful “early warning system” for brand performance. That is a framing, not a guarantee, and the IPA data does not turn it into one.
Why changes in demand may precede revenue changes
A player usually types a brand name before registering, so demand forms before revenue does. William Hill’s decline fits that order: the share of demand dropped through 2024 and the segment’s revenue turned down in FY2025. The lag differs by category and market, and one case does not establish a rule.
Why search share is not the same as revenue share
The IPA deck estimates that search demand explains on average 69% of market share. Other factors drive the rest. In iGaming those include player value, retention, product, payment options and channel mix.
Correlation between search demand and revenue share does not prove causation either. Treat BAP as an input to iGaming market share analysis, not as a replacement for it.
How iGaming operators can use BAP
Competitive benchmarking
Place your BAP next to three to five peers each month and track the gap in percentage points. A widening gap against one competitor is a more specific signal than a falling total. Segment the view by country, since each market has its own competitors.
Marketing performance analysis
Compare BAP before and after a campaign window, against the same weeks a year earlier. If the Blask Index rises but BAP does not, the brand only kept pace with a growing market. BAP shows how demand responded. It does not show conversion or return on spend.
Market entry and geographic expansion
Rank a target country’s brands by BAP to see how concentrated it is. A market where two brands hold 60% of demand leaves less open space than one where ten brands hold 5% each. Remember that BAP is relative: use the Blask Index to compare how large each country’s demand actually is.
Brand positioning and strategic planning
A defending brand tracks losses in percentage points, a challenger tracks gains. Either way, BAP is one input to planning and not a forecast. A rising BAP does not guarantee revenue growth, and a falling one does not guarantee decline.
How BAP connects to other Blask metrics
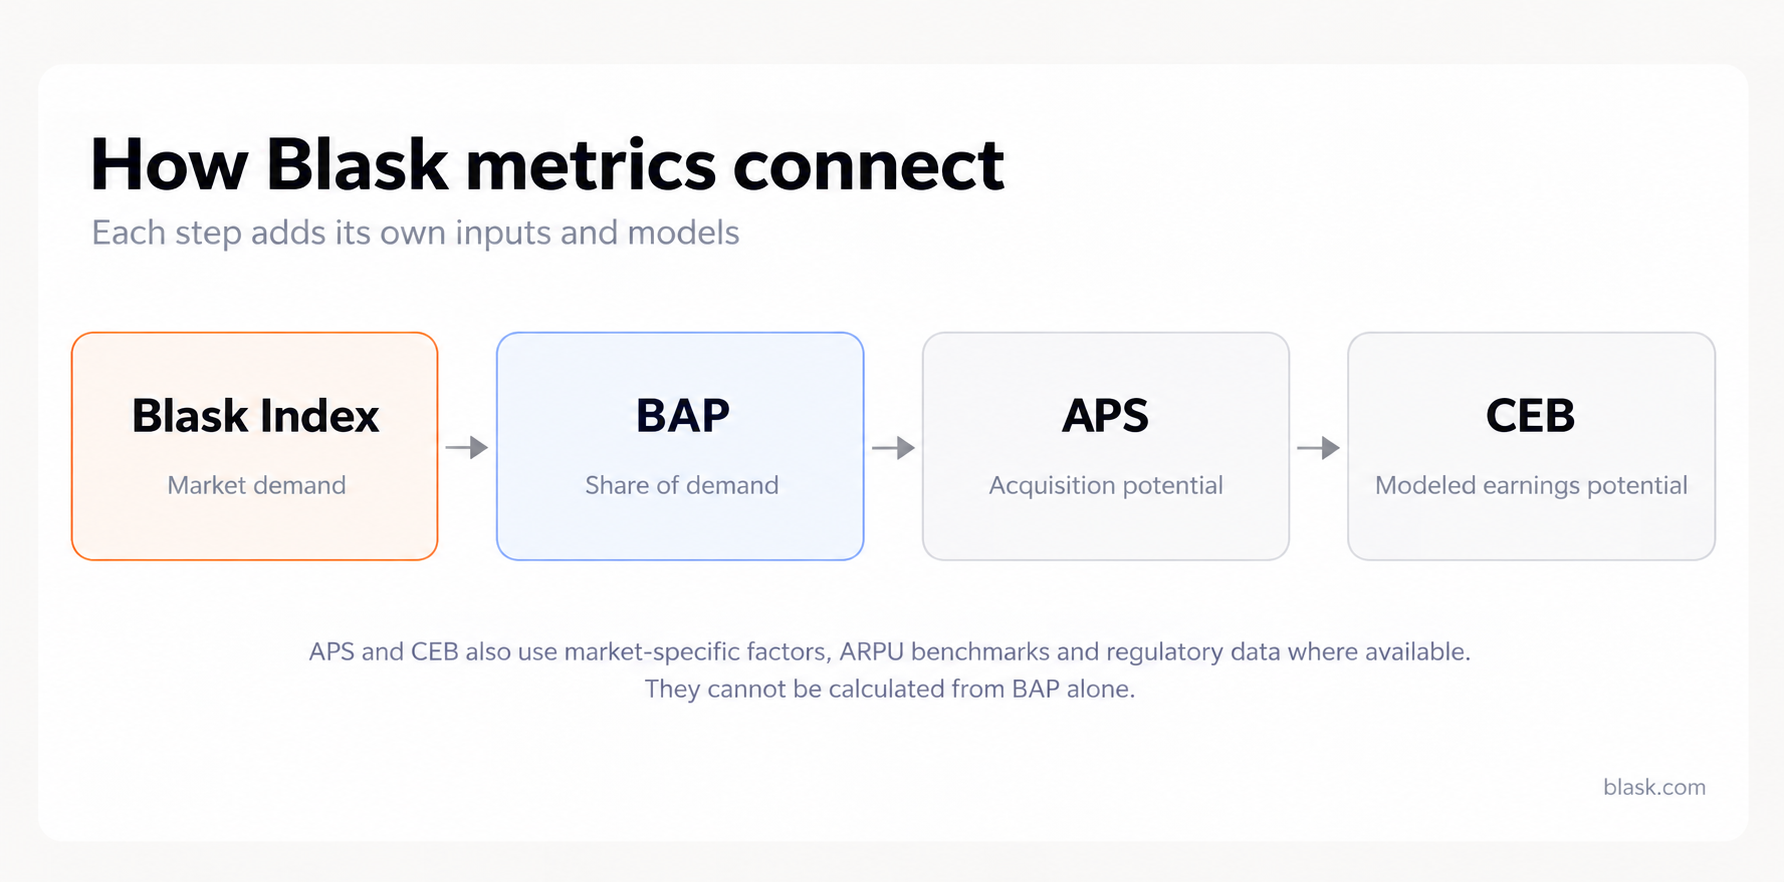
Blask metrics build on each other, but each adds its own inputs. The chain is not a formula that runs from BAP alone.
Blask Index: absolute market demand
The Blask Index is a real-time measure of market demand volume for iGaming brands in a given country, based on normalized search data. It is the base for every other metric. See the Blask Index page for details.
BAP: relative share of market demand
BAP divides a brand’s index by the market’s. It carries no extra data sources.
APS: estimated customer acquisition
Acquisition Power Score (APS) estimates how many new customers a brand should have attracted given its market presence. It starts from the Blask Index and BAP, then applies market-specific factors, because the same level of attention converts differently in different countries. APS is a min–avg–max range and not a count of actual first-time depositors.
CEB: modeled earnings potential
Competitive Earning Baseline (CEB) is a revenue baseline in USD, also a min–avg–max range. It draws on BAP, APS and competitive context, and for locally licensed brands in regulated markets it is anchored to regulator-reported GGR. CEB shows what is achievable. It does not report profit and loss.
Common mistakes when interpreting BAP
The first mistake is reading BAP as a revenue share. It measures demand, and a brand’s revenue share can sit above or below it. The second is reading a BAP decline as a demand decline. Check the Blask Index first, because the market may simply have grown faster.
Cross-country comparison is the third. A 10% BAP in a large market represents far more demand than 10% in a small one, so compare positions and concentration, not volumes. The fourth is mixing periods: daily and monthly BAP are different series, and partial months are not comparable with complete ones.
The fifth is over-reading small numbers, either the growth rate of a brand with near-zero BAP or a single-month spike. Finally, a correlation between search share and revenue share is not a forecast.
How to track BAP in Blask
Selecting a market and brand
Open the market page for a country, for example the United Kingdom market overview, and select the brand. Every BAP value is tied to that country and the reporting period you choose.
Reading the BAP chart
The chart shows the brand’s share of measured demand in the selected market as a percentage. Because it is a percentage, changes in the overall market size are already factored out. Set the granularity first, then read the level and the direction of the line.
Using compared mode
Add competitors from the same market to see their BAP on one chart. Pick peers of similar size, and read the distance between lines in percentage points.
Analyzing historical trends
Widen the date range to see whether a move is a trend or a spike. Compare the same periods in different years, and check the Blask Index alongside BAP before drawing a conclusion.
Frequently asked questions about BAP
What does BAP stand for?
BAP stands for brand’s accumulated power. It is Blask’s measure of a brand’s share of the total tracked demand in a given market and period.
How is BAP calculated?
BAP equals the brand’s Blask Index divided by the market’s Blask Index, multiplied by 100%. Both values must cover the same country and period.
What does 10% BAP mean?
It means the brand accounts for 10% of the market’s tracked demand in that country and period. It does not mean 10% of revenue, players or deposits. Whether 10% is high depends on how many brands share the market.
Is BAP the same as market share?
No. Market share usually refers to revenue, GGR or NGR. BAP refers to measured demand. The two can differ in level and in direction, because a brand’s revenue depends on player value and retention as well as demand.
What is the difference between BAP and share of search?
BAP applies the share of search method to Blask Index data for iGaming brands in one country. Share of search in general can use any keyword set and filters, so values from different providers are not directly comparable.
Can BAP increase while brand demand falls?
Yes, if the market’s demand falls faster. A brand’s index drops 10% from 1.0M to 0.9M while the market drops 20% from 10M to 8M. Its BAP rises from 10% to 11.25%.
Does higher BAP mean higher revenue?
Not necessarily. A higher BAP means a larger share of demand. Revenue also depends on conversion, retention and player value, and a rising BAP does not guarantee future revenue growth.
How often is BAP updated?
BAP follows the Blask Index, which is available at hourly, daily and monthly granularity. Recent periods can change slightly as data is re-collected, and the current month is flagged as partial until it closes.
Can BAP be compared across countries?
Only as a position inside each market. A 10% BAP in a large market represents more absolute demand than 10% in a small one. Use the Blask Index to compare demand volumes between countries.
Where can I find BAP data?
BAP is available in the Blask platform on market and brand pages. The United Kingdom market overview shows an example of brand data for one country.

“`