You can’t optimise what you don’t measure — but measuring the wrong thing is even worse.
After analysing hundreds of operators and affiliates, Blask’s data team keeps coming back to the same five KPIs. Together they span demand, visibility, acquisition, monetisation and in-lobby execution —the entire money chain.
Nail these and you’ll know where to grow, how fast to push and when to pivot.
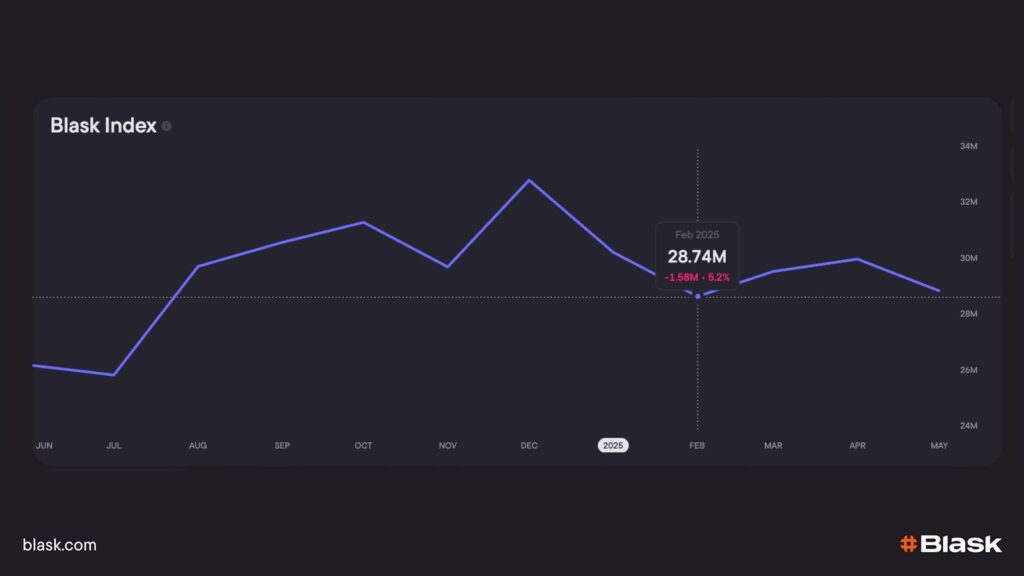
What it is Think of Blask Index as a stock-price chart for iGaming interest. Every hour Blask sweeps millions of Google queries for casino brands, games and betting terms.
The system cleans the data (merging misspellings, stripping out paid-search noise) and flattens seasonality so World-Cup spikes don’t bury smaller trends. What you get back is a single number on a 0–100 scale that moves up or down in almost real time — exactly like a share price.
Pick the next growth market Open the Countries screen, sort by month-on-month Index growth, and you instantly see which geos are heating up fastest. That’s how several affiliates spotted Bangladesh’s +34% YoY surge while the operator count was still under 40 and re-routed budget — bagging a 25% revenue jump in the very first month.
See when players are most active — hour by hour Switch the Index granularity to “hourly” for any country or brand.
Traffic teams watch the curve rise after work in Brazil or during lunch breaks in India, then time push notifications and odds boosts to those natural peaks instead of guessing.
Identify the true red-letter days The daily view highlights the exact dates that dwarf all others: IPL mid-table clashes in India, a Flamengo–Fluminense derby in Brazil, or a Peru World-Cup qualifier.
Knowing these spikes months ahead lets you preload creatives, boost server capacity and secure influencer slots while prices are still sane.
Prove a campaign — or influencer — actually moved the needle Launch a TV spot, billboard flight or sponsored stream and watch the brand’s Index in real time. A +45% lift during a cricket stream told Stake they’d booked ~250 incremental first-time depositors hours before CRM data arrived; another streamer who barely nudged the line was dropped, saving $10–30k in “hype” spend.
Reverse-engineer your competitors’ playbook Track rivals’ Index curves. A sudden climb with no corresponding news?
They probably launched a new bonus or partnered with a big name. If your own BAP is flat while their Index soars, you know it’s time to copy — or counter — the move rather than wait for market-share loss to show up in GGR.
📊 Bottom line: Blask Index is more than a vanity chart — it’s a live seismograph of player intent that lets you choose the right markets, hit audiences at the right hour, and validate every promo or partnership the moment it happens.
Brand Accumulated Power (BAP): the share-of-voice you already control
What it is BAP is Blask’s daily snapshot of how much oxygen your brand consumes in any given country. It rolls up organic search share, social chatter, direct-navigation signals, and branded app traffic into one percentage that always sums to 100% across all operators in that market. If India’s casino scene generates 10 million brand-search impressions today and your logos account for two million of them, you sit at 20% BAP.
Early-warning radar. A UK challenger saw its BAP flatten at 7% while two rivals crept toward double digits. That red flag landed weeks before GGR erosion — giving marketing time to refresh creatives and re-buy sponsorships. The following quarter BAP resumed its climb and revenue never dipped.
Proof of impact. Stake’s cricket-led promo blitz during IPL 2024 pushed its Indian BAP from 19% to 40%. When the March CEB dropped, actual GGR brushed the top edge of the green band — hard evidence that the visibility spike monetised just as the model predicted.
Competitive intelligence at a glance. Watching a rival’s slice expand faster than the category means they’ve fired a new weapon — price boosts, a superstar ambassador, regional TV. You learn the lesson without paying the tuition.
Investor story in a single line. Month-on-month BAP growth is a tidy, third-party metric that boards and VCs instantly understand: more share of mind today becomes more share of wallet tomorrow.
Blask index and BAP for India
Every-day workflows
Hover the stacked bar on any Country page. If your slice stays under 2% for three straight months, you know awareness — not funnel leakage — is the growth blocker. Buy eyeballs before you burn cash tweaking bonuses.
Filter Brands table by ±1 pp of your BAP. Any peer with similar visibility but higher CEB is converting better; study their retention hooks and VIP cadence. If their BAP is higher and CEB lower, they’re over-spending on awareness — time to out-sell them on value.
Use BAP to size sponsorship ROI. Plot a stadium-naming deal’s start date on the BAP graph; if your slice widens inside one sales cycle, the asset paid for itself—no need to wait for quarterly revenue to trickle in.
Bottom line Blask Index tells you how big the pie is; BAP shows how much you already own. Track it daily and you’ll know exactly when to crank awareness, when to double down on conversion, and when to copy—or crush—a rival’s move.
Acquisition Power Score (APS) — Did you capture enough players?
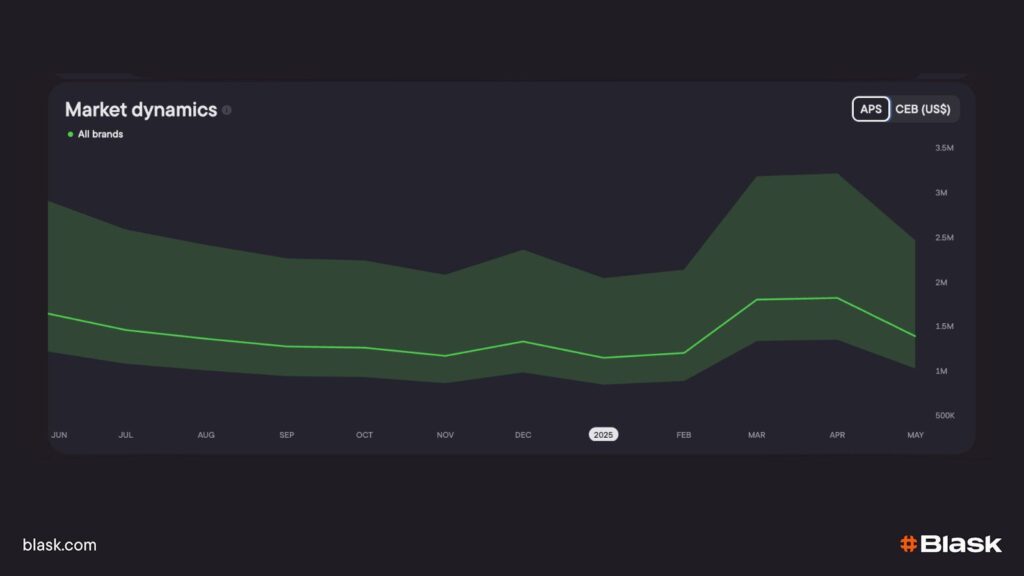
What APS actually shows Every month — on the 10th — Blask’s model looks back at the just-finished calendar month and asks: Given your brand visibility (BAP + Index), typical marketing mix, and known funnel frictions, how many first-time depositors should you have landed?
The answer appears as a single point on the Growth Values dashboard, plotted against three colour-coded guide rails:
Worse: the floor — anything below means your acquisition engine is clearly leaking.
Average: the statistically “most likely” outcome.
Better: the ceiling — hit it and you’re converting visibility into sign-ups as efficiently as the top decile of the market.
📊 Important: APS is always back-dated; it never forecasts. It grades the month that has just closed, so you know whether to fix or double-down before the next one is over.
Compare APS to your own FTDs. FTDs < Worse ⇒ widen top-of-funnel, re-price bonuses, audit KYC steps. FTDs > Better ⇒ acquisition is fine; move on to monetisation (check CEB).
Compare APS to rivals. Inside a Country page, sort the Brands table by APS delta. If a competitor with similar BAP beats your APS, their funnel converts better—time to study their creative cadence or sign-up flow.
Scan markets by national APS. On the Countries screen, switch the metric drop-down to APS. Rising national APS with still-low operator density = a growth goldmine. That’s how affiliates spotted Bangladesh (high APS, only a few dozen operators) before the rush.
APS is your monthly lie-detector for acquisition. Watch your position, interpret the three-band ruler, and you’ll know — without a spreadsheet marathon — whether last month’s marketing spend pulled its weight and where to aim your next dollar.
Competitive Earning Baseline (CEB) — did last month’s players monetise to their full potential?
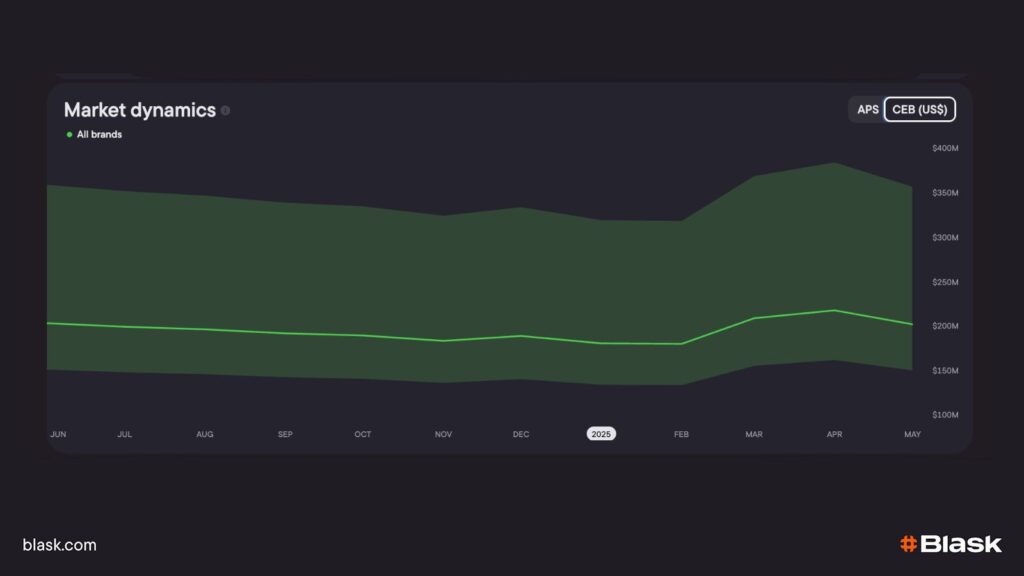
What CEB actually shows At the beginning of every month Blask publishes a green corridor that grades the GGR you should have earned from the players acquired in the previous calendar month.
Worse (bottom edge) → minimum GGR a “typical” operator would squeeze from that demand.
Average (centre stripe) → statistically most-likely outcome.
Because CEB is built from your APS, BAP, market CPMs, macro data and peer yields, it is always backward-looking: it fixes the target only once the whole month’s context is locked.
Reading the Growth Values graph
The green band is your earned-value corridor. Interpret at a glance:
Line inside green ⟶ monetisation on pace with reality.
Line below Worse ⟶ money left on table.
Line kissing / above Better ⟶ you monetised demand as well as (or better than) the top 10% of the market.
GGR > Better ⇒ document what worked and replicate across markets.
CEB in India
Benchmark against competitors Sort the Brands table by CEB gap. If a rival with similar APS+BAP sits higher in its corridor, their VIP cadence or ARPU titles beat yours—time to dissect their offer.
Allocate budgets by country In the Countries view switch metric to CEB. Markets whose aggregated GGR sits below green get extra promo spend; over-performers focus on margin optimisation.
Pair with APS for a full-funnel verdict
APS hit, CEB miss → players arrived but didn’t monetise: improve cross-sell, loyalty, payout speed.
APS miss, CEB green → monetisation healthy but not enough players: boost awareness or UA.
📊 Bottom line: APS grades how many players arrived; CEB judges what they should have spent. Read the band once a month and you’ll know — immediately — where revenue is leaking, where it’s peaking, and exactly which lever to pull next.
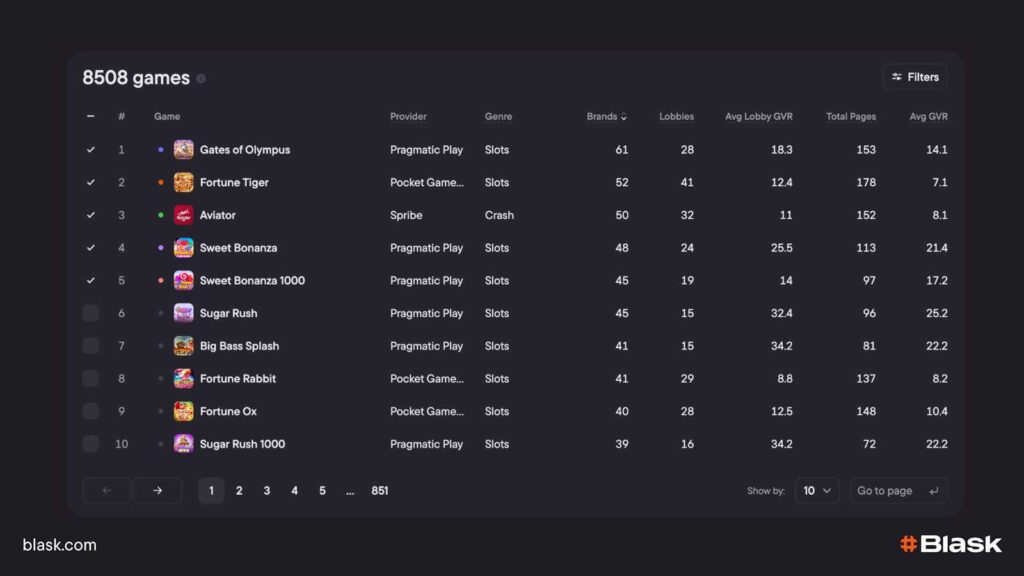
Game Visibility Rank (GVR) — Where eyes land inside the lobby.
Aspect
What you see / do
Why it matters
What it is
Every day Blask screenshots every casino lobby, reads tiles left-to-right, top-to-bottom, and assigns a seat number.
Rank 1 is the first tile players see; Rank 100 can be three scrolls down.
Seat 1 captures ≈80% of clicks. Knowing a game’s rank tells you, instantly, whether it’s getting the exposure its revenue deserves.
Where to view
Games tab → Avg Lobby GVR line chart (placement trend) + sortable games table. Click any title for a per-brand seat breakdown.
One screen links placement and performance — no more cross-checking BI and back-office reports.
Real-world proof
Aviator fatigue — When Aviator slid to Avg GVR 28, operators bumped two crash titles trending in Mozambique. CTR and stake volumes rebounded the same night.
Cross-geo cloning — A slot sitting at Avg GVR 12 in Mozambique was ported to Argentina & Peru; day-one CTR +18 %, week-one GGR +11 %.
Shows how reacting (or copying) based on GVR turns placement into profit.
📊 Bottom line: GVR turns your lobby from a static storefront into a performance billboard — you always know which game deserves the prime seat and which one has overstayed its welcome.
Putting the five KPIs to work — a mini-playbook.
Pick markets with Index ↑ and low operator density.
Boost BAP via influencer runs or odds boosts when visibility stalls.
Check APS on the 10 th – if below forecast, patch acquisition leaks fast.
Compare GGR to CEB band – monetise better or throttle spend.
Use GVR + Index to keep lobby row 1 stocked with the games cohorts crave this week.
Run the cycle monthly and leaks become lifts, surprises become signals.
Conclusion.
These five metrics form a closed control loop: Index → BAP → APS → CEB → GVR. Together they answer the only questions that matter: Where is demand?Do players see us?Are we acquiring enough of them?Are we monetising fairly?And does the right game greet the right player first?
Yana Makarochkina is the Chief Marketing Officer at Blask, specializing in B2B and iGaming content marketing. With a background in journalism and agency experience across industries from hospitality to logistics, she combines strategic thinking with a passion for fact-based storytelling — making complex ideas clear, compelling, and actionable.
Legal poker rooms operate in fewer US states than legal online casinos — offshore operators fill the gap. In the US, online poker is regulated in eight states, but only six of them have licensed operators actually running games. That is a consequence of how the vertical works — and it does not help channelise […]
Most iGaming operators benchmark against their own past performance. That only tells you if you’re growing — not whether you’re winning. This article explains how demand-based signals reveal where any brand actually stands in a market, from #1 to #164.
Blask data shows how much the Indian iGaming market depends on cricket events, especially on the domestic league. Cricket is the number one sport in India — Blask data reveals that iGaming demand in the country strictly follows the cricket calendar. The main booster is the Indian Premier League (IPL) — domestic league, running roughly […]