Gross Gaming Revenue (GGR) tells you what cleared the books yesterday; Competitive Earning Baseline (CEB) reveals what should clear in the weeks ahead.
Used together, the two metrics let operators see whether last month’s haul matched the market’s true potential — and why a rival might still be squeezing more profit from the same pool of demand.
The hard-number comfort of GGR.
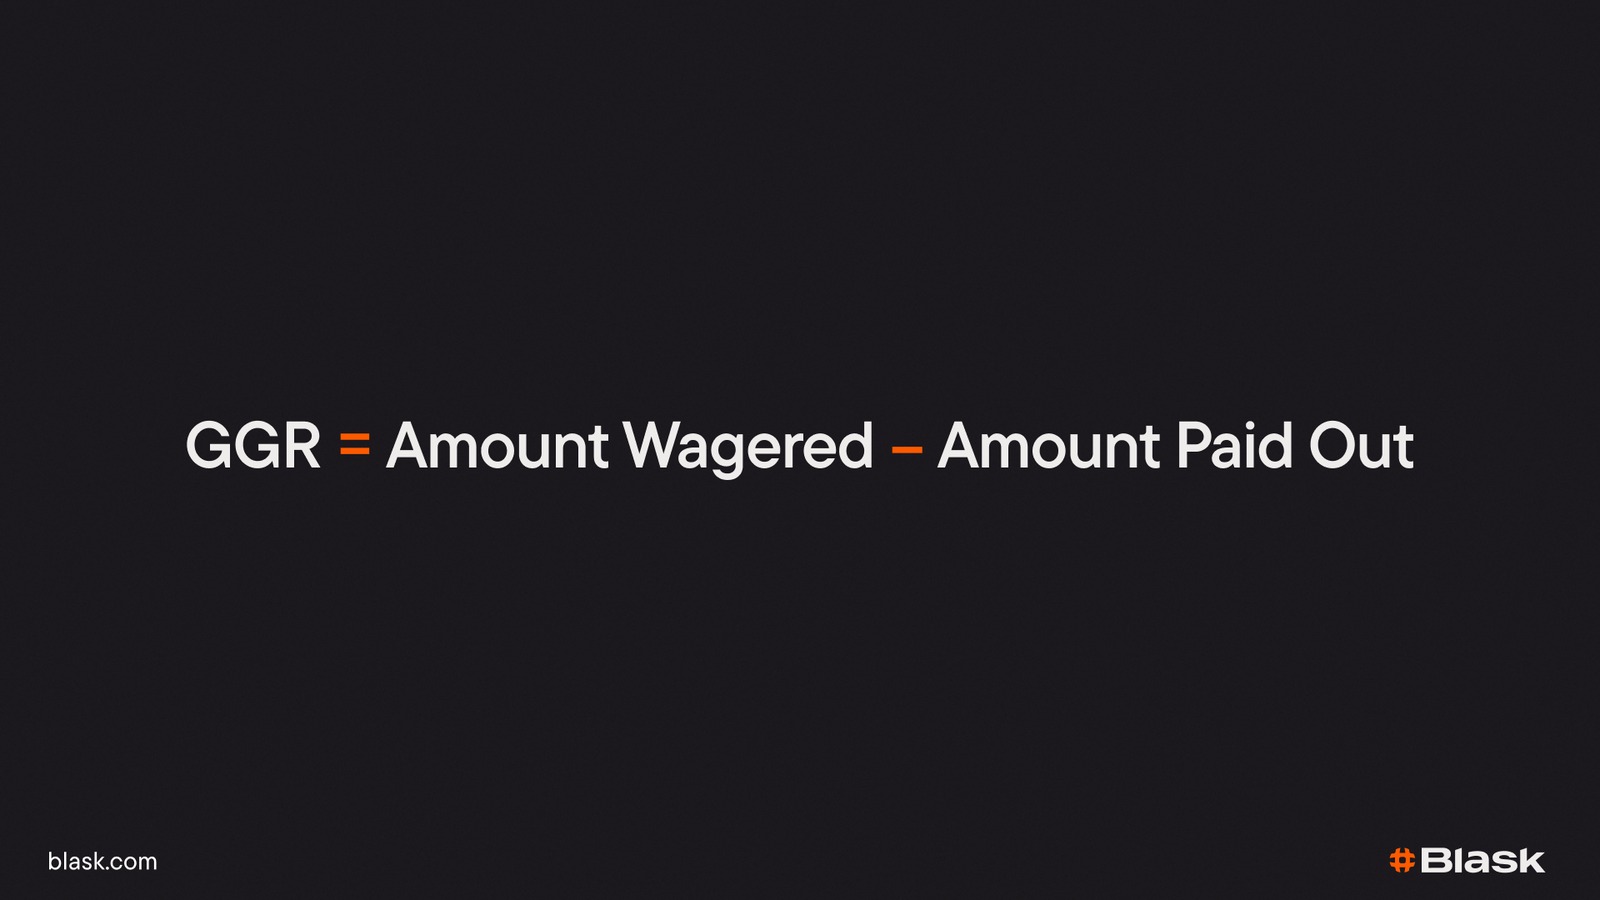
GGR is simple arithmetic: total stakes minus winnings returned to players. Corporate-finance handbooks and earnings calls rely on it because it maps neatly to the P&L headline and tax liabilities.
Analysts love GGR because it is concrete; regulators love it because it is auditable.
Where GGR falls short
- Lag: It is, by definition, yesterday’s story.
- Demand-blind: A TikTok craze or search-interest boom doesn’t surface in GGR until wallets finally open.
- Context-free: A rising GGR can mask the fact that a faster-growing rival is taking future share.
Why Blask built CEB as the forward lens
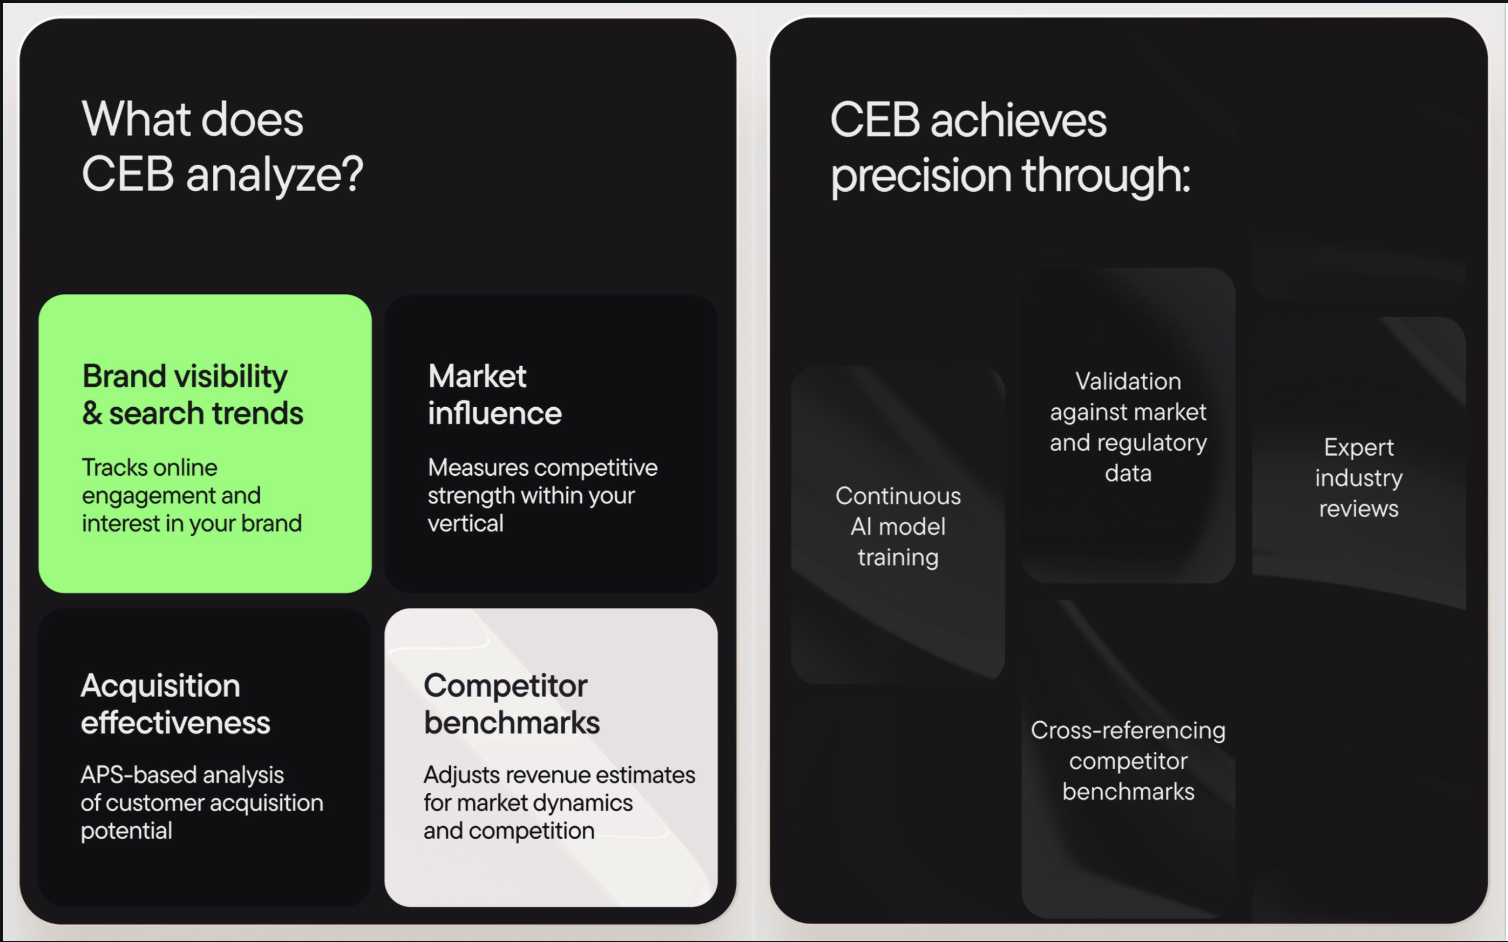
Competitive Earning Baseline is a three-tier USD range —worse, average, better— published monthly for every brand and every regulated market inside Blask. The AI model behind it blends:
- Demand signals: Blask Index, a refined share-of-search feed that updates hourly.
- Brand power: Brand Accumulated Power (BAP) gauges how entrenched that demand already is.
- External context: regulation changes, seasonality spikes, income trends and competitor monetisation efficiency.
The result is a realistic month GGR — call it the wind-screen forecast opposed to the rear-view mirror.
🔗 Deep dive: Ushering in APS & CEB for a new era of brand performance
| Business question | GGR answers | CEB answers |
|---|---|---|
| How did we do last month? | Exact net of bets minus wins. | — |
| How much should we do next month? | No visibility. | USD range grounded in demand & context. |
| Are we monetising efficiently? | Needs manual benchmark. | GGR plotted against CEB band shows the gap instantly. |
Why Blask built CEB as the “Forward Lens”
Competitive Earning Baseline (CEB) is Blask’s monthly, AI-generated revenue estimation. Once per calendar month — on the 10th — it publishes a three-tier USD corridor ( Worse ∙ Average ∙ Better ) for every brand in every regulated market.
How the model works
- Brand Accumulated Power (BAP) – core signal of current brand visibility and loyalty.
- Third-party macro data – regulation shifts, seasonal events, disposable-income curves, competitor monetisation efficiency.
- Demand pulse – prior-month Blask Index values to anchor real search interest.
Because CEB is locked only after the month fully closes, it reflects all contextual drivers — hence the “windscreen” forecast versus GGR’s rear-view mirror.
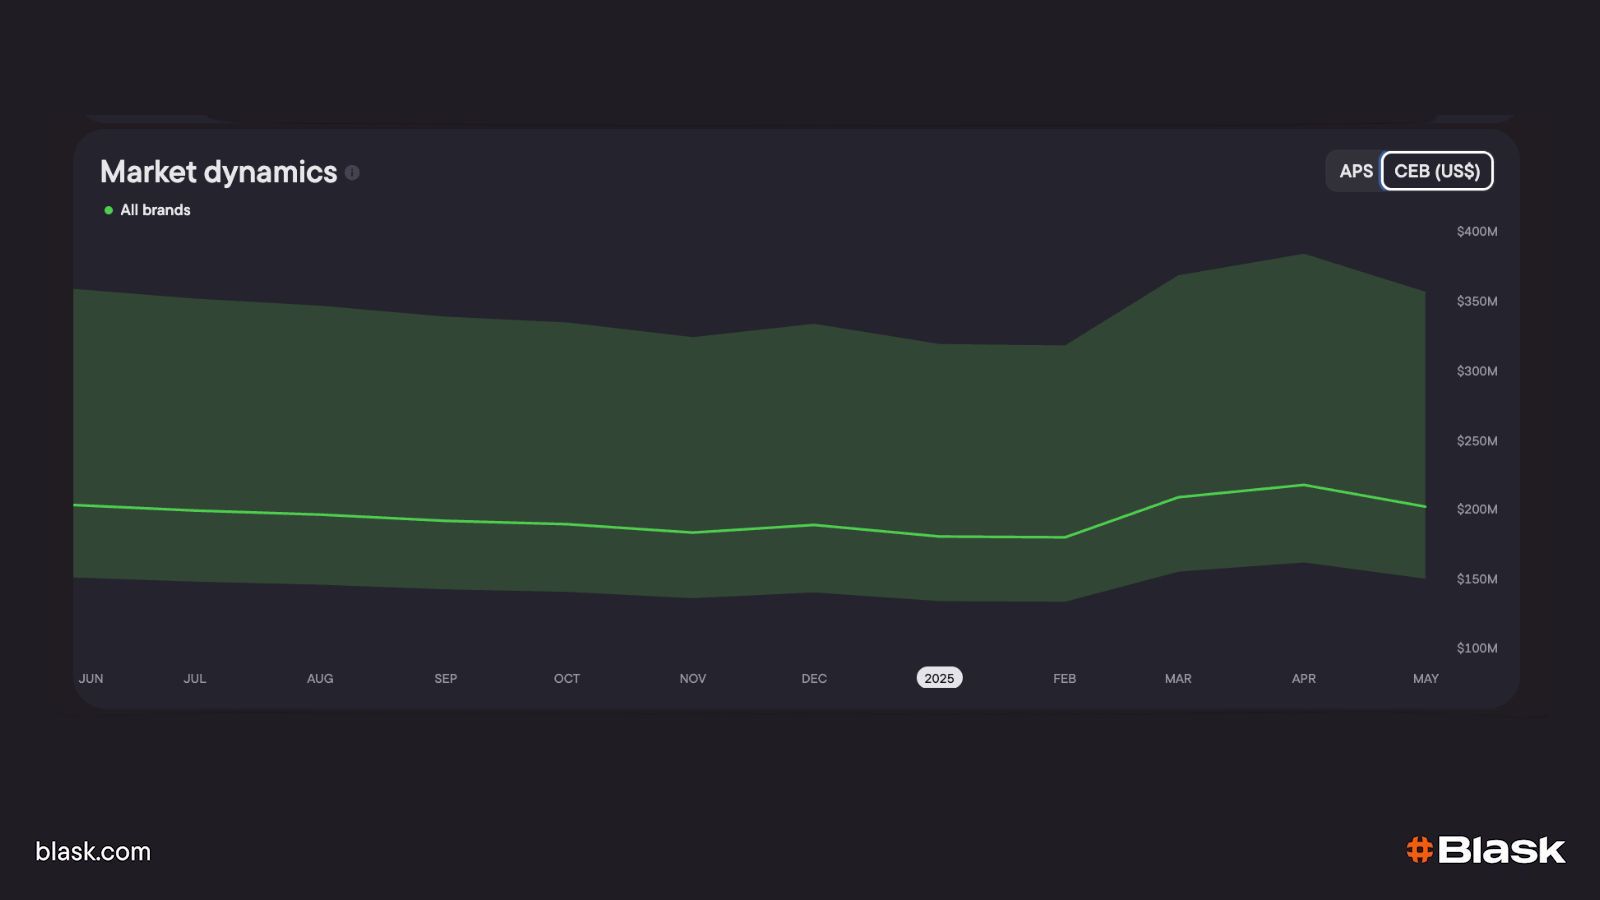
Reading the green zone
Blask visualises the CEB range as a green band on your revenue chart:
| If your internal GGR lands… | What it means | Next move |
|---|---|---|
| Inside the green zone | Performance is aligned with market reality. | Stay the course, optimise margins. |
| Below the Worse line | You’re leaving money on the table. | Audit pricing, funnels, and cross-sell immediately. |
| Above the Better line | You’re outperforming even the AI’s upper bound. | Double-down on the strategies driving the overage and share learnings. |
The Average marker is perfect for competitive benchmarking — stack your CEB midpoint against rival brands to see who monetises demand most efficiently.
Bottom line: CEB turns opaque “what could we earn?” guesswork into a precise, monthly target zone. Hit the green, and you’re in sync with market potential; fall short, and Blask tells you exactly when to intervene.
Brand Accumulated Power (BAP): your hour-by-hour pulse check
Brand Accumulated Power is Blask’s real-time visibility score.
Updated every hour, it fuses share-of-search, paid/organic traffic, social chatter and on-site behaviour into a single percentage that shows how dominant — or invisible — your brand is compared with every other operator in the same market.
📖 Read more: BAP is all you need
Why BAP matters
- Immediate feedback loop – See the impact of a sponsorship, streamer cameo or bonus push within the same trading session, instead of waiting for monthly revenue figures.
- Early-warning radar for CEB – Because CEB’s monthly corridor is built on prior-month BAP plus macro data, today’s BAP trajectory hints at month’s revenue potential.
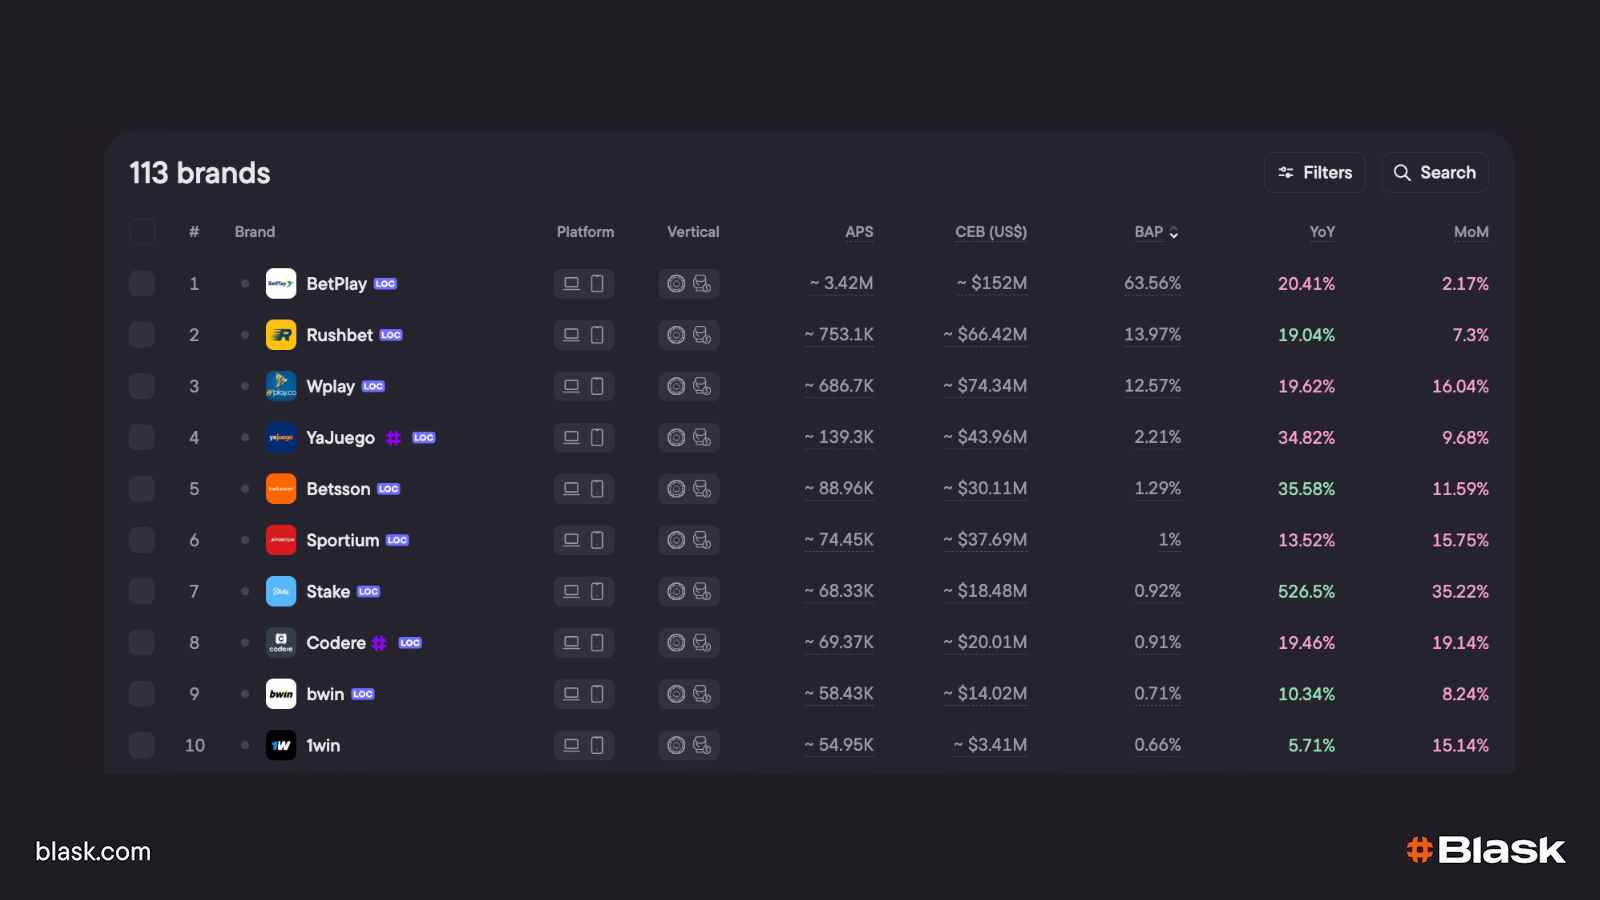
- Tactical benchmarking – Filter the Brands table by ±1 pp of your BAP to spot who is stealing attention and copy their funnel or promo timing before revenue leaks.
💡 Example
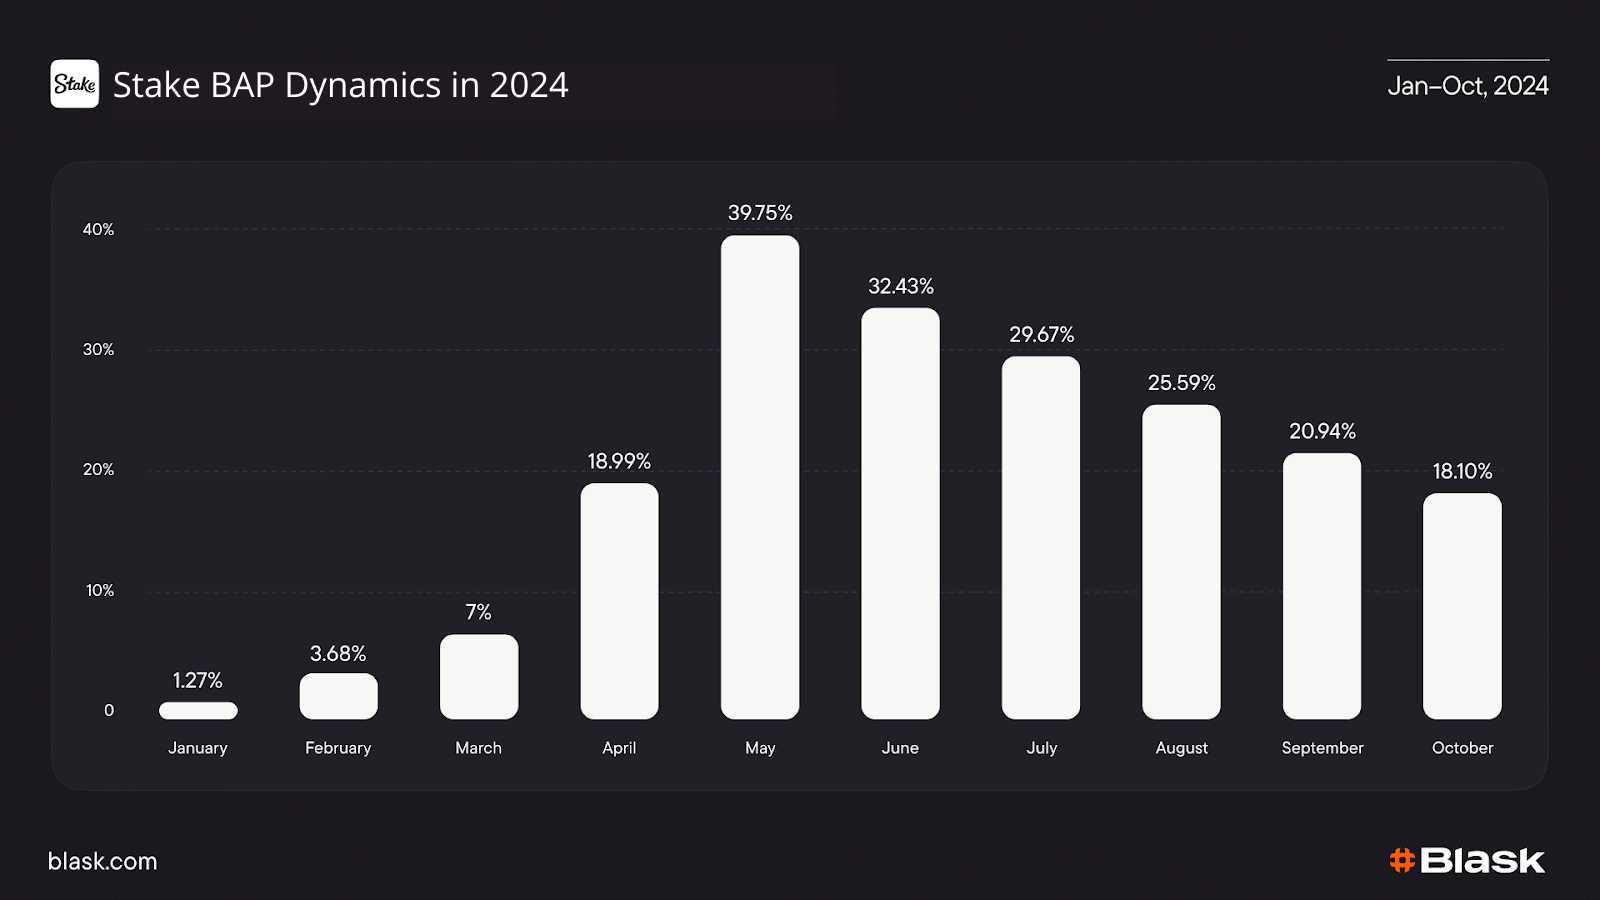
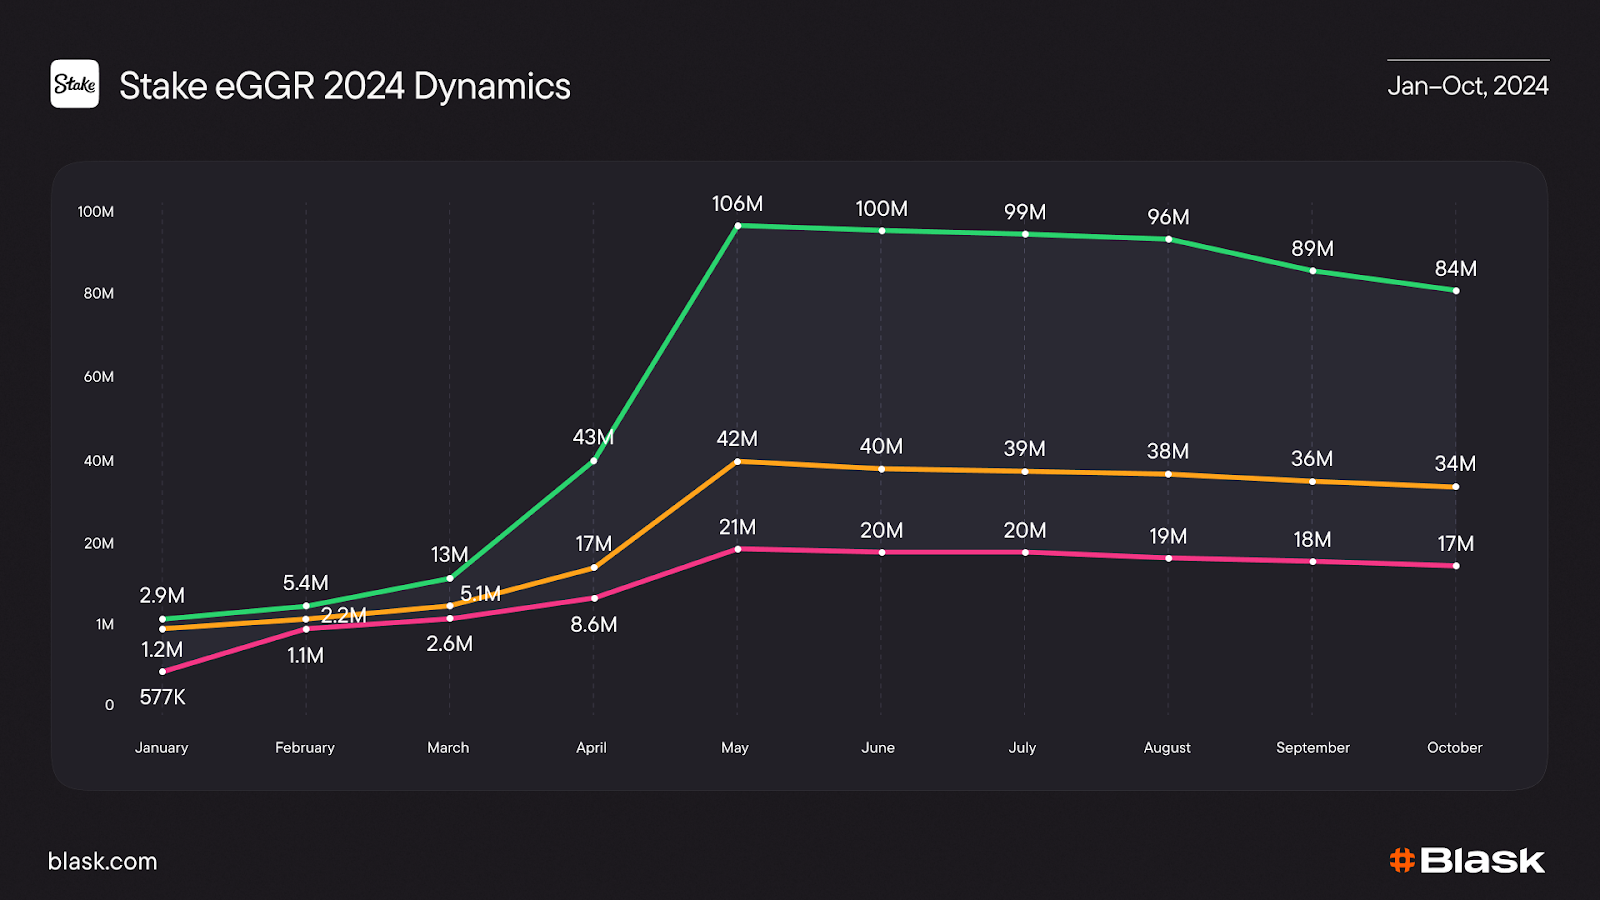
During IPL 2024, Stake’s BAP leapt from ~19% in April to nearly 40% in May. So does CEB.
Go deeper: IPL 2024 impact on Indian iGaming
💡 Take-away: If CEB’s monthly view feels too coarse, watch BAP. Hourly movement tells you whether you’re on track to hit next month’s green zone — or in danger of slipping below the “Worse” line.
Putting GGR + CEB to work — a hands-on playbook
Benchmark externally: turn competitors into your KPI
Plot apples-to-apples charts
- Pull the latest CEB band (worse / average / better) for you and at least three direct rivals.
- Overlay each brand’s BAP and APS on the same time axis.
Read the pattern
- Higher CEB + lower BAP/APS → Conversion supremacy.
Rival is extracting more GGR from less visibility. Deep-dive their welcome-bonus cadence, VIP tiers, and localisation (payment options, language split, local odds formats). - Higher CEB + higher BAP → Double disadvantage.
They out-shout and out-monetise you. Run an awareness sprint (influencer drops, sportsbook price boosts) to close the BAP gap. In parallel, mirror their retention mechanics to narrow the CEB gap. - Similar CEB but lower BAP → You monetise better.
Push acquisition harder; ROI is already proven.
Refresh monthly. CEB rolls forward on the 10th; schedule a recurring review so the board sees competitive deltas before quarter close.
Feed CEB into quarterly & board planning
- Translate bands into board targets.
- Use Average as your base-case budget line.
- Set Better as an internal stretch goal tied to variable comp.
- Treat Worse as the downside guard-rail for cash-flow planning.
- Diagnose the macro signal.
- Rising CEB, flat GGR: latent demand not yet captured.
Expand media spend, speed up KYC, cross-sell to high-ARPDAU verticals. - Falling CEB, steady GGR: holding share but headwinds ahead (new tax, economic dip).
Levers: lock in margin—renegotiate provider fees, tighten bonus burn.
- Rising CEB, flat GGR: latent demand not yet captured.
- Run scenario sessions.
Finance can now model “what-if” curves (e.g., +10 % APS at Average CEB) instead of static YoY comps.
Synchronise APS and CEB: Volume × Value
Acquisition Power Score (APS) is Blask’s monthly forecast of new players you should sign up. The AI model projects raw volume by fusing:
- Brand Accumulated Power (BAP) – how loud your brand is right now.
- Blask Index – how much category demand exists.
- Channel mix & spend – paid, affiliate, organic reach.
- Market frictions – KYC strictness, payment rails, device split.
Think of APS as the top-of-funnel quota — a number of first-time depositors (FTDs) you ought to capture in a month if you keep visibility and budgets stable.
💡 Key takeaway: GGR is yesterday’s scorecard; CEB is next month’s benchmark. Compare them against each other, your competitors, and your APS goals, and you’ll know exactly where and why money is leaking — well before it hits (or misses) the books.
Conclusion
GGR is your certified ledger of yesterday’s wins, but CEB is the AI-driven forecast that shows whether those wins are on-pace, lagging, or sprinting ahead of market potential.
Overlay them — then layer in APS and BAP — and you gain a four-panel dashboard that pinpoints exactly where awareness, acquisition, or monetisation is leaking… or outperforming.
Operators who run this two-lens playbook fix problems mid-quarter, not post-mortem — and turn future revenue into a controllable KPI.
Download the checklist “How Blask helps iGaming operators”