- Updated:
- Published:
Casino analytics keeps demand, acquisition and revenue apart

Casino data analytics is the set of readings used to see demand, new players and revenue as separate series. Fold them into one performance number and the dashboard starts agreeing with itself.
Three series, three clocks
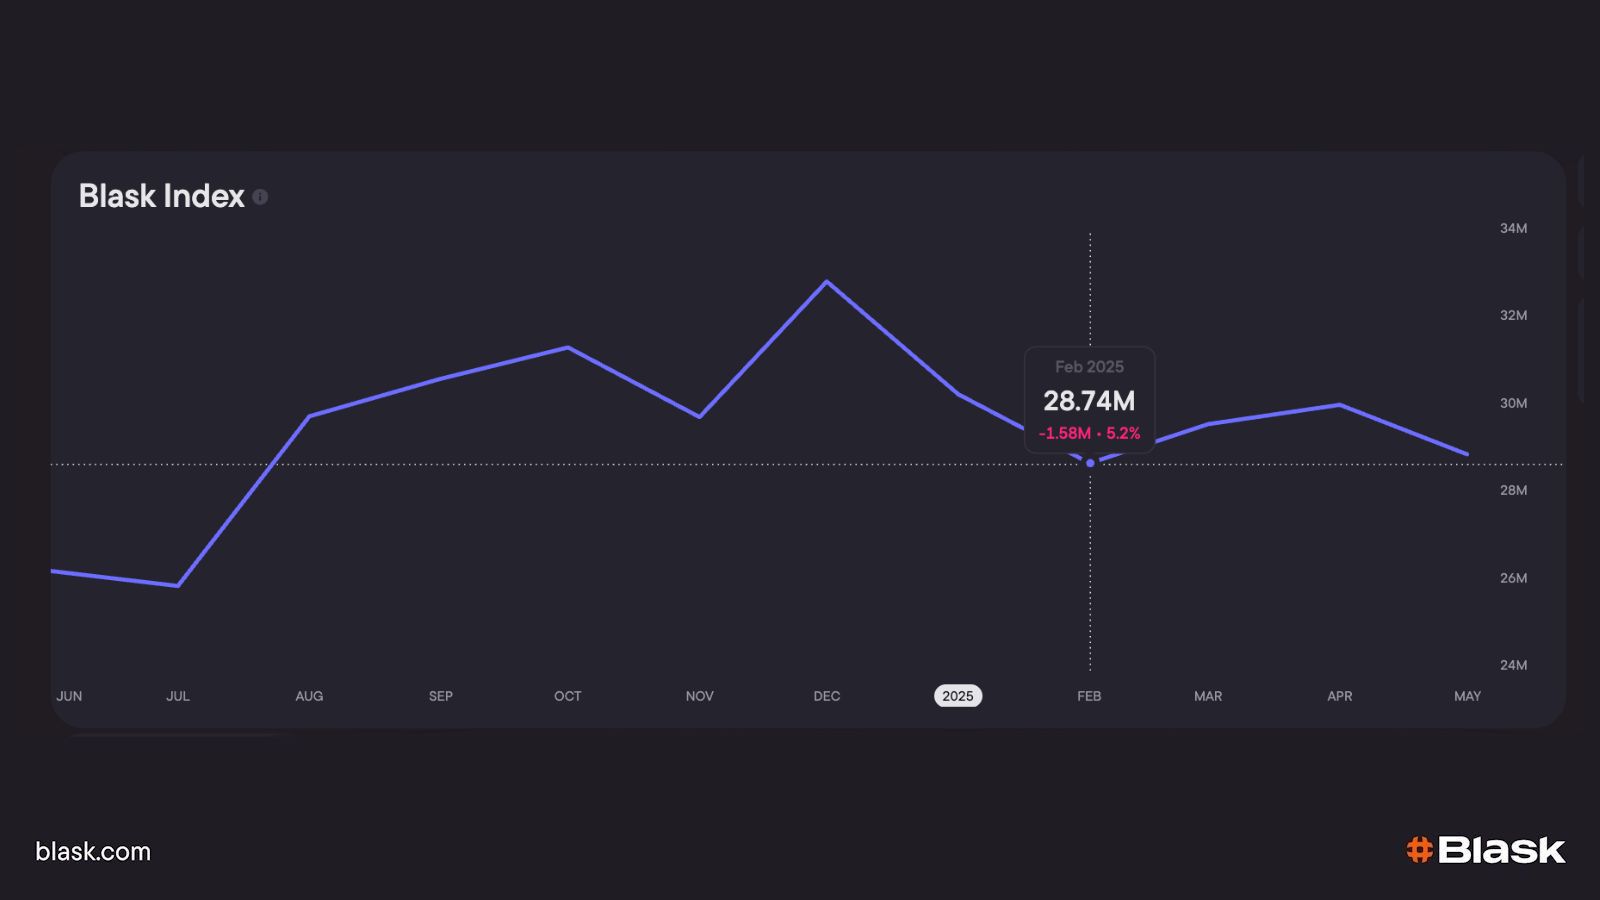
Blask Index moves with branded search, often inside the hour. APS is a back-dated reading of how many new players that demand could have produced. CEB is the revenue baseline those players could have supported, published as an average with a range. Search can rise in an afternoon. The revenue baseline arrives with the closed month. The pair of acquisition and revenue baselines is defined on its own page.
You can watch brand volumes joust in real time, making it dead simple to double down on what works, ditch what doesn’t, and plan tomorrow’s creative with data — not hunches.
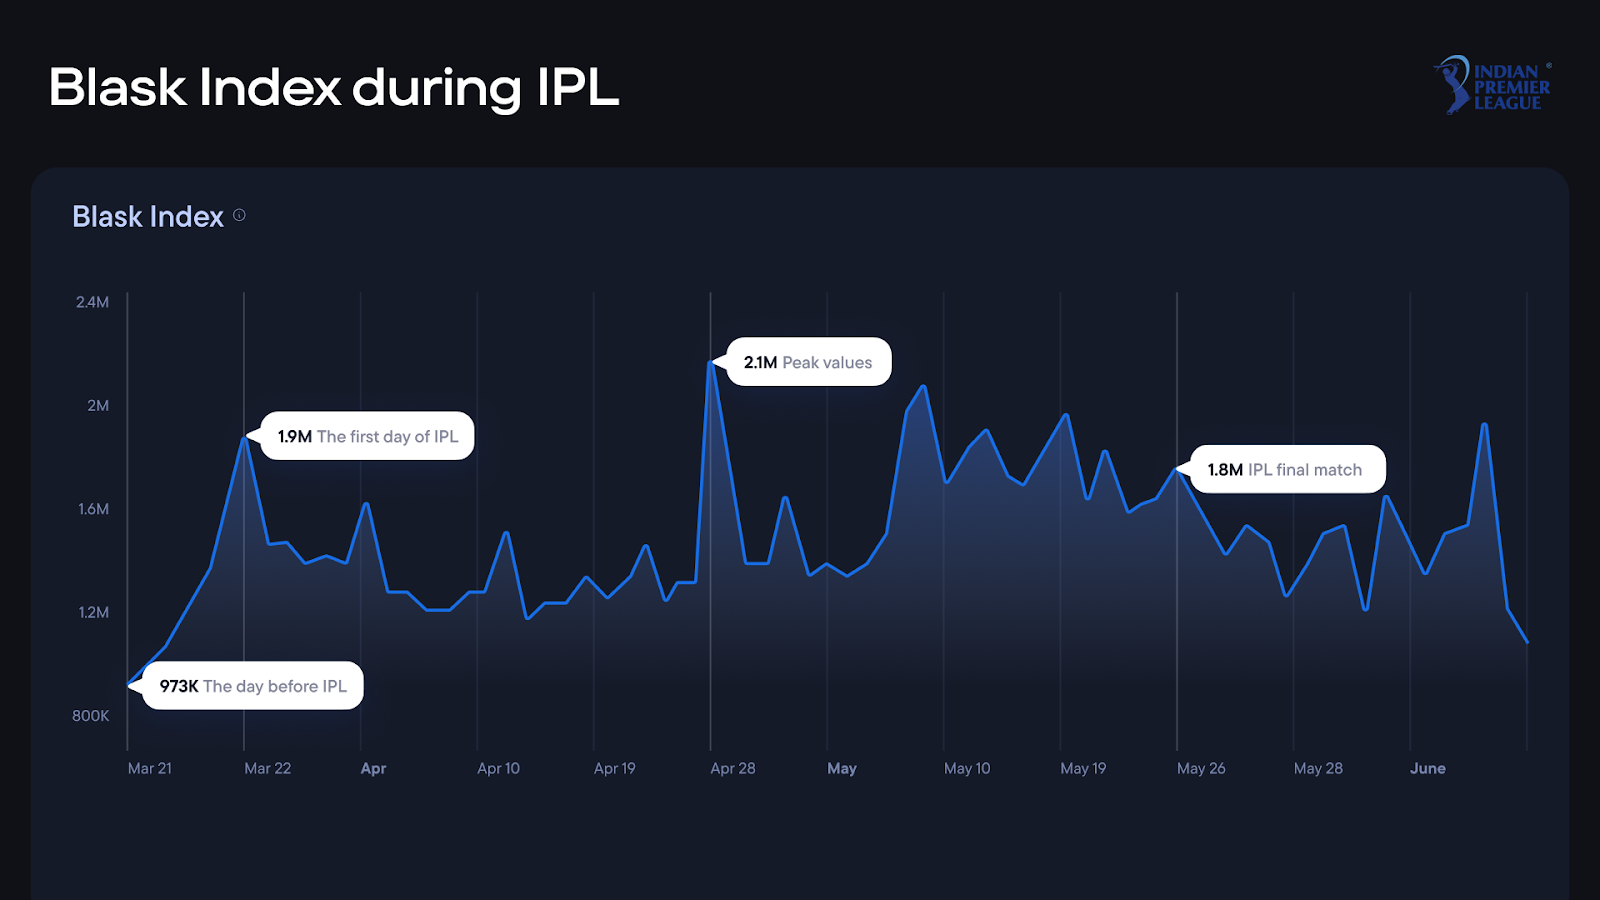
💡 Case in point: During IPL 2024, the Indian Blask Index rocketed to 2.1 M daily searches and a record 47 M in April, while the Olympic buzz barely moved the needle. Moral: bet your campaigns on cricket, not five-ring logos.
The lobby is a fourth series
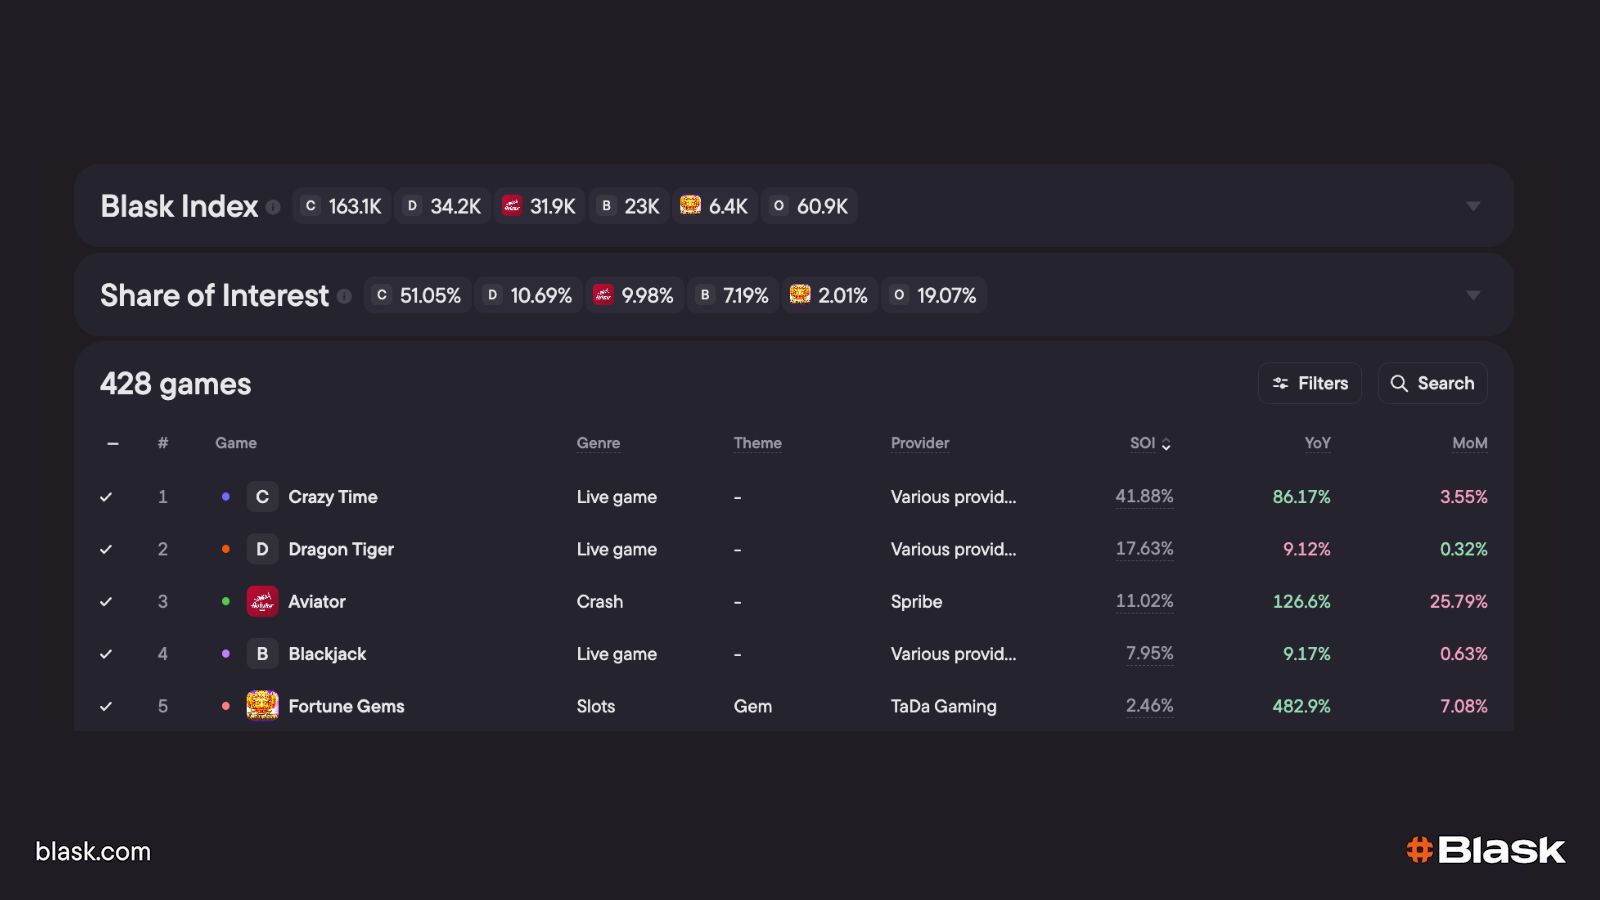
Lobby rank records where a title sits in the lobbies Blask captures. A game can lead search interest and still sit past the first screen. Placement and demand stay parallel readings.
Great content keeps players curious; the right data keeps them clicking.
The goal is simple — offer games people actually want, surface them at the perfect moment, and tweak the experience so everyone feels the stakes are “just right.”
Here’s how the sharpest operators get there, plus an update on Blask’s brand-new Games module, which turns hunches into hard-number intel.
Customer segmentation: know your players, know your profits.
Operators that slice their audience with AI-driven precision see better retention, longer-lived VIPs, and promo spend that actually pays back.
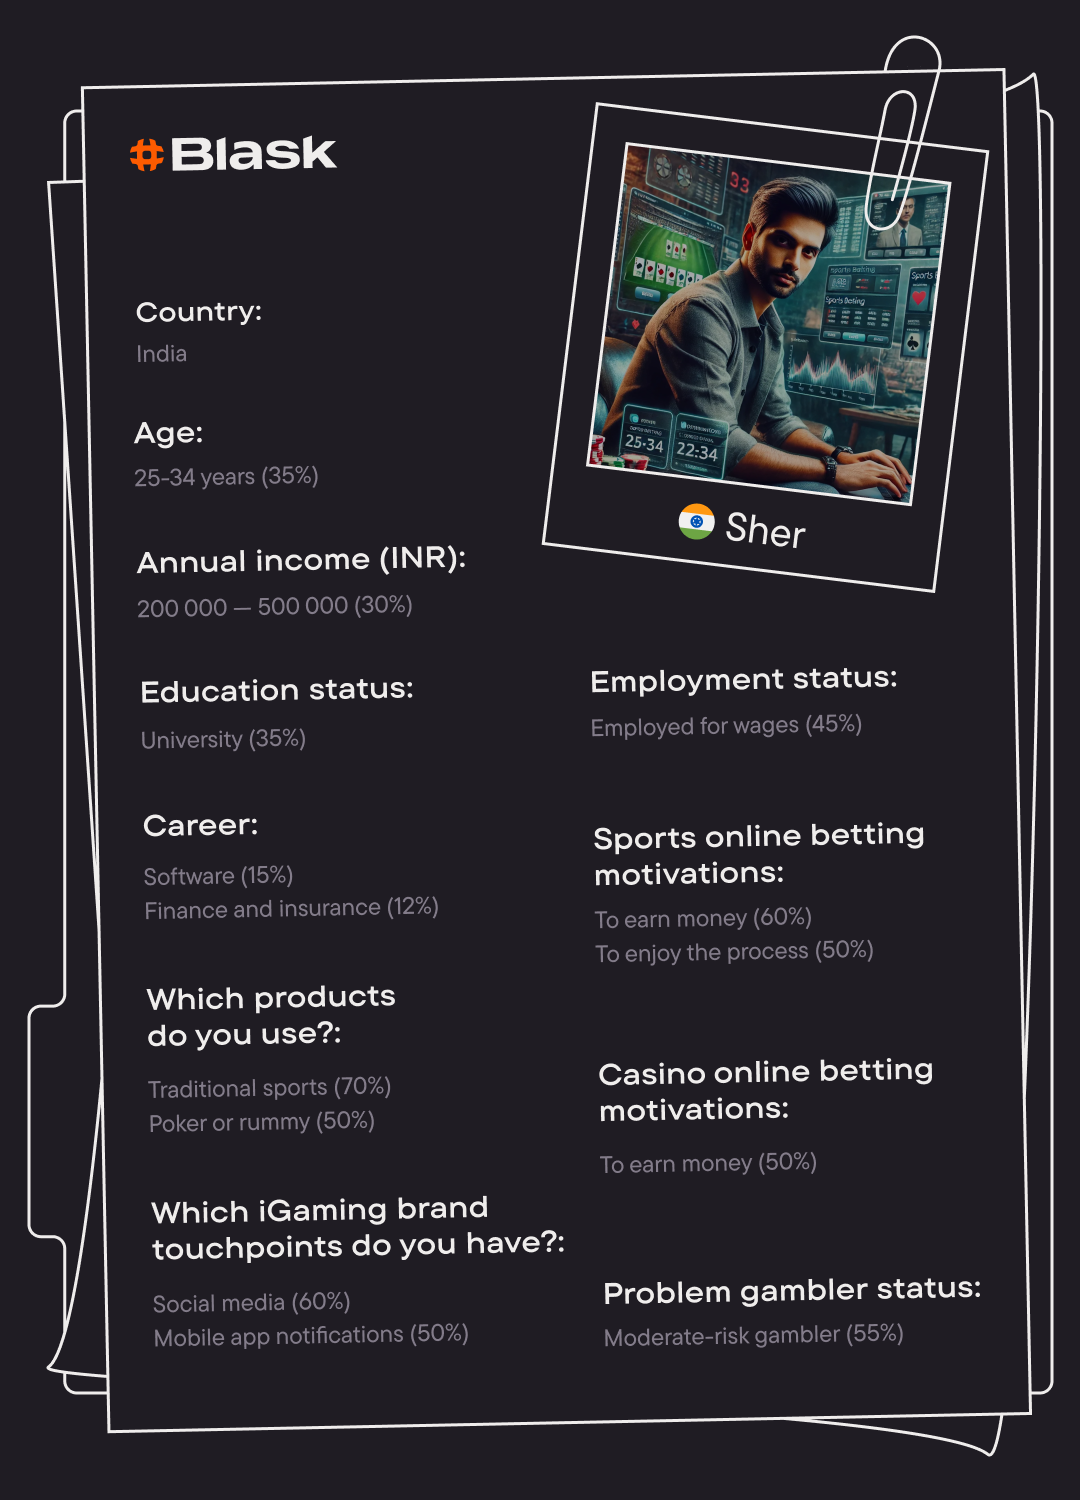
Blask’s Customer Profile fuses 80 000 field surveys with live open-source signals, then layers AI on top to surface the who, what, and why of every iGaming market.
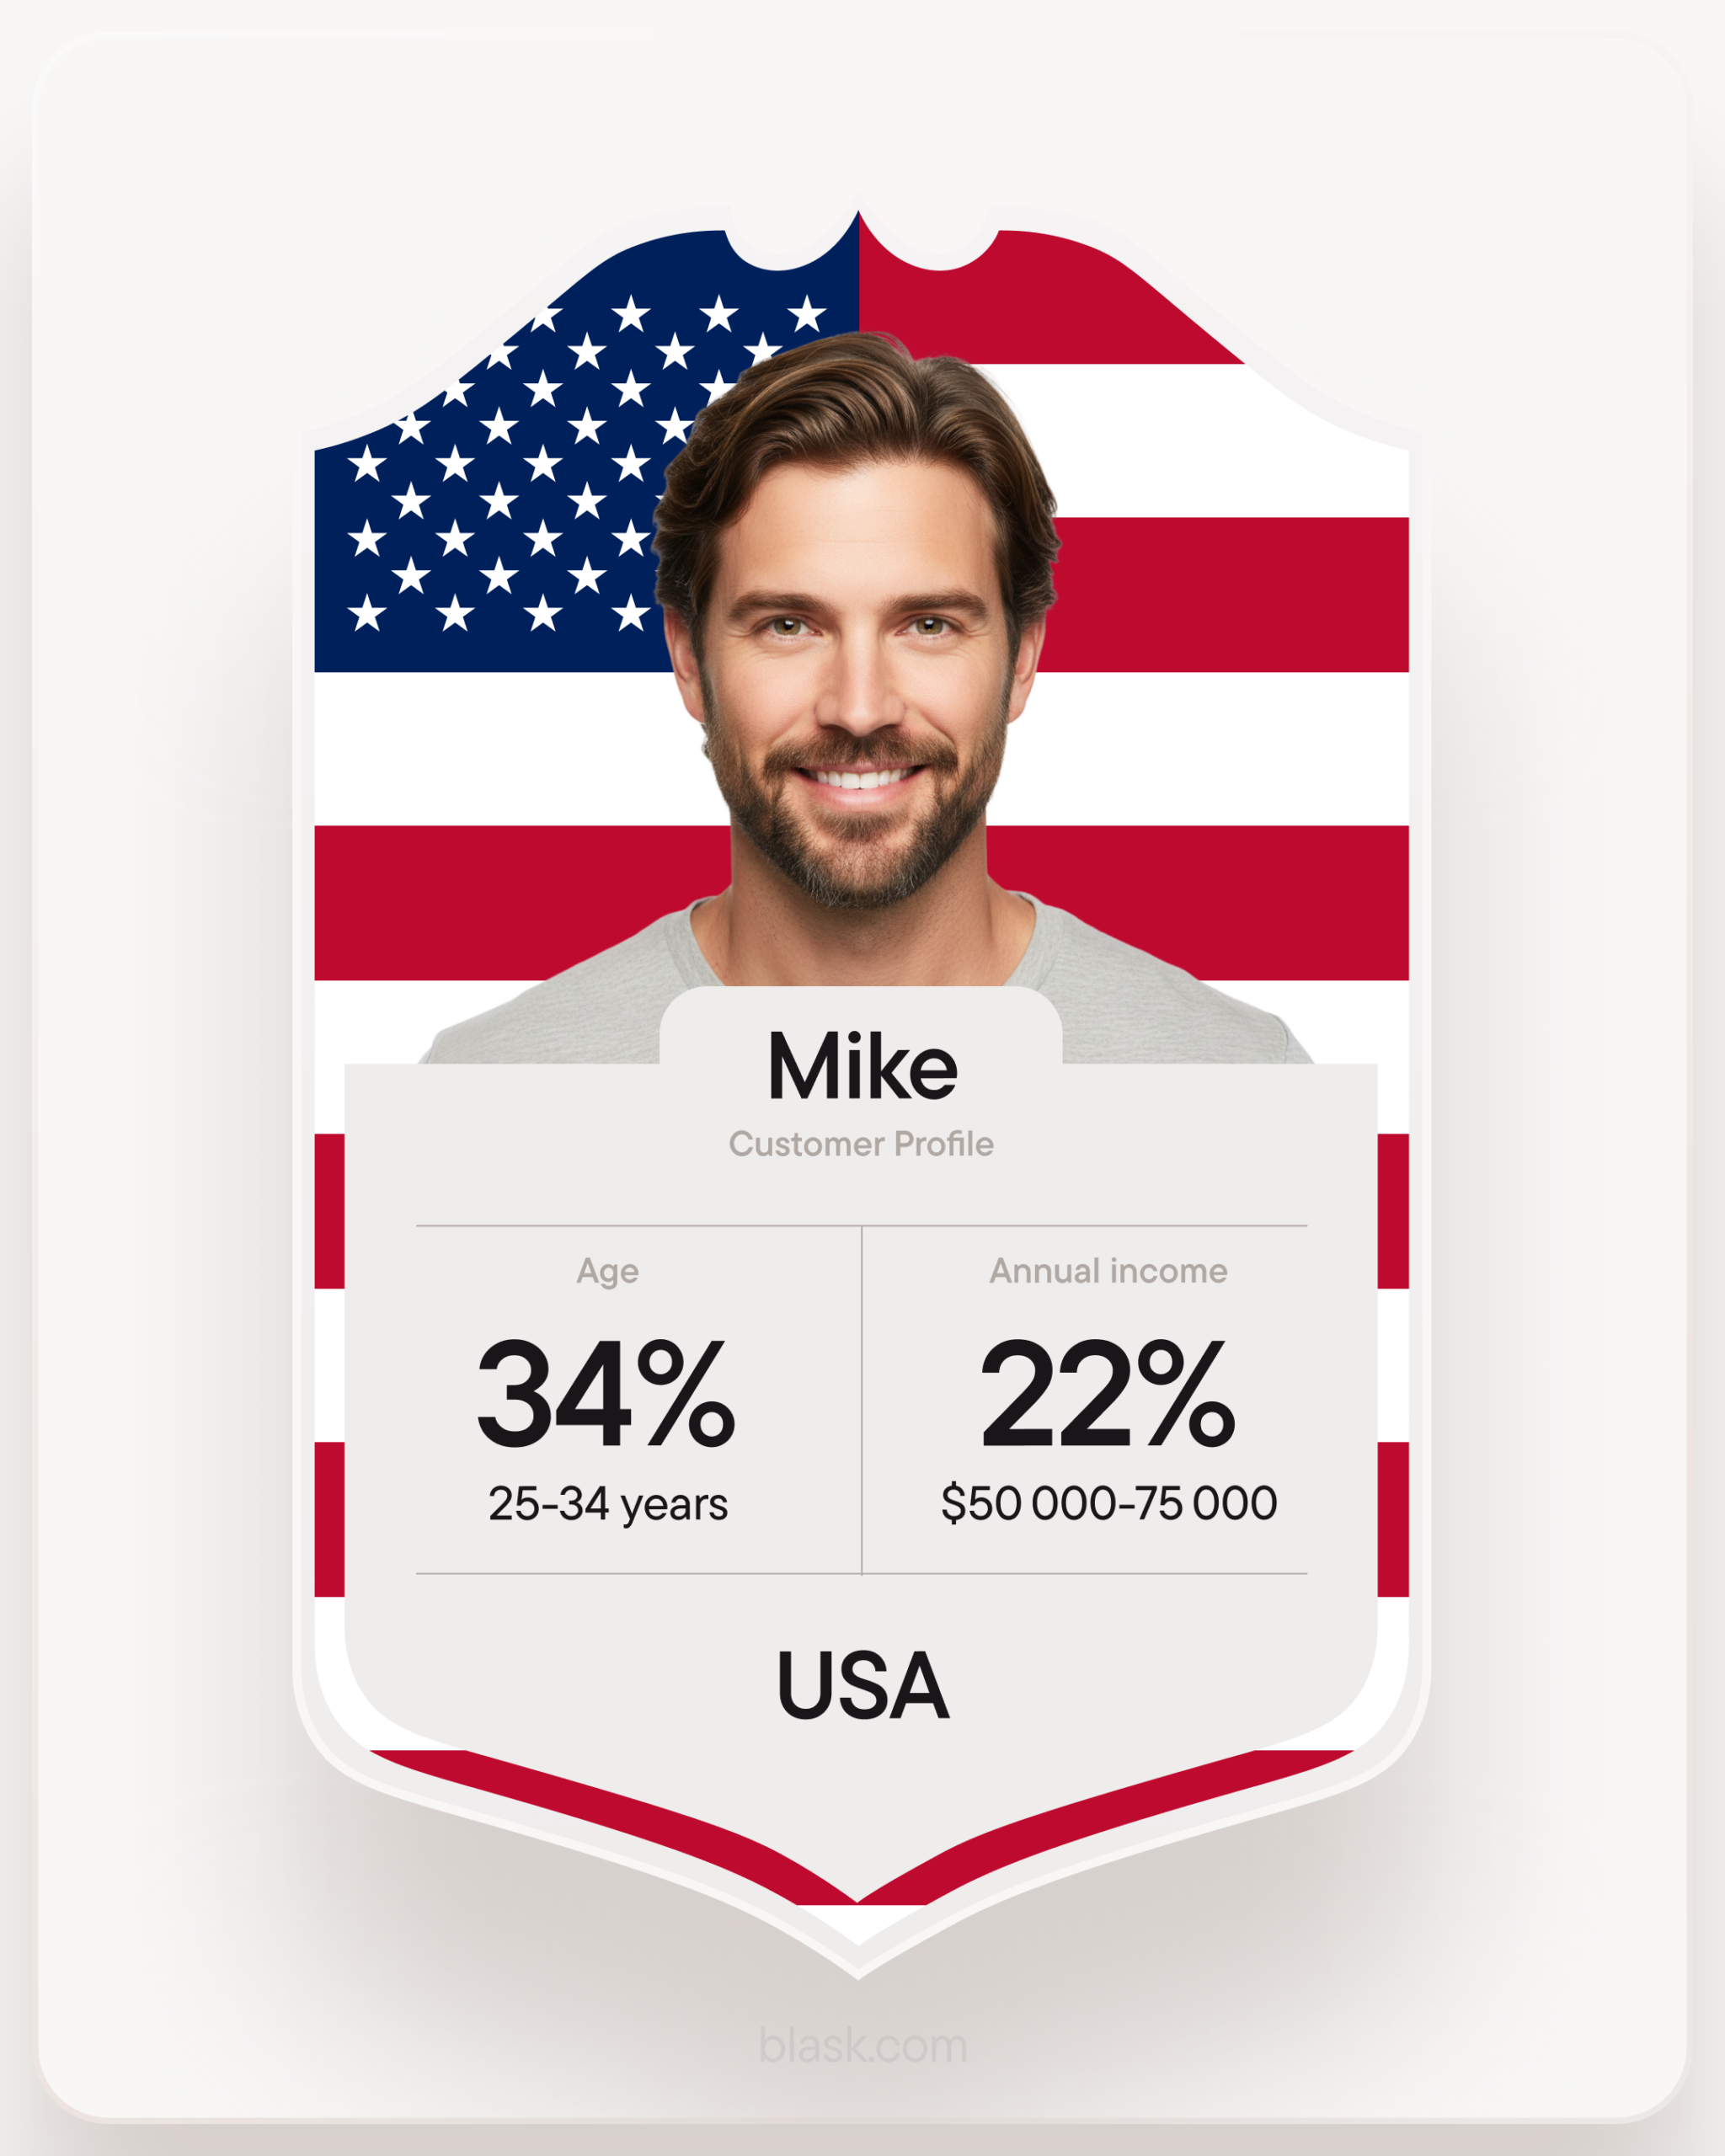
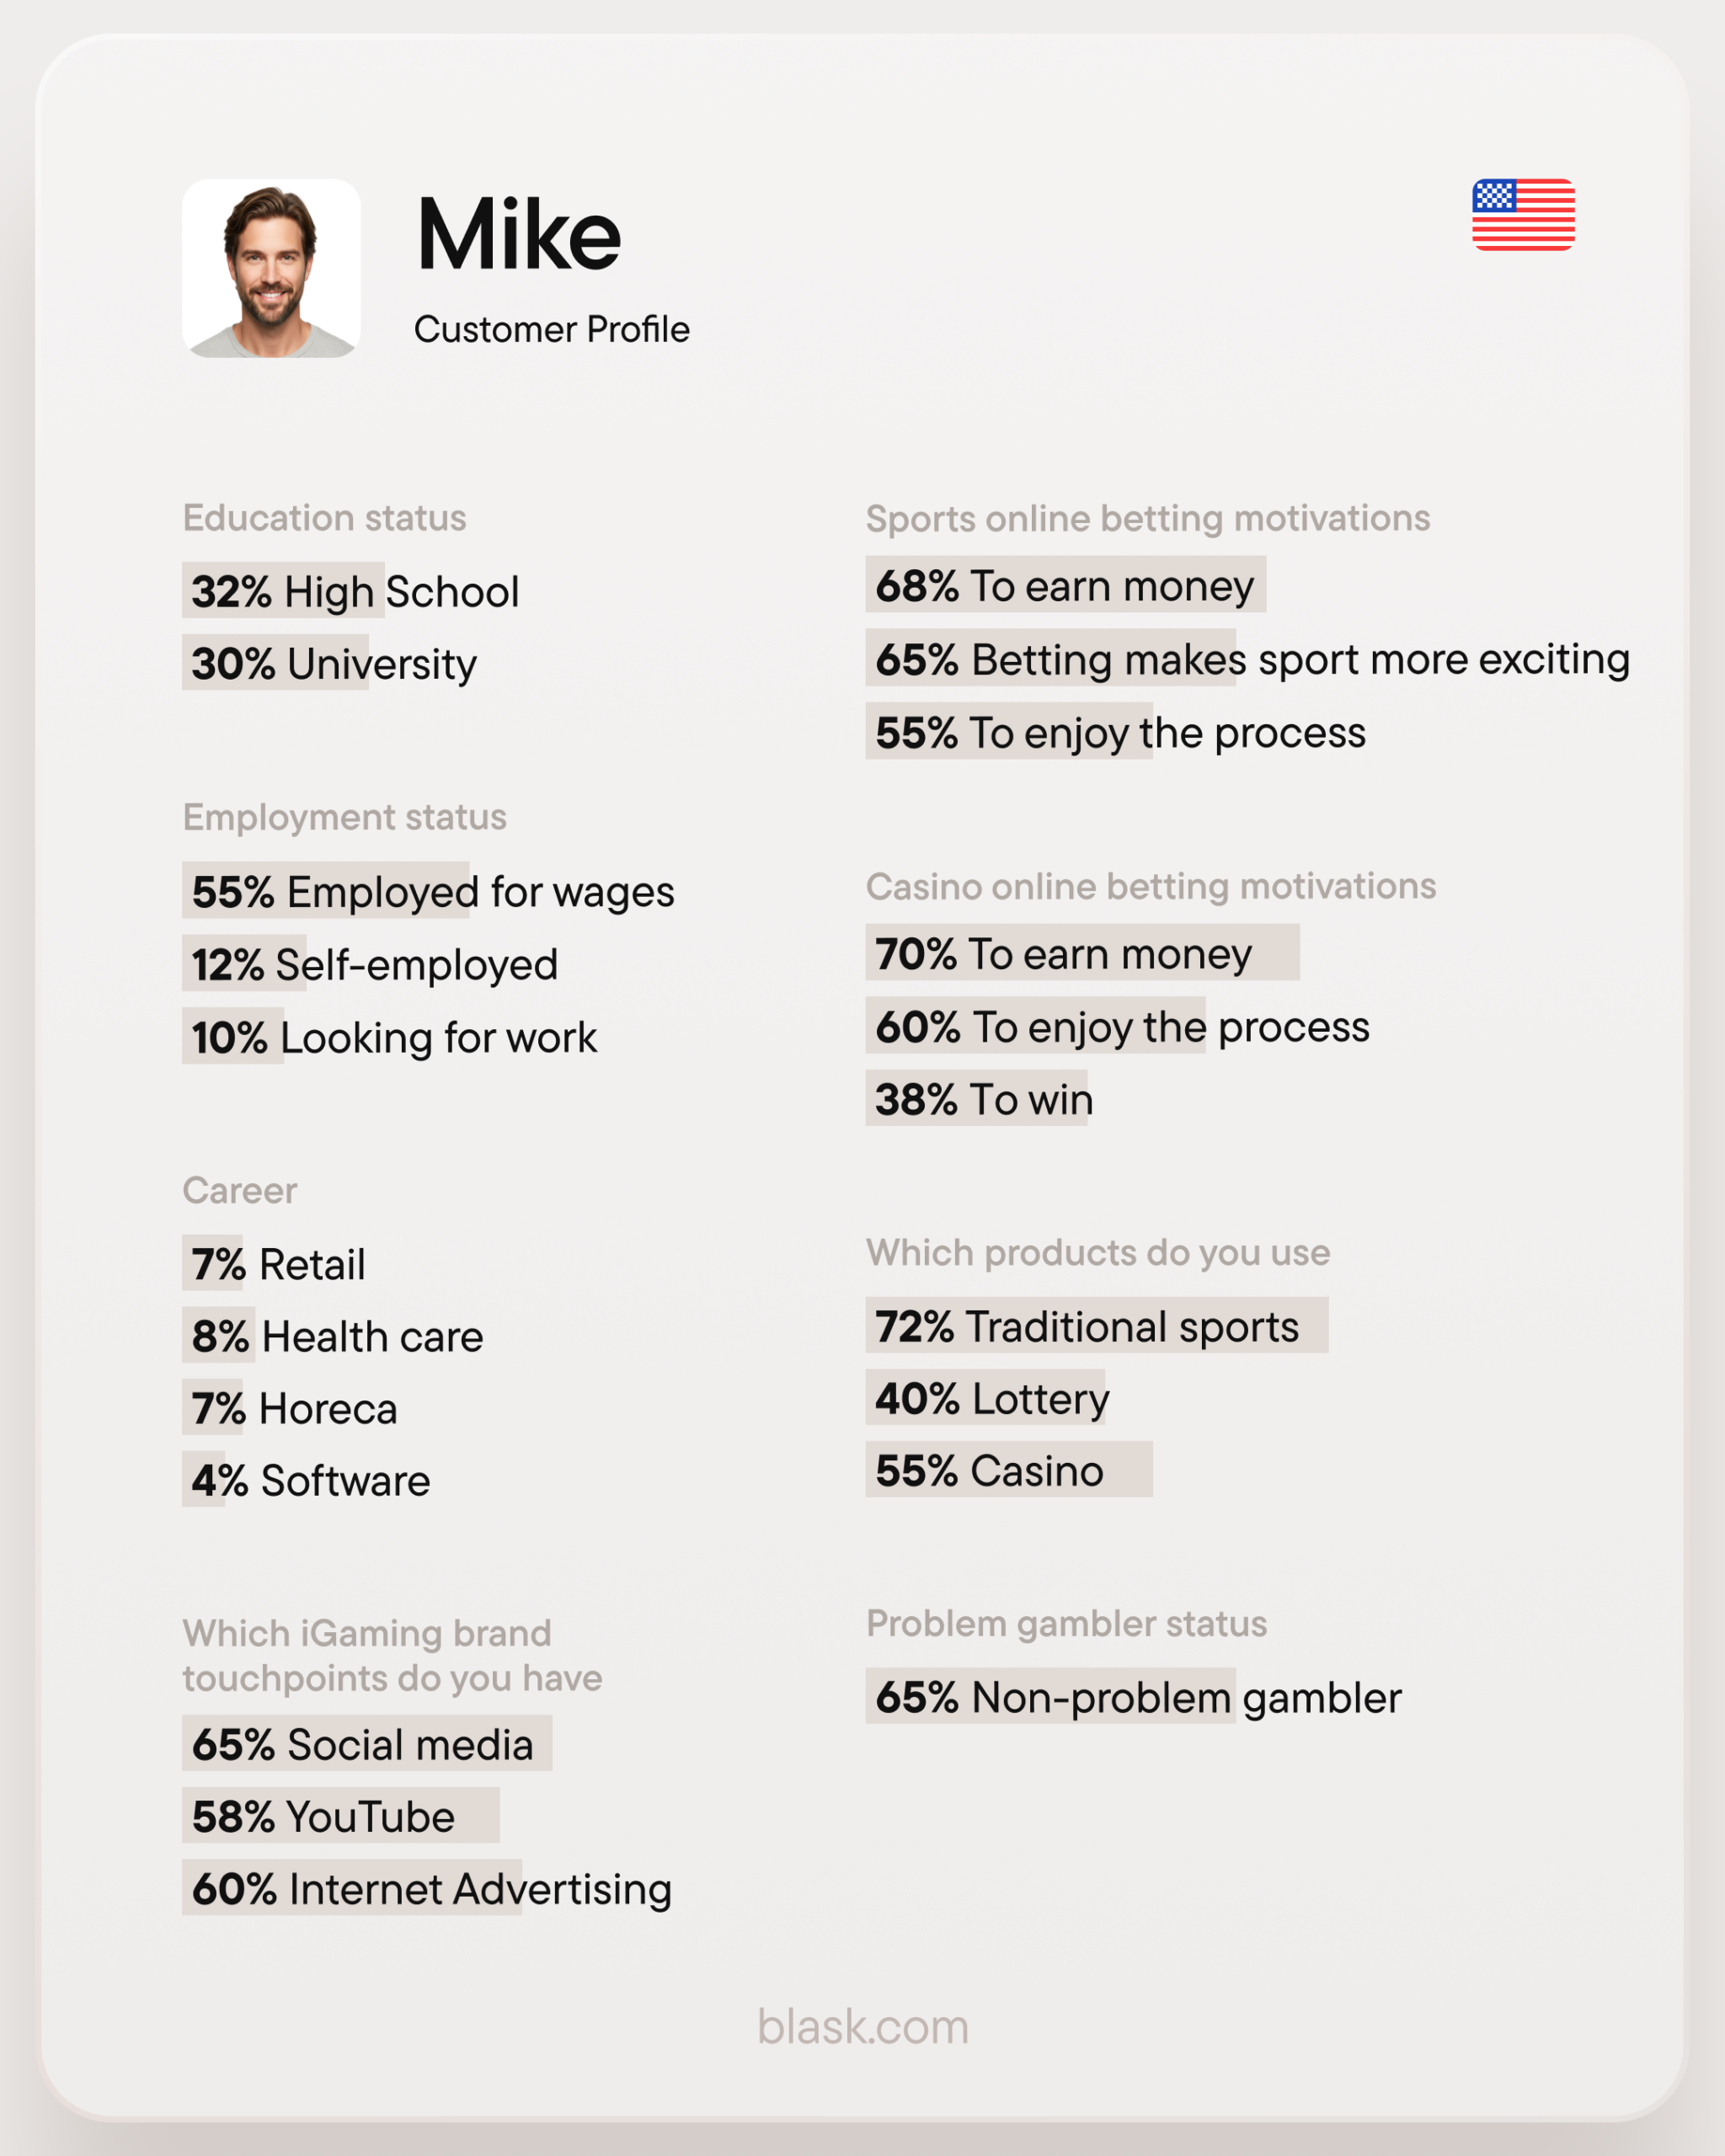
📚 Read more: What is Blask Customer Profile and how it revolutionizes iGaming analytics
Blask’s Customer Profile turns the whole exercise into two clicks. Fed by 80 000 surveys, open-source data and player-psychology models, it sketches hyper-accurate portraits — age, income, motivations, even preferred volatility — so your next offer lands like mind-reading rather than spam.
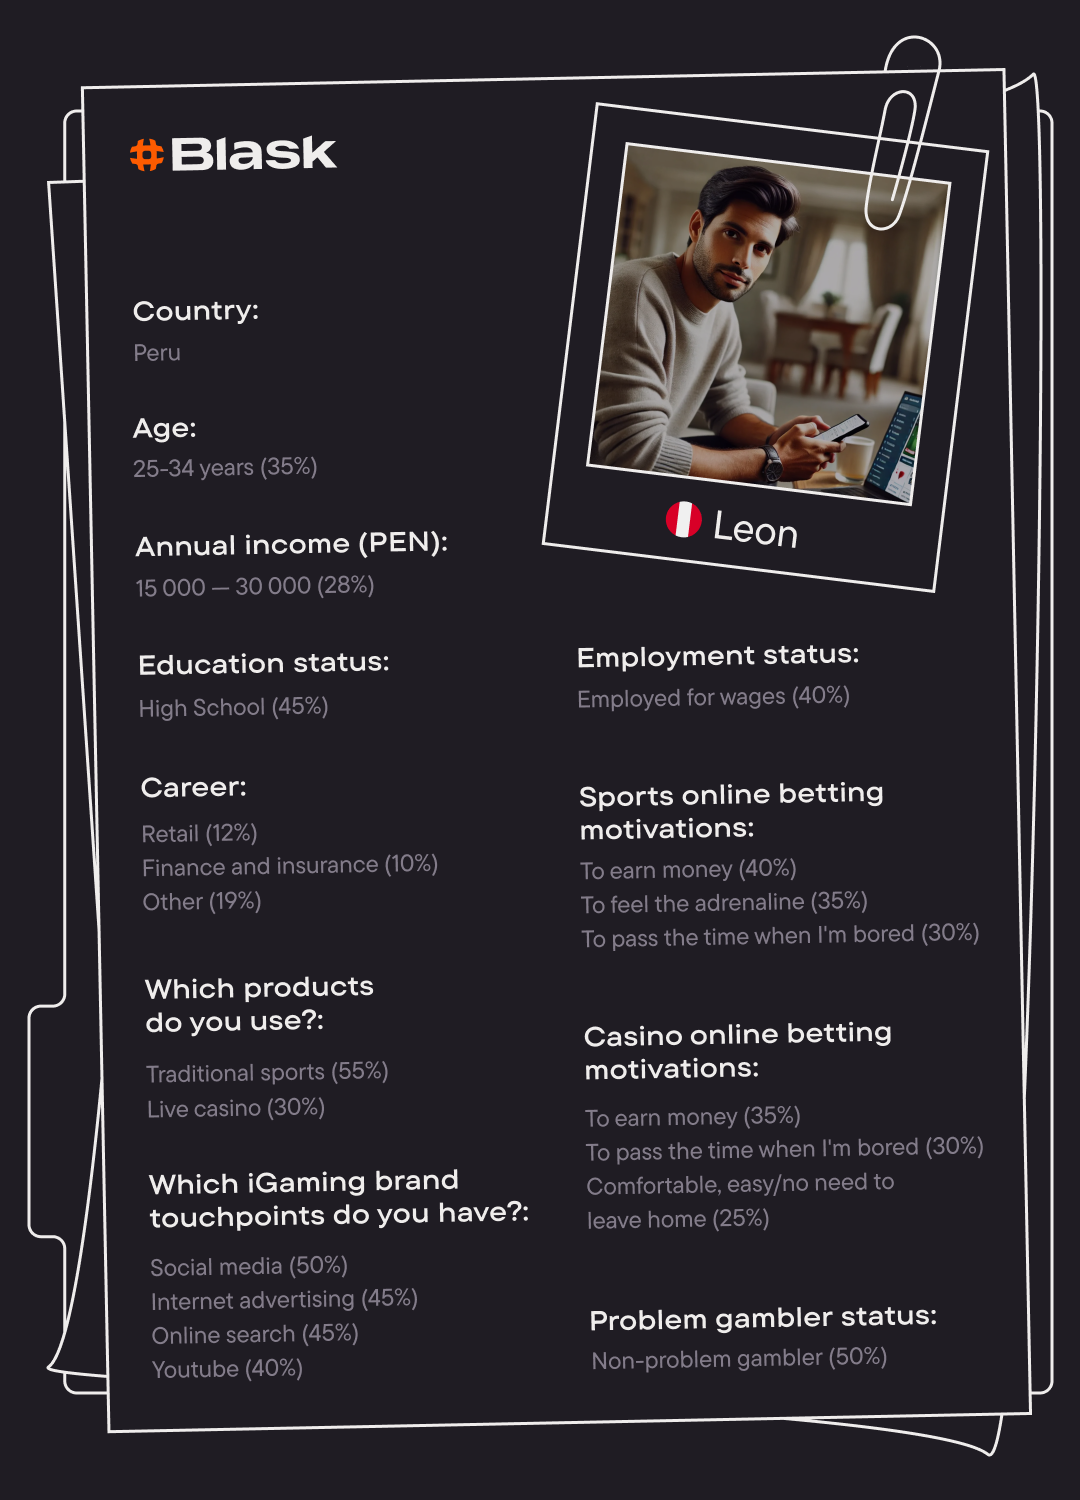
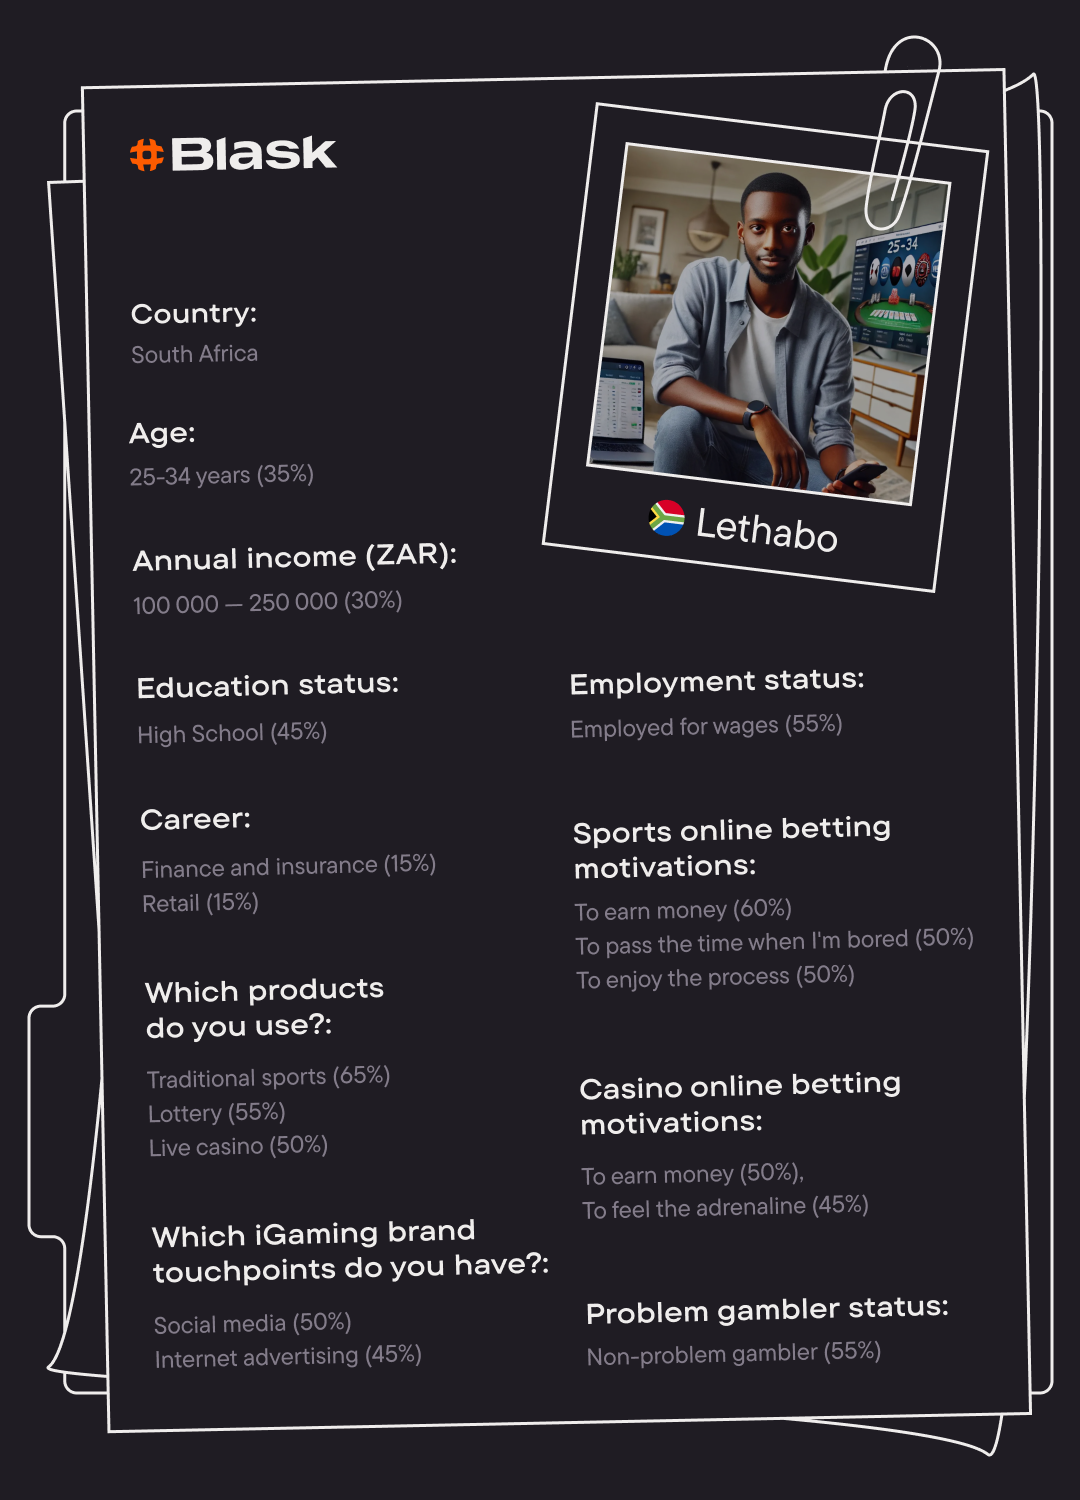
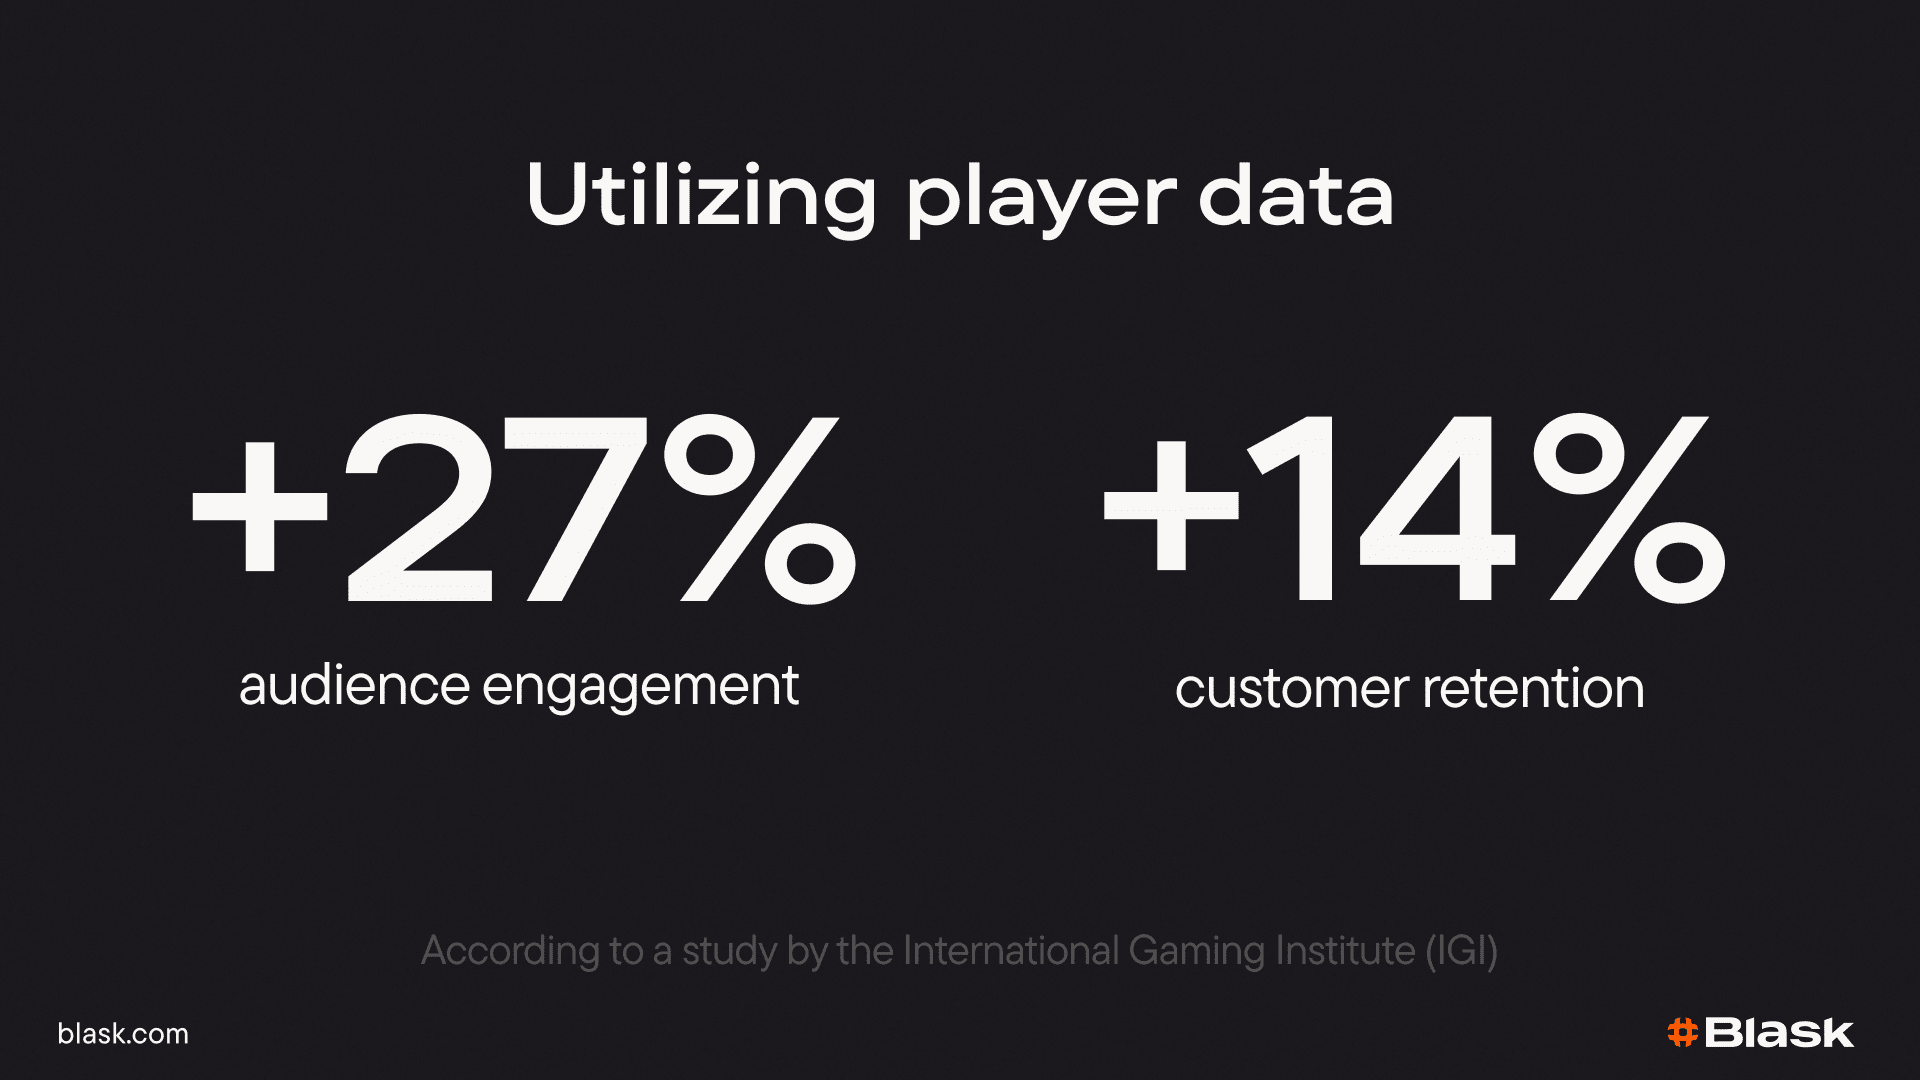
Operators using behavioural cohorts report up to 27 % higher engagement and a 14 % boost in retention versus “batch-and-blast” tactics.
What the four series are for
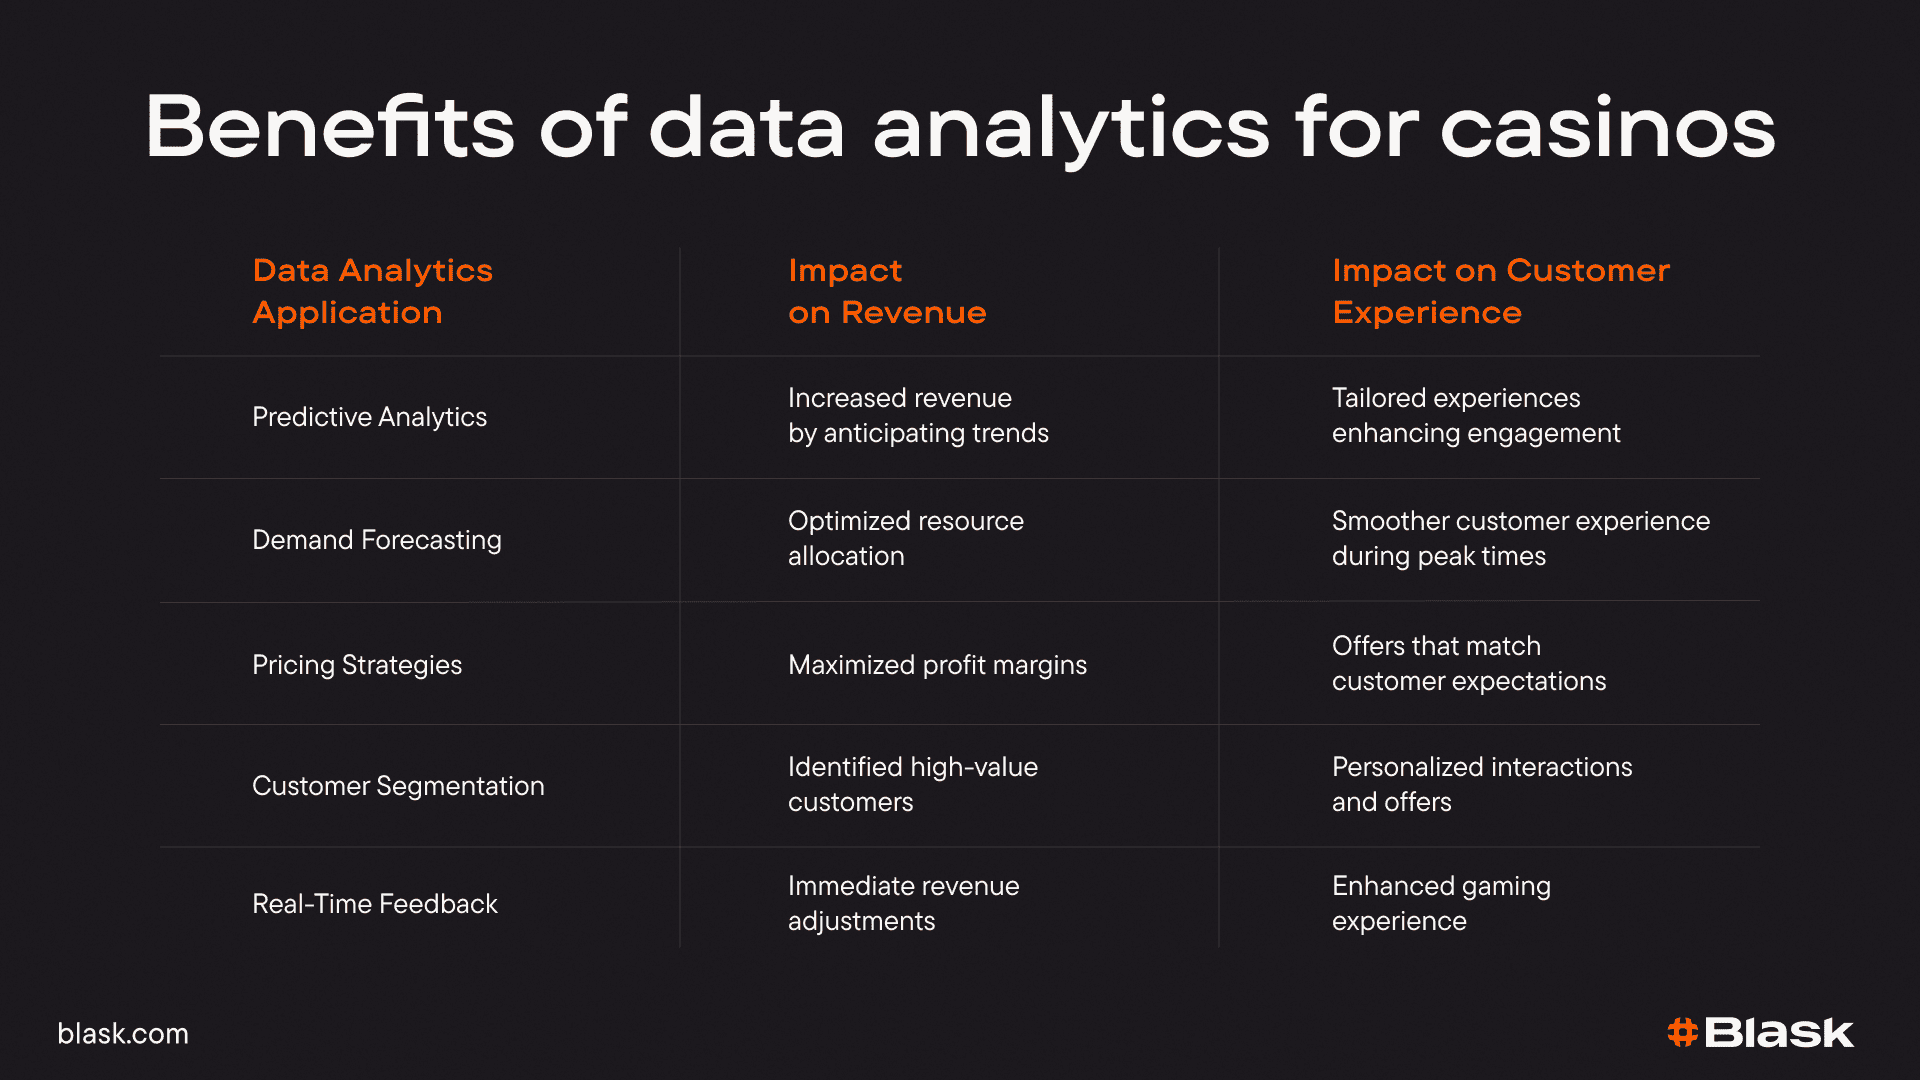
Revenue management in a casino is the attempt to line them up: when demand was present, whether new players arrived, whether revenue matched the baseline, and whether the games being promoted were the ones in front of the player. Weekday patterns and event spikes show up in the demand series first. The named set of those readings is the KPIs page.
Bottom line
Demand, acquisition, revenue and lobby placement move on different clocks. Casino analytics is the practice of reading them separately. A single lift percentage has nowhere to sit once the series are pulled apart.