- Updated:
- Published:
Quick tour: the Game view in Blask Games
The single-game page is where a title steps out of the crowd and tells its own market story. Everything is stacked in a smooth vertical flow, so you can glide from headline stats to operator-by-operator granularity without losing context.
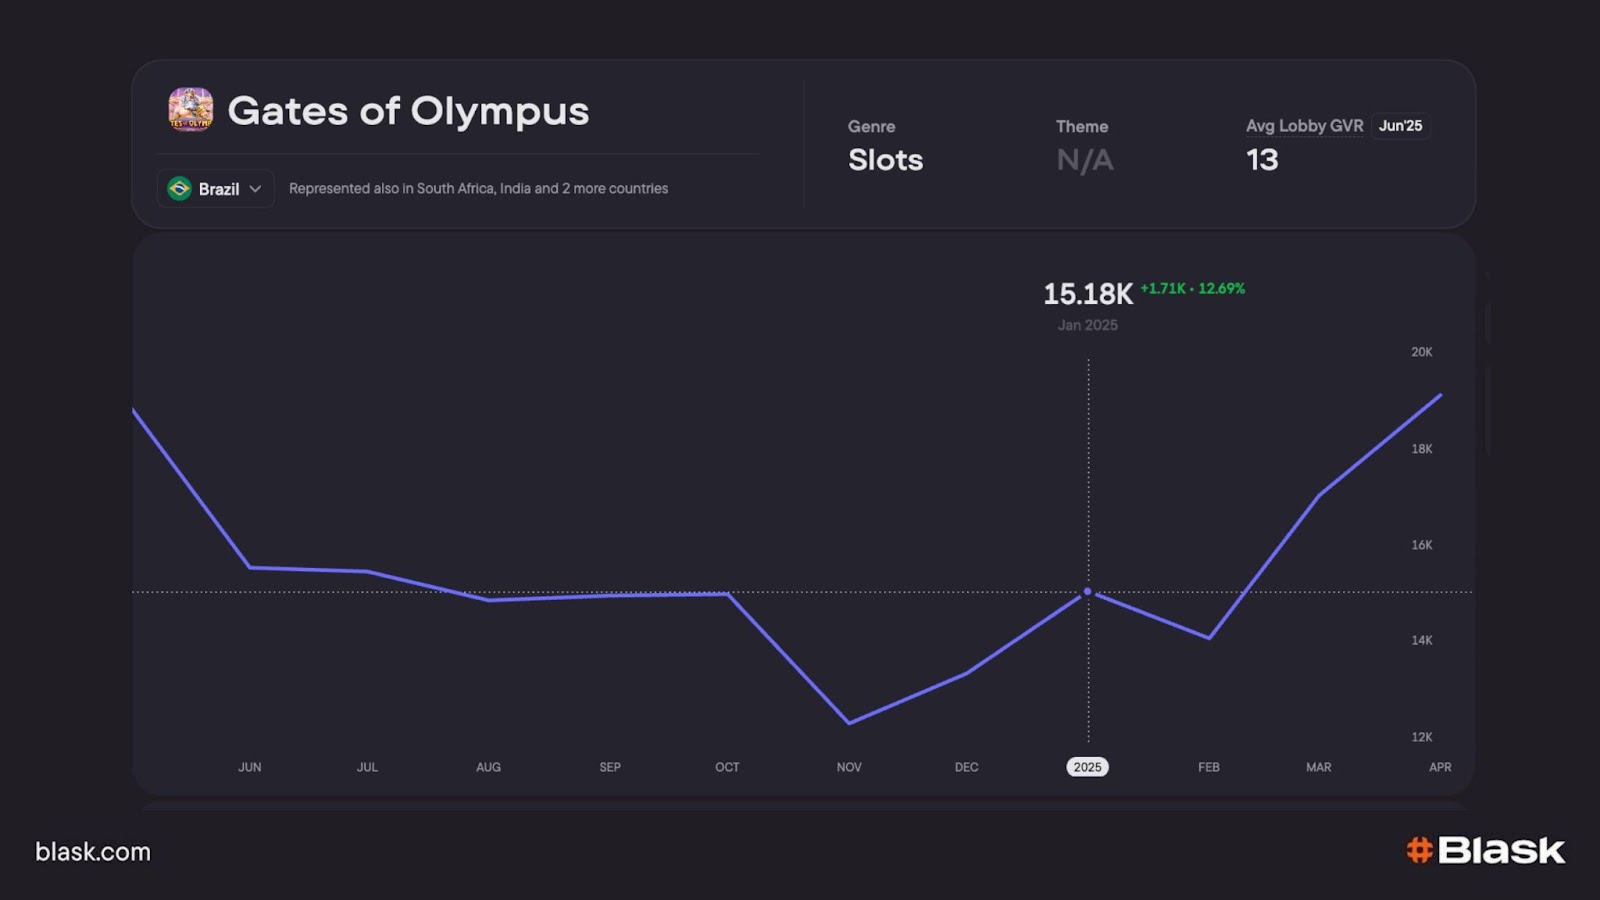
Header — the thumbnail resume.
Right at the top a compact card shows the game’s icon, name, current country (with quick-swap drop-down), genre, theme and its Average Lobby GVR for the latest month. A sub-line lists every other market where the title is already monitored, inviting fast cross-border hops.
📌 Why it matters: in one glance you know what the game is, how operators label it, and whether it usually sits near the front row.
🔍 Explore: Quick tour – the countries view in Blask Games
Blask Index — demand in raw numbers.
First up is a dashboard charting the game’s Blask Index: our proxy for absolute player interest. The default span is twelve months, but a tiny menu flips to one or three months, an all-time view, or any custom period you prefer.
Dots can represent days or months, and you can hide the grey Other band with the Relative values switch when you want to minus all other brands except the chosen ones.
Hover a point to pin the exact value; the path immediately shows whether curiosity is rising, cooling or spiking round promos.
📊 Understand: How Blask calculates player interest for casino games
Share of Interest — demand as a slice of the pie.
Just below, the same timeframe becomes a bar where each column shows the game’s percentage of all searches that month. It is the quickest way to see if a rival is eating your share or if a dormant title is quietly gaining ground.
Controls mirror the Blask Index widget so exploration feels second-nature.
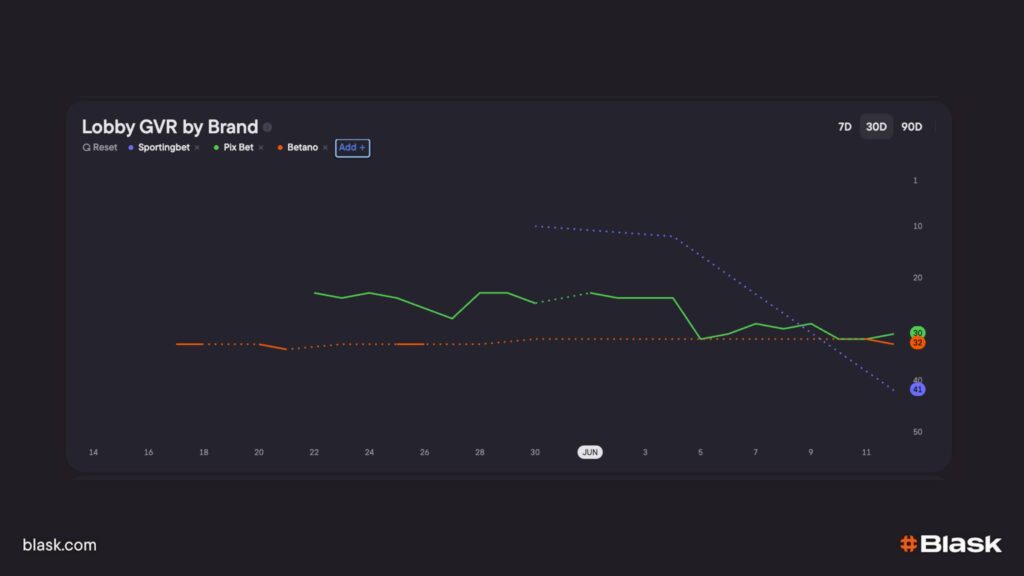
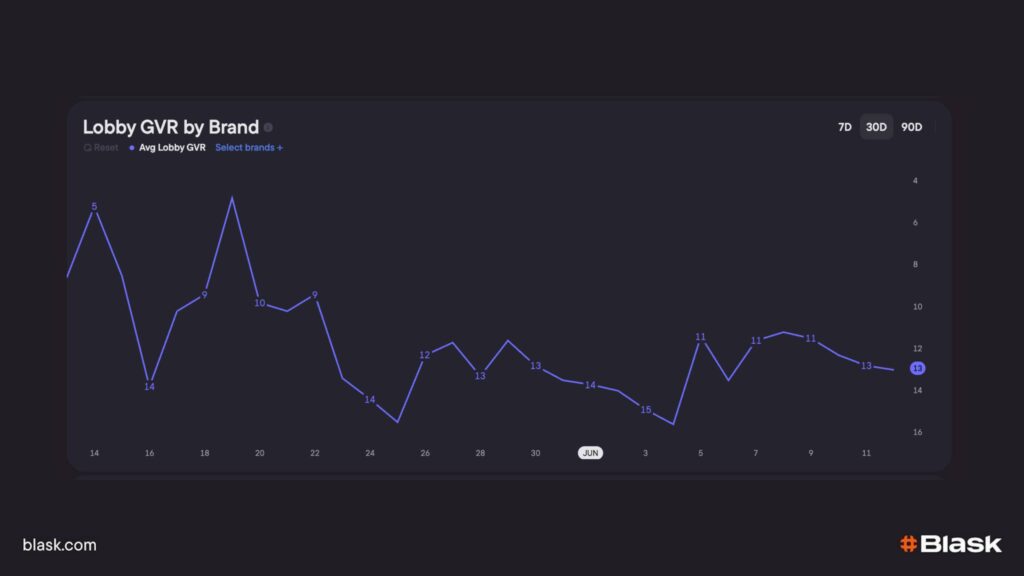
Lobby GVR by brand — who gives you the front row.
Next comes a dotted line that traces the game’s Average Lobby GVR brand by brand. Beneath the legend you can tick or untick operators, instantly adding or removing their traces. A mini range picker (7 / 30 / 90 days) lets you zoom from weekly promo bumps to quarter-long trends
Watching the curve flatten or spike tells you exactly when an operator pushed the game higher — or let it slide.
📌 Dive into: Inside Blask’s lobby‑position engine
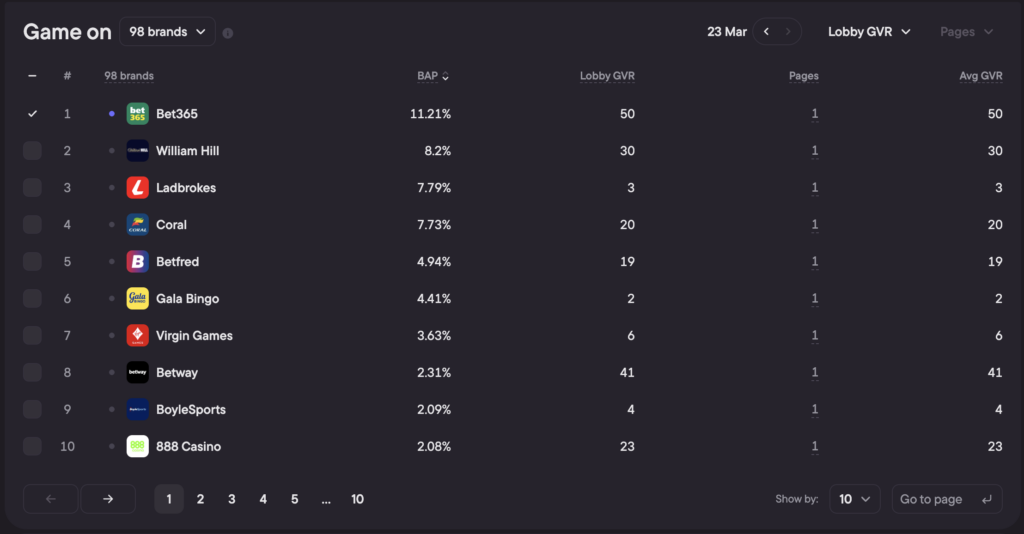
Brand table — the operator drill-down
Every datapoint that feeds the line is laid bare in a paginated table. A date selector lets you pick any past day to review historical placements. Columns:
- BAP — brand’s accumulated power in selected country.
- Lobby GVR — seat the game holds in each lobby today (lower is better).
- Pages — how many casino sections feature it.
- Avg GVR — means position across every page where it appears.
A toggle hides non-lobby pages when you care only about the home screen.
🚀 Discover: 30 Ways Blask Games empowers iGaming professionals
Custom layout
Each widget carries a little ⬍ drag handle and ▾ chevron.
Shuffle blocks up or down, fold the ones you rarely use, build a workspace that echoes your workflow. The layout is stored locally, so tomorrow’s session opens exactly as you left it.
Where to next?
If the Countries view tells you where a genre is hot, the Game view reveals why one title outperforms its peers and who is giving it prime real estate.