- Updated:
- Published:
From hours to years: how data granularity impacts decision-making in iGaming
In iGaming, data granularity is key to decision-making. Blask provides hourly to yearly data, offering insights into player behavior and market trends. Hourly data shows real-time impacts, while daily and monthly data reveal longer trends.
In the fast-paced world of iGaming, the level of granularity in data directly influences decisions and strategic planning.
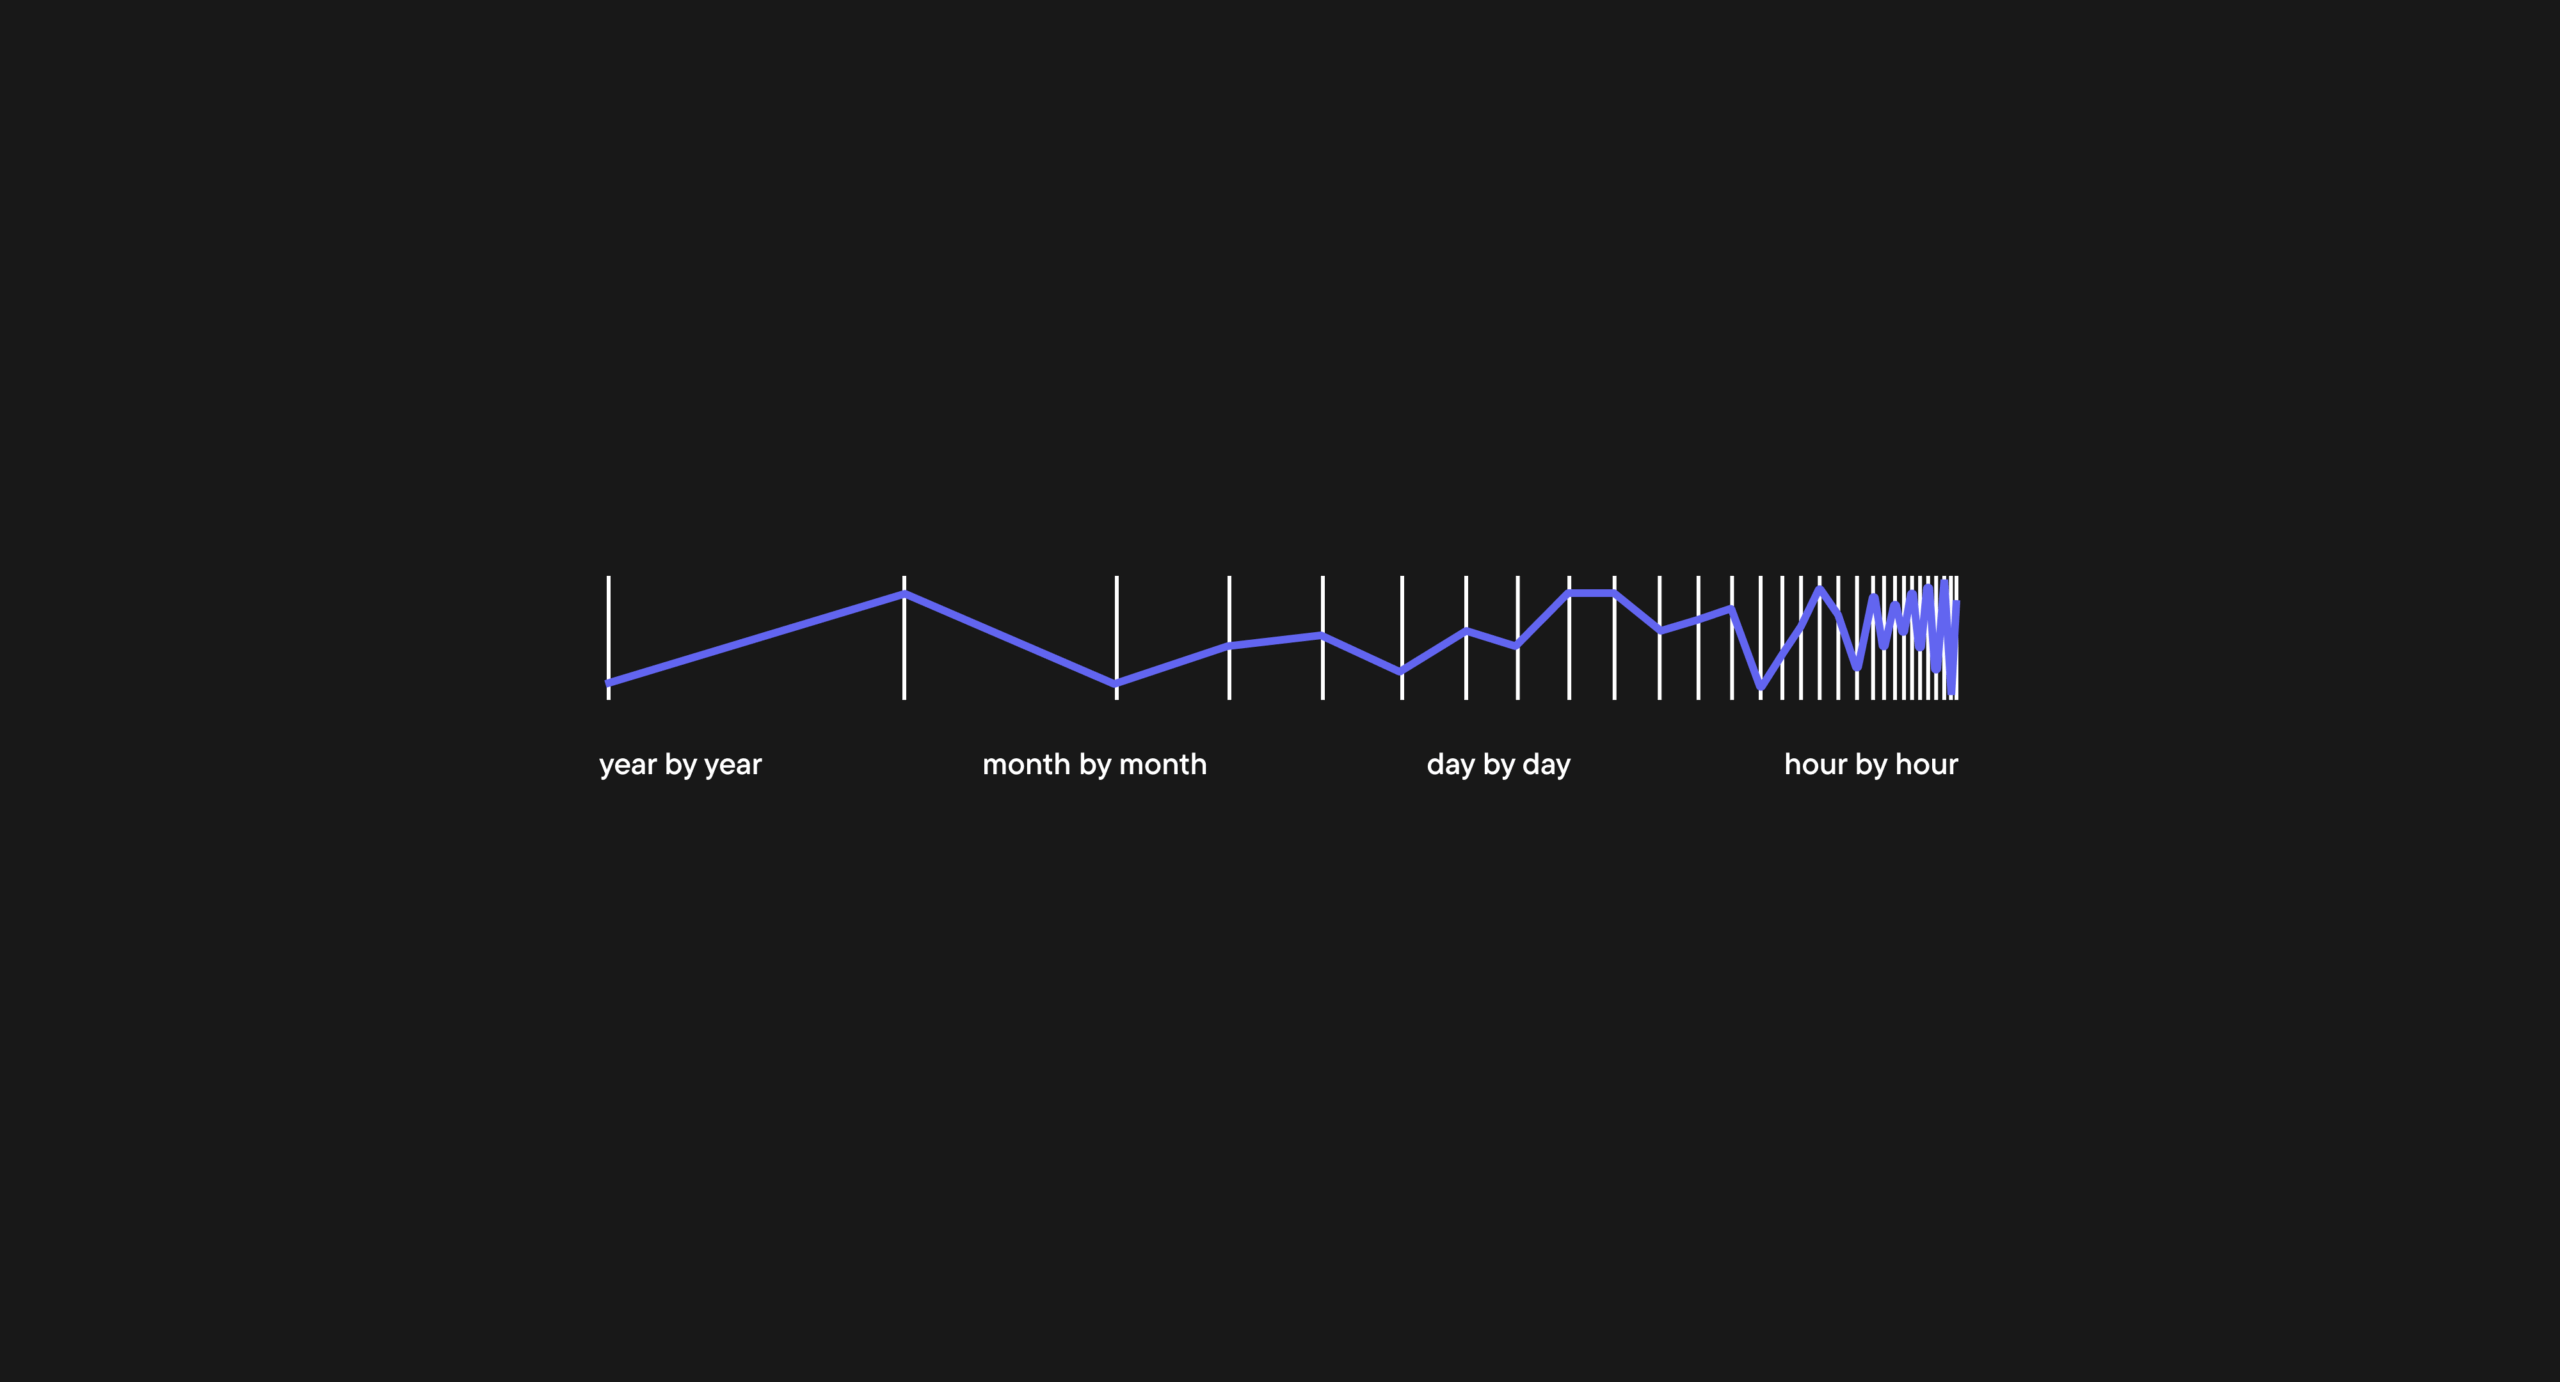
At Blask, we offer data from hourly updates to yearly summaries, and even comprehensive data covering the entire lifespan of a brand. Let’s see how looking at different time scales can impact decision-making in this industry.
The pulse of iGaming trends.
Blask tracks even the smallest market fluctuations with hourly data, providing the most detailed view of player behavior and market trends. This level of granularity allows you to analyze the impact of various events on both brand growth and the iGaming market as a whole, without delays.
Hourly granularity offers two main paths:
- Monitor the impact of events on the industry almost in real time.
- Thoroughly analyze the impact of past events and identify patterns.
Track player behavior patterns and peak playing hours.
With hourly granularity of data, you can analyze and study player actions in detail.
💡 Important note! Blask generates charts based on the UTC+0 time zone. Keep this in mind when viewing graphs with hourly granularity.
❗India uses the IST (Indian Standard Time) timezone which is equivalent to UTC+5:30.
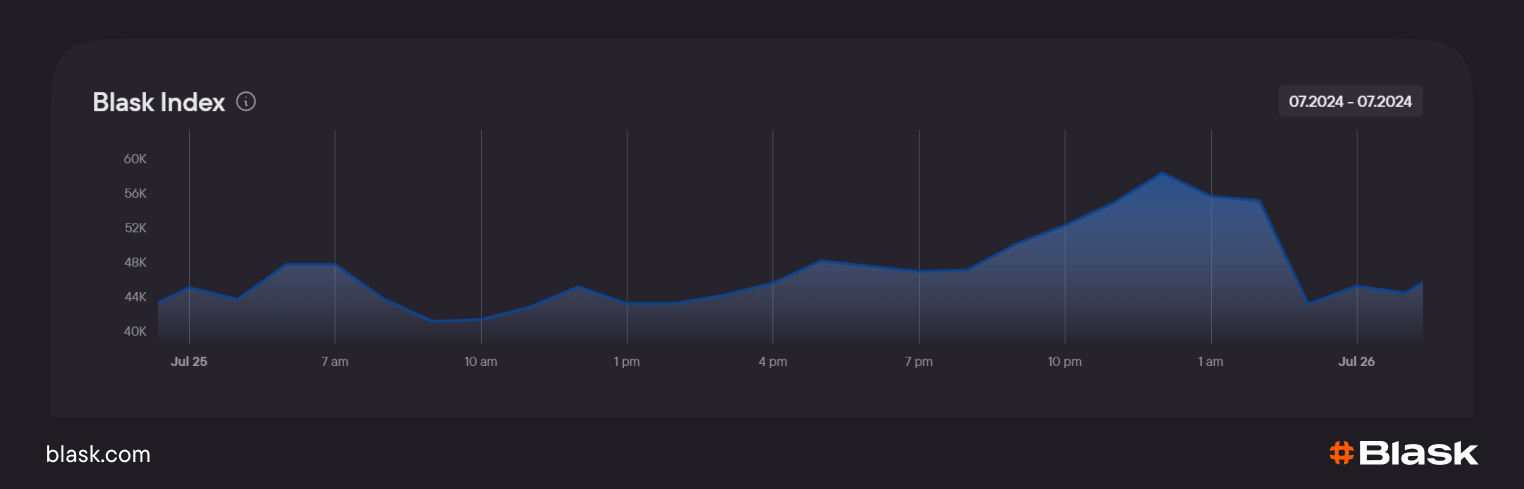
For example, the screenshot above shows that in India interest in iGaming entertainment increases at 11:30AM-12:30PM IST (6-7AM UTC+0) and 1:30-7:30AM IST (8PM-2AM UTC+0). So, at noon and during the night.
Analyze the real-time impact of specific events.
During major sporting events, players are more active in placing bets, and brands rapidly attract new audiences. With Blask’s hourly data, you can analyze the impact of events on the industry in real time.
🔥 If something happens, Blask will show you the effects of that event within an hour.
Balance between detail and trends.
Data with daily granularity is highly valuable for analyzing the long-term impact of advertising campaigns and events in the industry. Daily breakdowns enable accurate identification of trends within weeks and months.
Identify weekly and monthly trends.
When you see a chart broken down by days, you can track specific patterns over the course of a week or month.
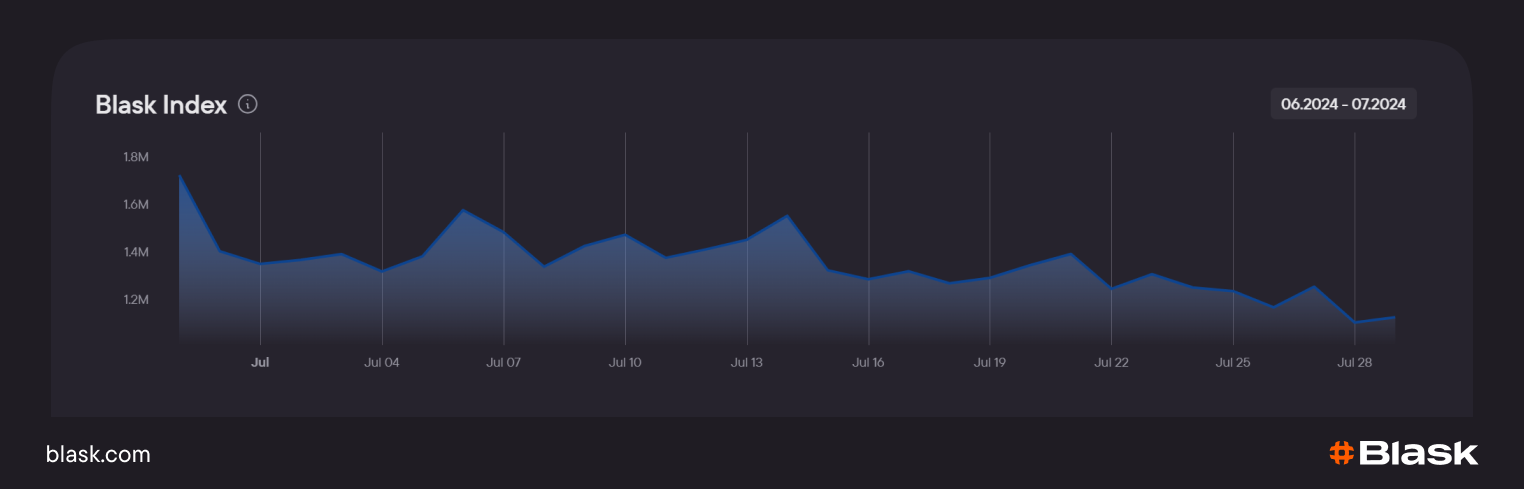
In this example, we can clearly see spikes in player interest in betting and gambling. Interestingly, these peaks occur on weekends, followed by a sharp decline on Monday and Tuesday.
💡 By combining these observations with the previous chart’s hourly data, we can conclude that people are most inclined toward iGaming activities in the evenings on weekends.
What should you do with this data? Turn circumstances into your superpower! If people are reluctant to place bets on Mondays, offer them bonuses or increased odds on those days.
Track the short-term impact of events on the iGaming industry.
When an event occurs, it’s important to examine not only its immediate impact but also how it persists over time.
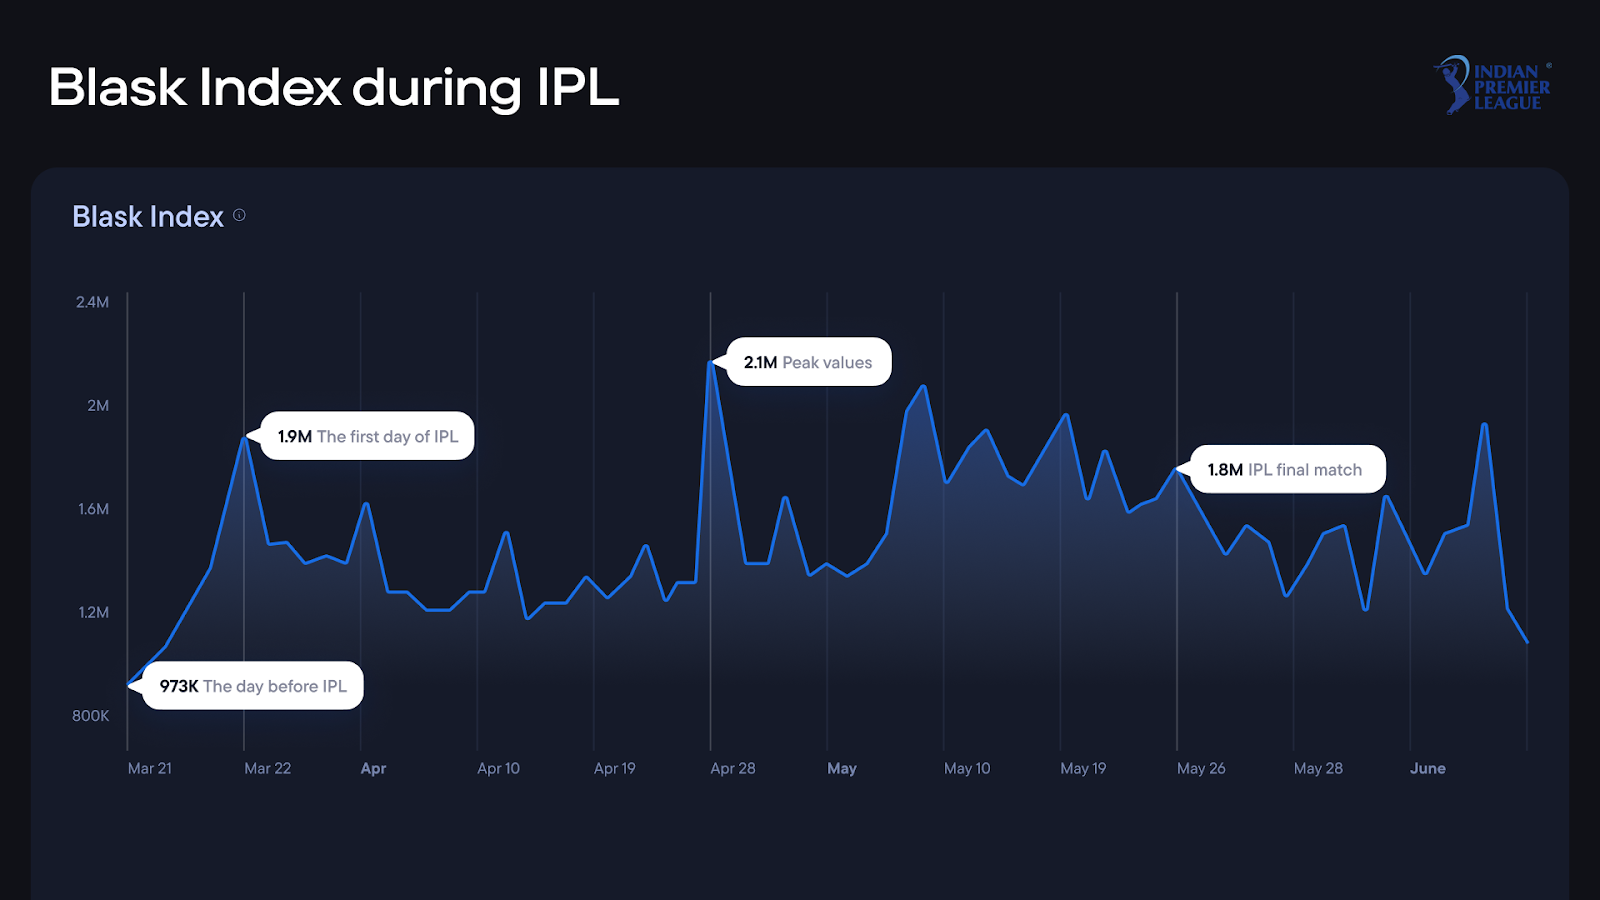
For example, the Blask team analyzed the effect of IPL 2024 in India on interest in the iGaming industry. We found that interest surged significantly during the event, but a few days later, it returned to more or less normal levels.
Seasonal patterns and long-term effect.
When it comes to weekly or monthly granularity, you gain the opportunity to track the long-term impact of events and actions on your brand and the industry.
- Did you sponsor a successful sports team? Blask Index will show a sustained increase in your brand’s metrics over several months.
- Has the government relaxed market regulations? Observe the steady growth of the iGaming industry in the country over the months.
- Are you anticipating a sporting competition? Analyze the impact of similar past events to prepare your marketing strategy for the upcoming occasion.
Find the best months for promotional campaigns.
Discover seasonality and adjust your marketing activities accordingly. Prepare in advance for peak activity periods or save your resources for a major advertising push during a specific event.
The data indicates that there are two consistent peaks of interest in online betting and gambling in India: April and October. Blask’s role is to provide you with the numbers, and yours is to correlate this data with events and activities.
Plan releases and launches.
Your new game or product can gain a boost in popularity if its release coincides with a time when the most players are engaged in entertainment. The more players experience your offering, the greater the potential for word-of-mouth promotion.
Use Blask’s monthly granularity to keep your finger on the pulse of all long-term trends in the iGaming industry. It’s like having a crystal ball, but better — because it’s backed by hard data.
Strategic plans for the future.
Quarterly and yearly data provide a big-picture view of the market and a brand’s position within it.
At this stage, you have the opportunity to track the market’s status throughout its entire existence and assess its viability.
Assess the market health.
Is It a Gold Rush or a Ghost Town?
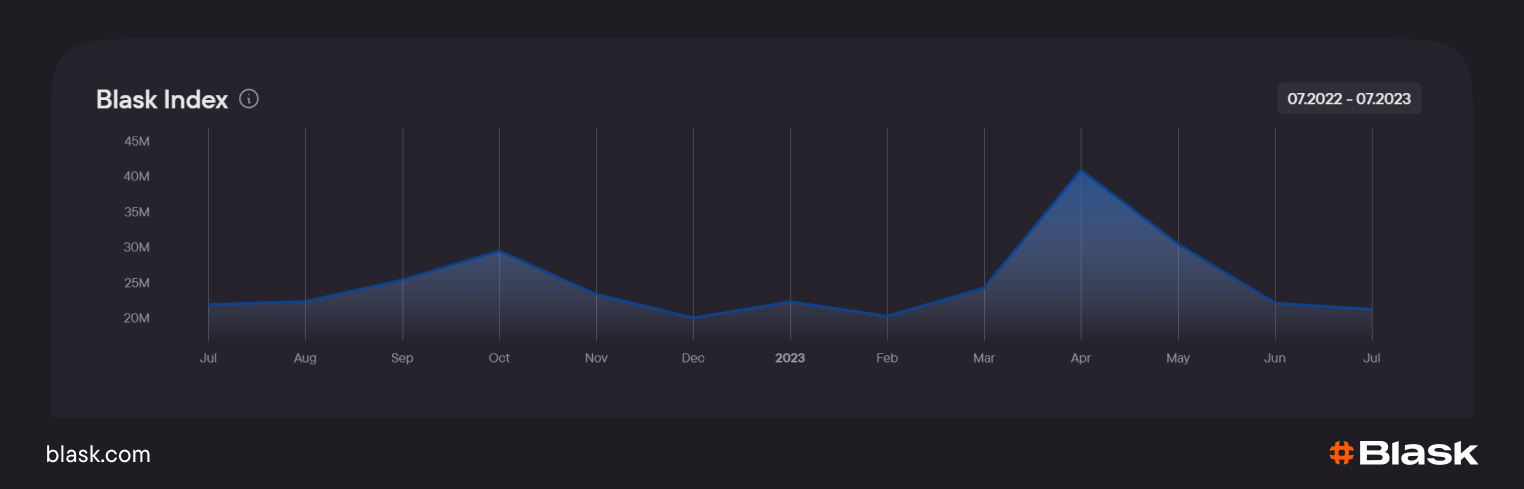
Before you dive headfirst into a new country’s market, you need to know if you’re jumping into a thriving ecosystem or a digital ghost town. Here’s where Blask Index allows you to thoroughly examine the overall market size as well as the sizes of your competitors.
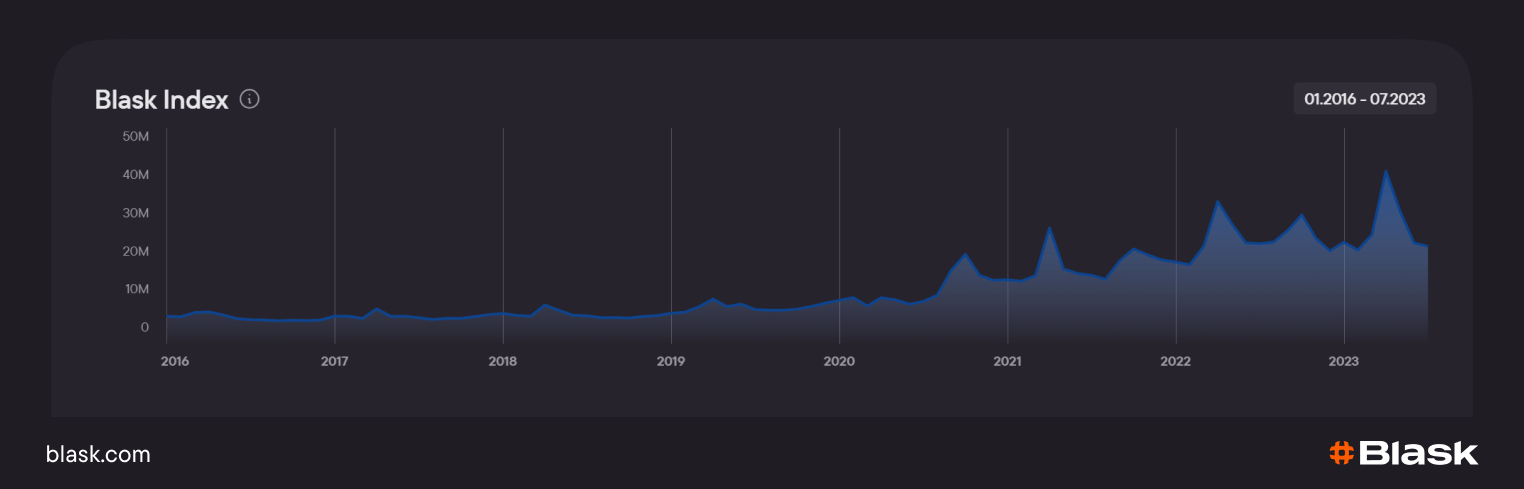
Blask Index, with annual granularity, provides a detailed picture of the market’s health. It clearly reveals the long-term trend: decline, stagnation, or rapid growth. Over the course of a year, the peaks caused by news, sporting events, and market regulation laws are smoothed out—you see established data that allows you to make informed and calm decisions rather than succumbing to panic or hype.
Examine the brand’s mistakes and achievements.
Track the brand’s positions over the long term to determine:
- growth or decline in absolute values;
- growth or decline in relative values;
- fluctuations in market share that reflect correct or erroneous actions taken by management.
Cross-reference data from Blask with all market events, the brand’s marketing activities, and changes in legislation to assess the brand’s prospects. Suddenly, you’re not just looking at numbers — you’re seeing the story of the brand unfold.
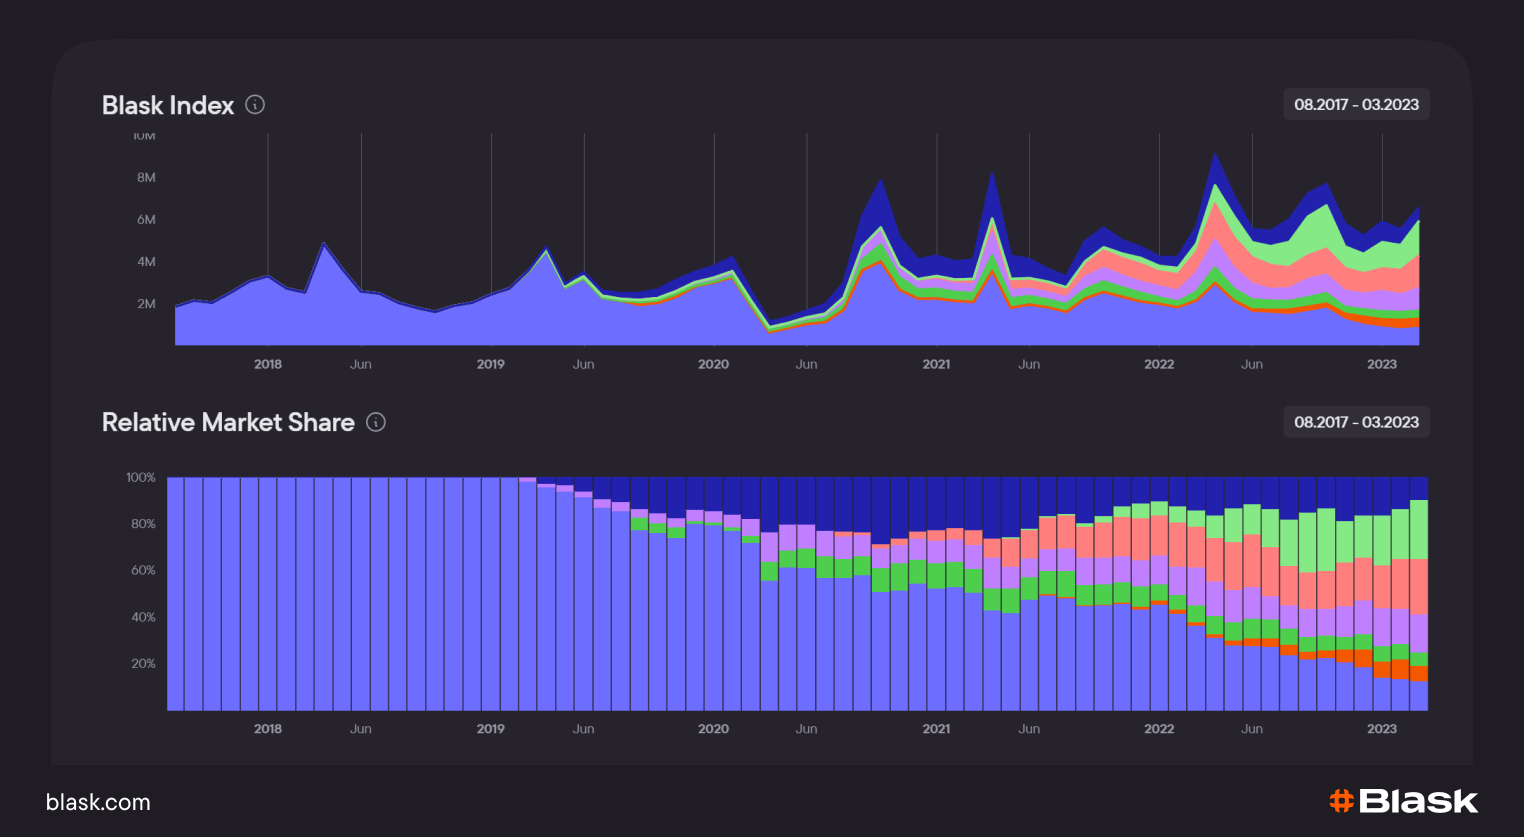
Some brands have been pioneers, while others have emerged more recently but have already made a strong impact. Observing the fluctuations in brand shares is fascinating, as it provides insights that can help you achieve your own success.
What to do at any of these stages?
Track, analyze, and compare!
Blask isn’t just a tool — it’s your Swiss Army knife for market analysis in the iGaming jungle. We’re talking about the ability to switch between different levels of data granularity faster than a Vegas dealer shuffles cards.
💡 Combine the advantages and disadvantages of each level of data granularity to gain a 360-degree view of the situation and make data-driven decisions.
If you’re promoting your brand, Blask will enable you to comprehensively evaluate its effectiveness. With Blask, you’re not just throwing darts in the dark — you’re launching precision strikes.
- Track the immediate impact on an hourly chart. Additionally, analyze your competitors’ charts to eliminate the influence of daily trends and focus solely on your growth.
- Assess effectiveness using a daily chart. It’s important not only to attract new players but also to retain them within your brand to prevent them from moving to competitors.
- Examine the long-term effect on a monthly chart. It would be beneficial to see clear brand growth in both absolute and relative terms.
By using Blask’s detailed data approach, iGaming operators can make smarter choices that balance short-term needs with long-term goals. Whether you’re fine-tuning promotions every hour or planning for growth over the next year, having the right level of data detail is essential for staying competitive in the fast-paced iGaming industry.