
Blask is an iGaming market intelligence platform that measures brand demand, competitive position, acquisition benchmarks, revenue baselines and game performance.
As of 4 September 2026, Blask data covers 5 474 iGaming brands across 139 countries and 41 983 casino games. The platform turns fragmented search, regulatory, financial and product-distribution data into comparable market and brand views.
What Blask does
Blask provides an external view of iGaming markets. Operators, affiliates, suppliers, investors and analysts can use the same framework to examine market demand, compare brands and follow changes over time.
The platform has three main analytical layers:
- Market intelligence tracks demand, brand rankings, licence segments and market movement.
- Brand intelligence compares the position, acquisition benchmark and revenue baseline of individual operators.
- Games intelligence tracks game demand, distribution and placement across operator pages and lobbies.
Blask data does not replace an operator’s BI stack. It provides a market-level reference point where internal data covers only one business and regulatory reporting may arrive later or exclude offshore demand.
The Blask metric pipeline
The four current brand metrics form a pipeline:
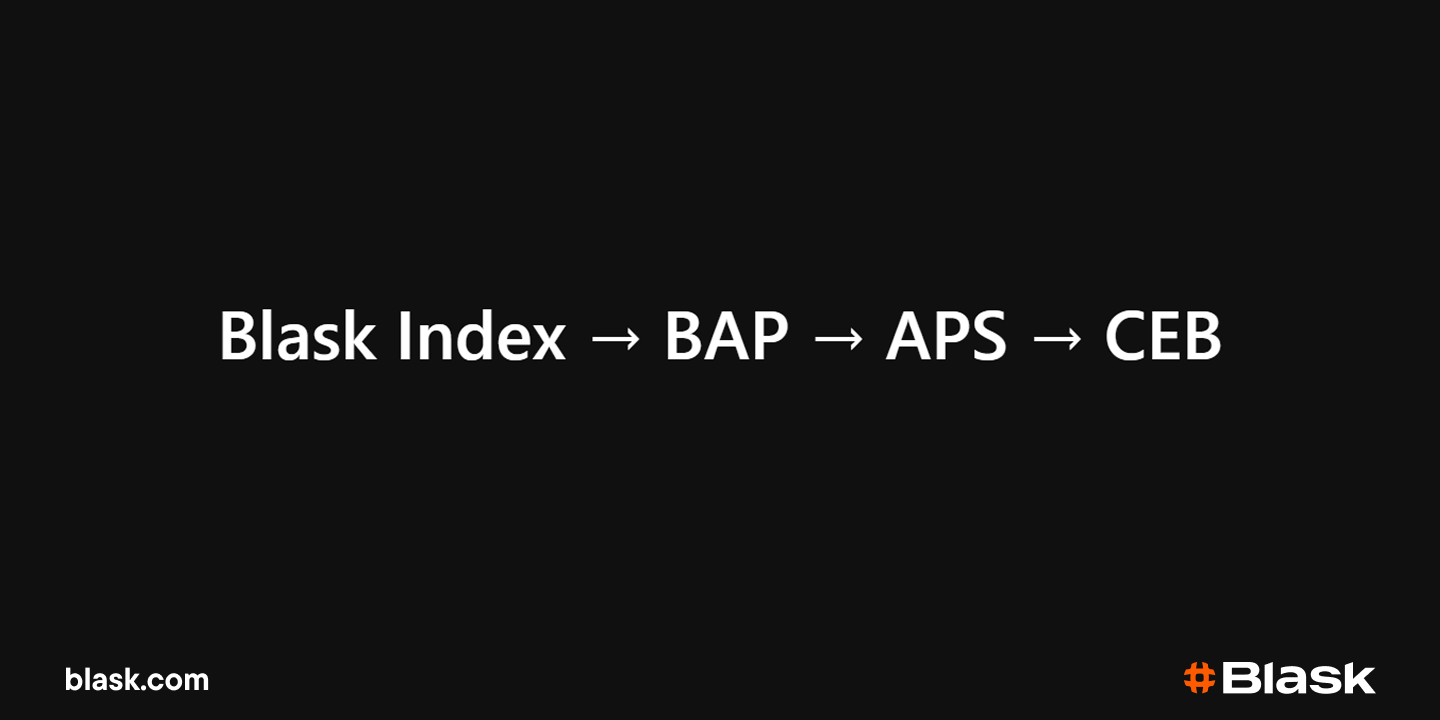
Each stage answers a different question and adds information to the previous one.
Blask Index measures demand
Blask Index is an indicator of search demand for an iGaming brand or market. Blask builds it from geo-tagged search data after filtering intent, joining brand-name variations, recollecting adjusted source periods and accounting for seasonality.
The Index can be viewed at hourly, daily and monthly granularity. It is not GGR, revenue, website traffic or raw Google Trends data. The dedicated Blask Index explainer shows how the underlying share-of-search method becomes an iGaming demand signal.
BAP measures a brand’s share of demand
Brand’s Accumulated Power, or BAP, is the percentage of a market’s Blask Index held by one brand in a country and period.
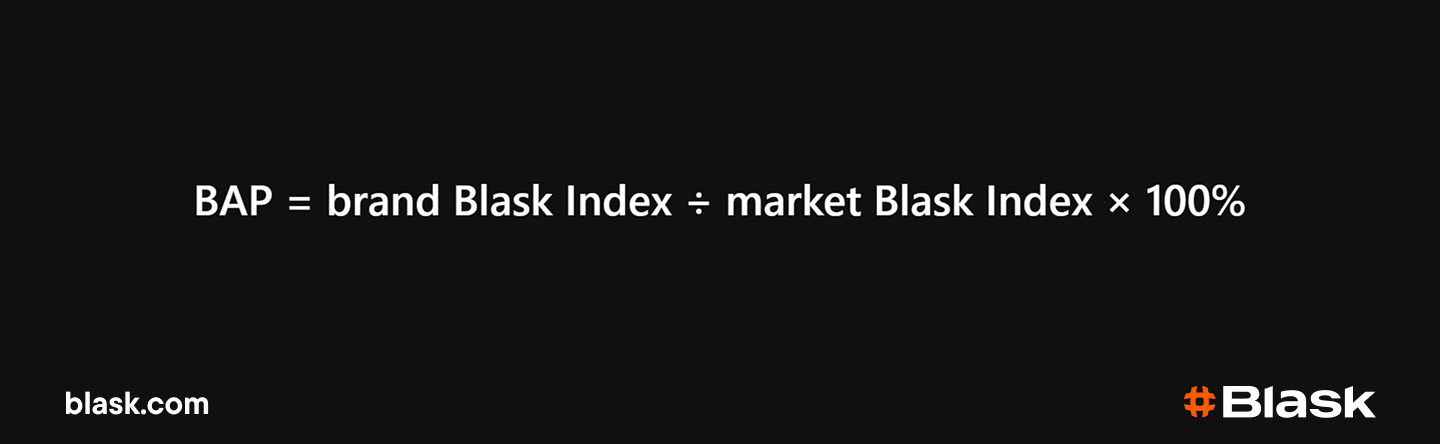
A brand with 10% BAP accounts for 10% of the tracked brand demand in that market. BAP is not market share by GGR or NGR.
APS benchmarks potential new customers
Acquisition Power Score, or APS, estimates how many new customers a brand should attract from its demand position and market conditions. Blask presents APS as a minimum, average and maximum range because conversion conditions differ by market and period.
Please note that APS is not a reported FTD count!An operator’s actual acquisition data may sit inside or outside the range because product, conversion, channel mix and customer definitions differ.
CEB benchmarks revenue
Competitive Earning Baseline, or CEB, estimates the revenue a brand should capture from its BAP, APS and competitive context. It is also presented as a minimum, average and maximum range.
CEB is not operator-reported GGR, a P&L line or an official regulatory total. In regulated markets, Blask uses verified regulator data to calibrate local-brand estimates. International and unregulated brands require behavioural signals and regional ARPU benchmarks because equivalent disclosures are often unavailable.
| The relationship between the two commercial benchmarks is covered in What APS and CEB mean in iGaming. |
Blask data snapshot: UK demand in H1 2026
The United Kingdom provides a current published example of the demand layer. Total UK Blask Index grew 5.3% year over year in H1 2026, while Bet365 replaced William Hill as the market’s BAP leader.
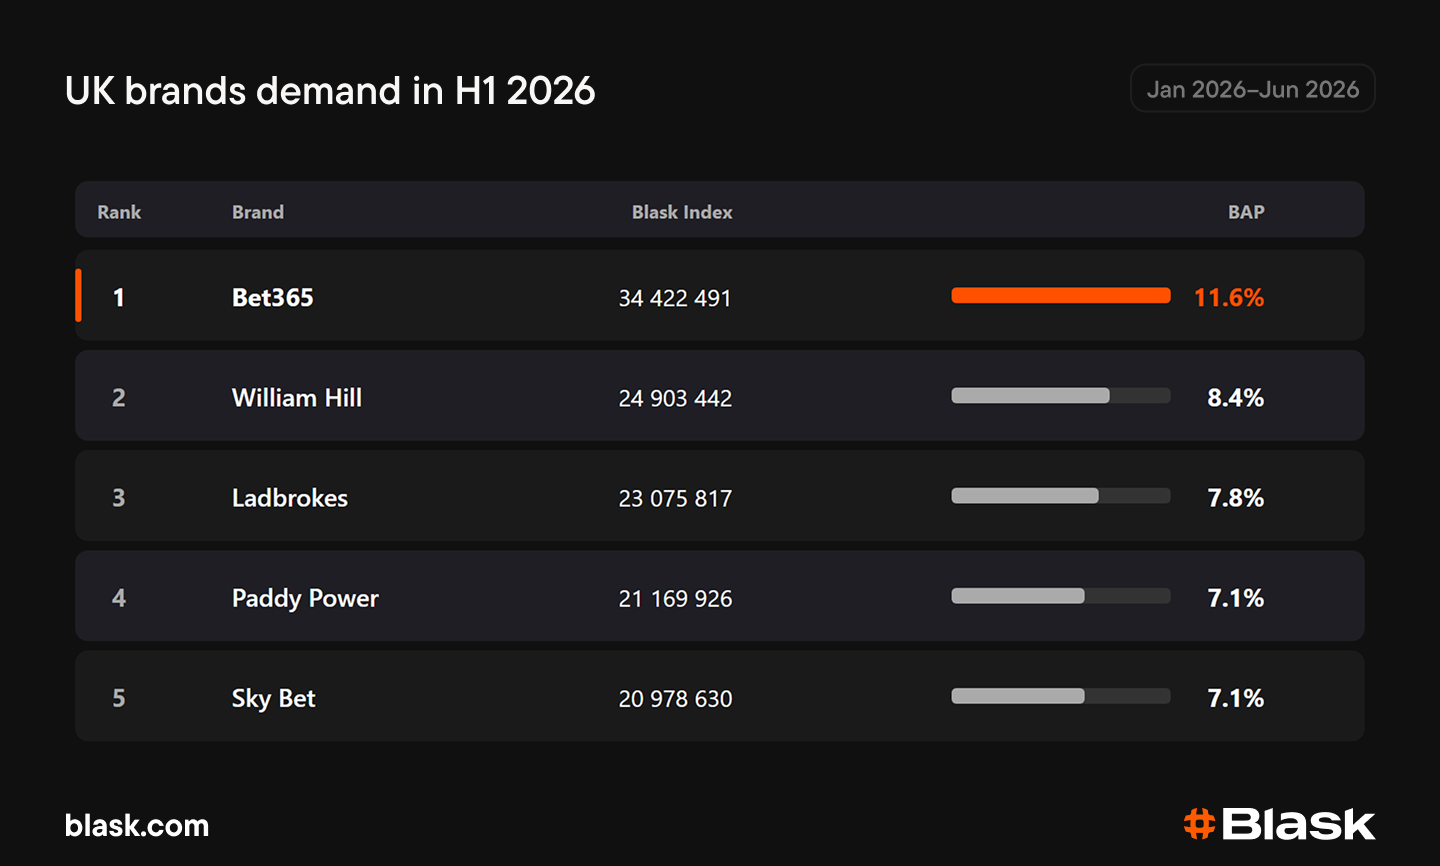
The market grew, but that growth was not distributed evenly. William Hill lost 3.5 percentage points of BAP, while Bet365 took first place with 11.6%. Blask Index establishes the level and direction of demand; BAP reveals the change in competitive position inside it.
The full UK H1 2026 analysis adds licence and CEB context. The global iGaming brand ranking shows why a wide country footprint and a high revenue baseline are separate questions.
How Blask measures game performance
Games intelligence is separate from the brand metric pipeline. It combines search demand with daily scans of operator pages and lobbies.
- Share of Interest (SoI) measures each game’s share of search attention in a market.
- Game Visibility Rank (GVR) records how prominently a title appears across operator lobbies.
- Provider Content Share measures how much page space belongs to a provider’s catalogue.
- Game country analytics shows how widely a title is distributed across brands and page types.
Demand and lobby placement provide two parallel views. A searched game may not lead on distribution, while a widely listed title may attract less search attention. Neither result alone explains player behaviour or game revenue.
Where Blask data comes from
Blask combines Google Keyword Planner and Google Trends with public regulatory disclosures, gambling commission reports, operator filings, third-party cohort and ARPU research, and proprietary modelling.
The calculation path changes with the available evidence. Local brands in regulated markets can be calibrated against regulator data. International brands and unregulated markets rely more heavily on demand, acquisition and regional value benchmarks. Blask documents these paths in How Blask measures.
What Blask data is not
Blask is market intelligence, not financial reporting. Its metrics do not represent:
- Official regulatory reporting.
- Operator-reported financial statements.
- A substitute for licensed disclosures.
- A brand’s internal P&L, FTD count or website analytics.
Differences between Blask and an operator or regulator are expected because the sources answer different questions. Regulatory data records completed activity within a defined licensed perimeter. Blask measures demand and benchmarks the commercial position associated with it.
FAQ
What is Blask?
Blask is an iGaming market intelligence platform. It measures brand and market demand, competitive share, acquisition benchmarks, revenue baselines, and casino game demand and distribution.
How many countries, brands and games does Blask cover?
First-party Blask APIs returned 139 countries, 5 474 brands and 41 983 games on 4 September 2026. These counts change as new markets, operators and titles enter the tracked datasets.
What is the difference between Blask Index and BAP?
Blask Index measures the level and direction of search demand. BAP expresses one brand’s Blask Index as a percentage of the total Index for a market and period. The Index shows demand movement; BAP shows competitive position.
Are APS and CEB actual customer and revenue figures?
No. APS is a range for potential new customers, not a reported FTD count. CEB is a revenue baseline range, not operator-reported GGR or a P&L figure.
Bottom line
Blask connects four questions that fragmented market data often leaves apart: how much demand exists, who holds it, what acquisition level that position supports and what revenue baseline follows. The UK H1 2026 result shows the sequence in practice — overall demand grew, yet the brand at the top still changed.
Know more. Win more.
Blask turns complex markets into clear strategies.