- Updated:
- Published:
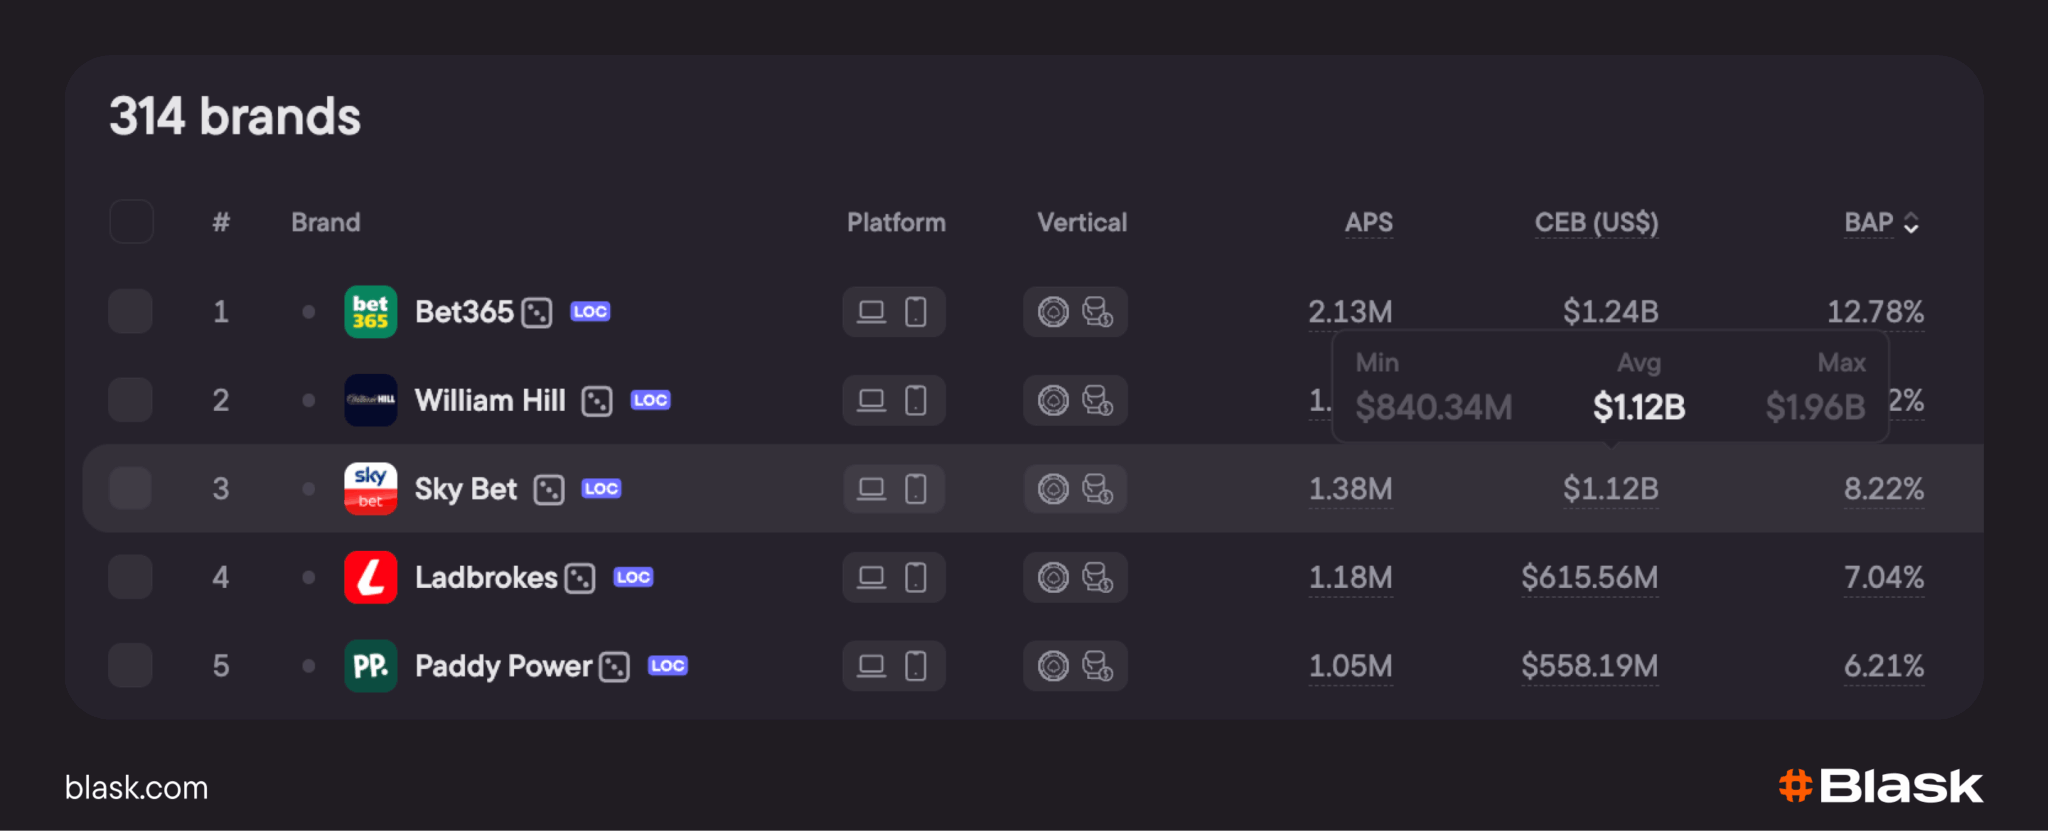
What APS and CEB mean — and how operators use them

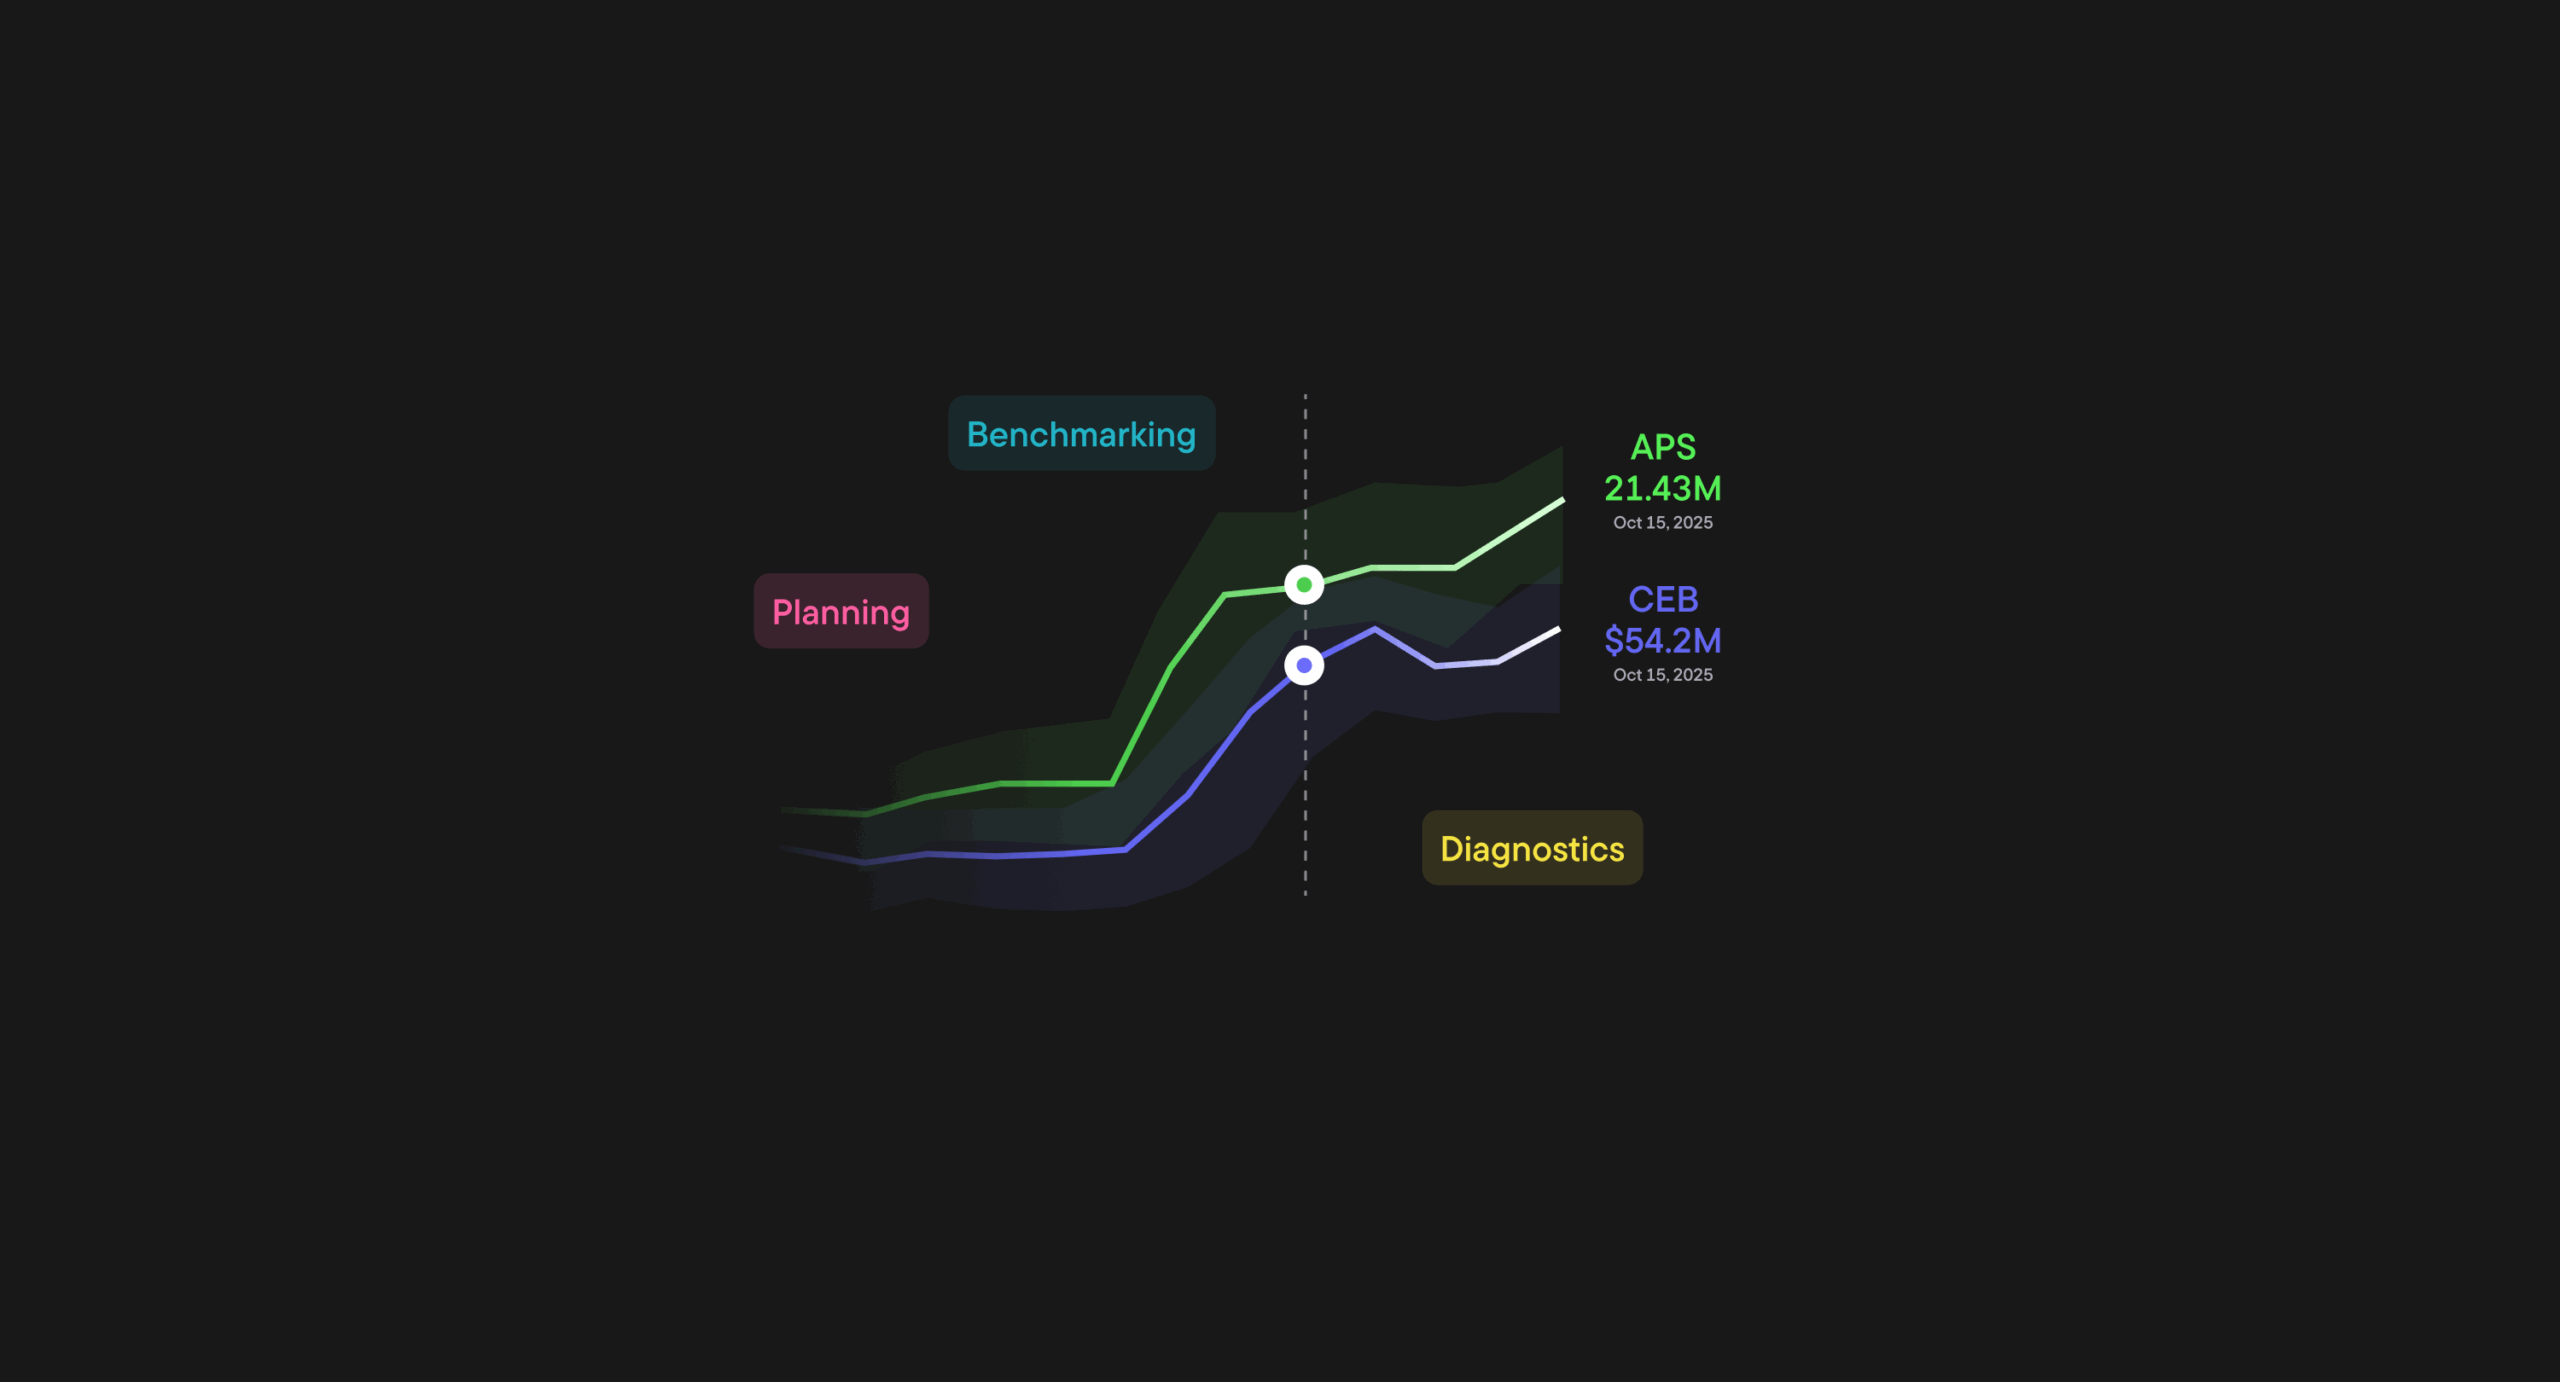
CEB is Blask’s revenue baseline for a brand in a market; APS is its acquisition benchmark. Both measure realistic potential rather than reported results.
The distinction matters because external market benchmarks and internal accounts answer different questions. A finance system records transactions that reached one operator. Blask models the position of every tracked brand in a market, including international operators whose results may never appear in local disclosures.
What does CEB mean?
CEB stands for Competitive Earning Baseline. It estimates the revenue a brand could realistically capture at its current competitive position and expresses the result in US dollars as a minimum, average and maximum range.
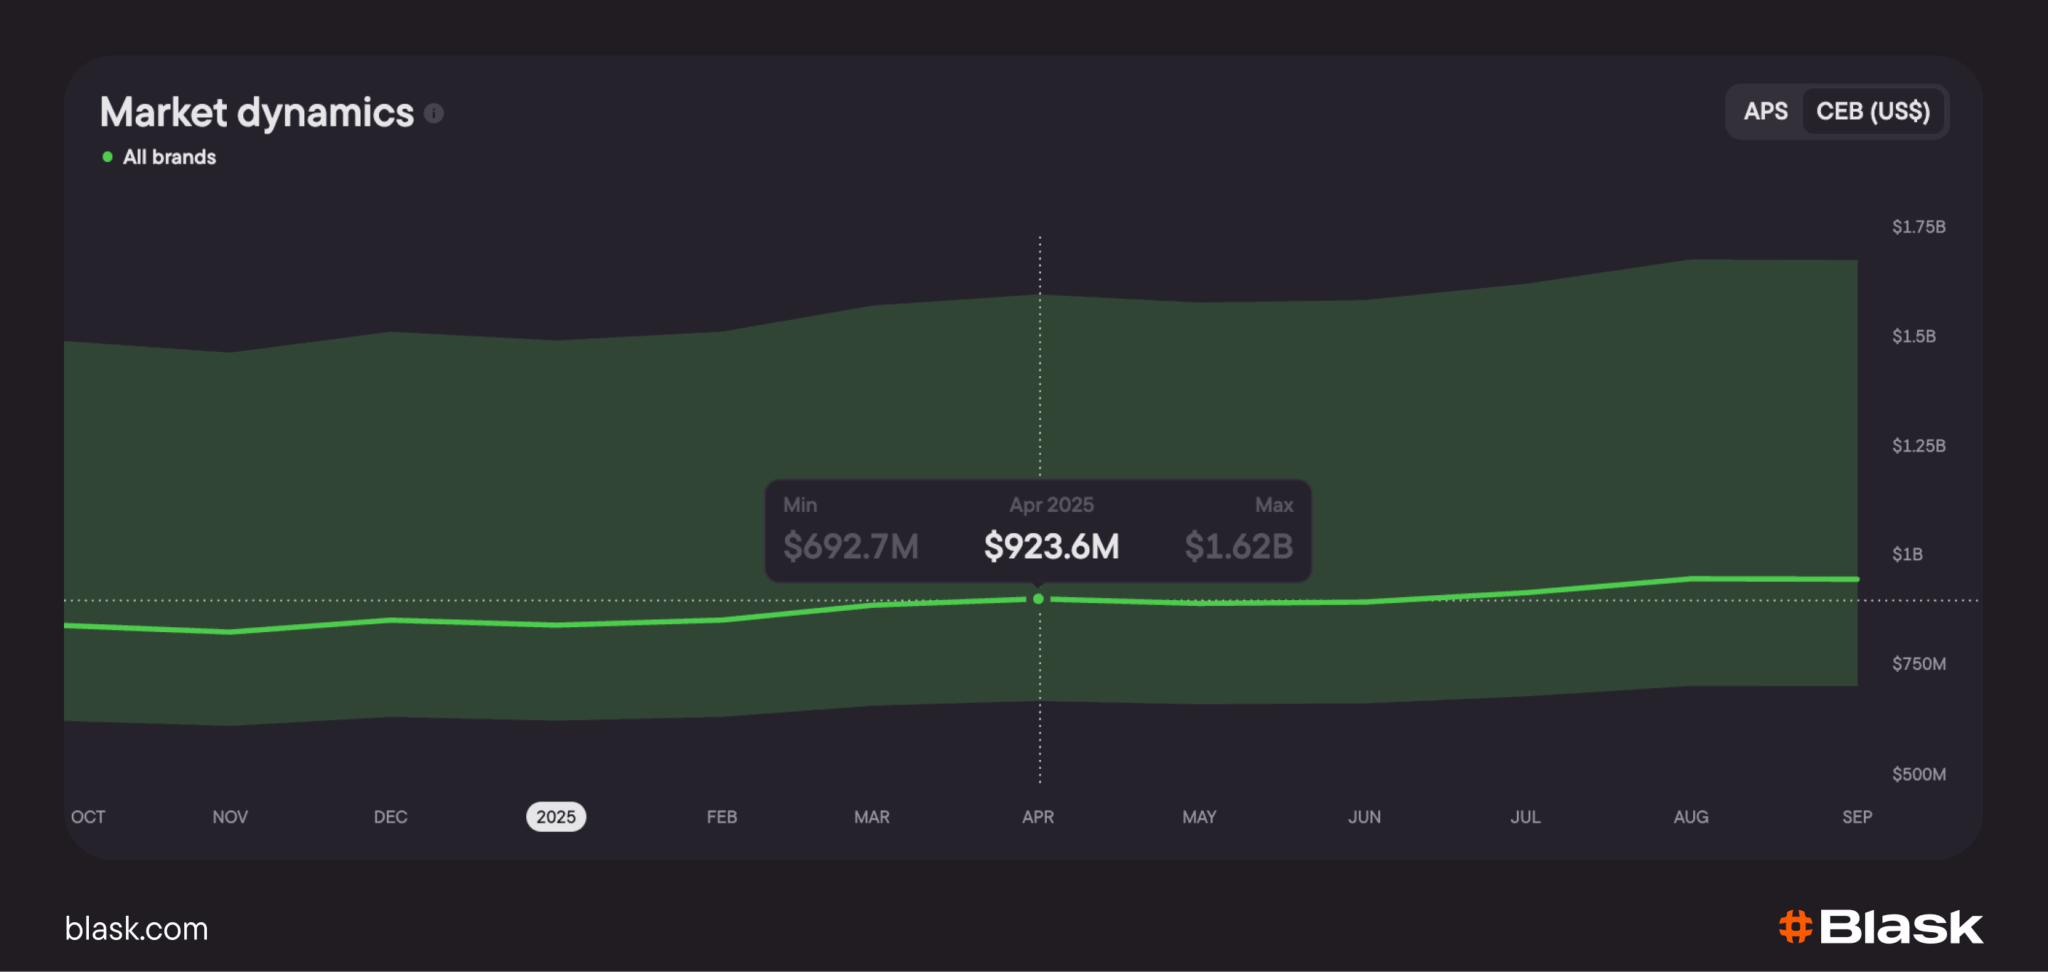
The average is the central baseline. The minimum represents weaker monetisation relative to the brand’s position, while the maximum reflects a stronger outcome in a volatile market. Blask updates the metric monthly for completed periods.
CEB builds on a brand’s share of demand, its Acquisition Power Score and the surrounding competitive context. The calculation path changes with the market:
- Local brands in regulated markets are anchored to verified regulatory GGR, with public operator results used as additional calibration where available.
- International brands rely on demand, acquisition and regional revenue-per-user benchmarks because public financial data is usually unavailable.
- Brands in unregulated markets are assessed through demand and benchmarks from comparable economies.
Those inputs make CEB a market-intelligence measure. It is neither revenue from an operator’s P&L nor an official regulatory total.
What does APS mean?
APS stands for Acquisition Power Score. It estimates how many new customers a brand could attract at its current position and expresses the result as a minimum, average and maximum range.
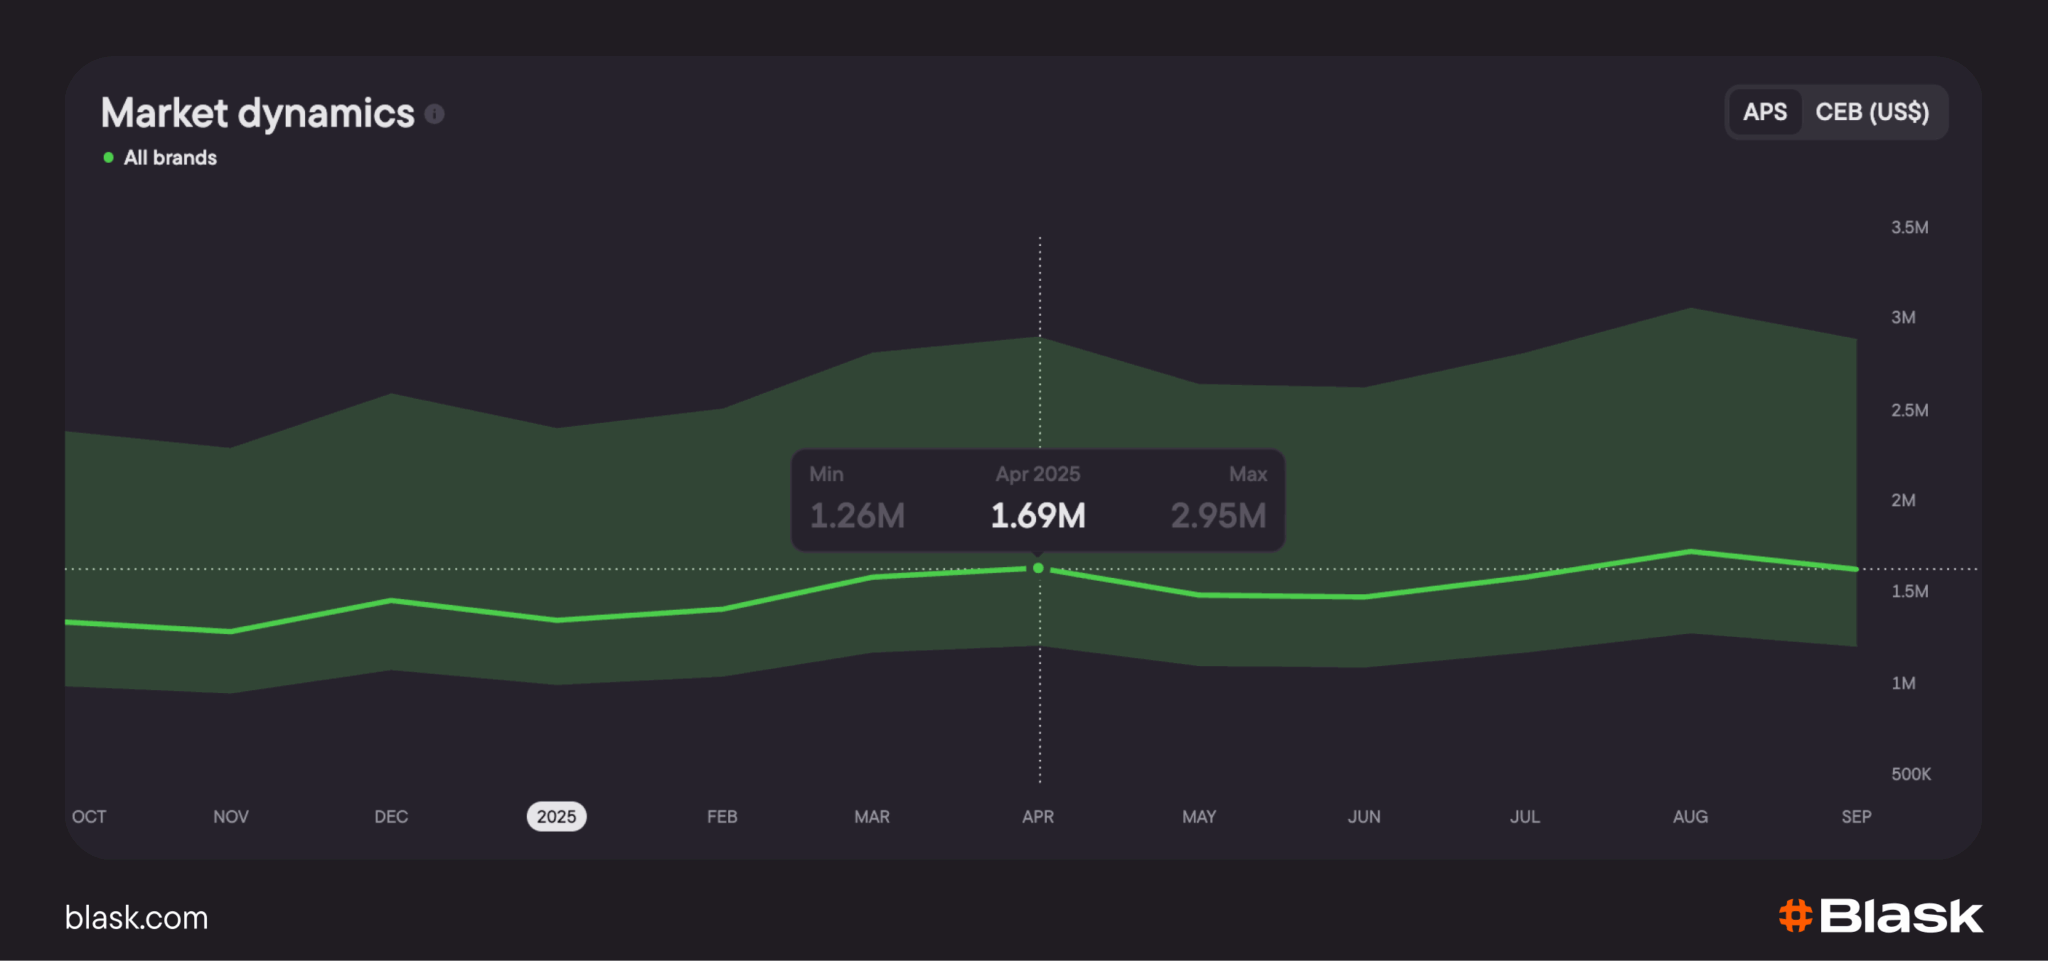
The model starts with Blask Index and the brand’s share of search-based demand. It then applies market-specific factors because the same level of attention does not produce the same acquisition volume in every country.
APS is measured in potential new customers. It does not count deposits, registrations or first-time depositors recorded by an operator. The metric provides an external acquisition baseline for a completed month.
One market, two different baselines
US data for completed H1 2026 shows why APS and CEB cannot be collapsed into one performance score. Average monthly US CEB was $6.78B ($3.94B–$15.28B range), while average monthly APS was 556.0K potential new customers (306.8K–1.30M range).
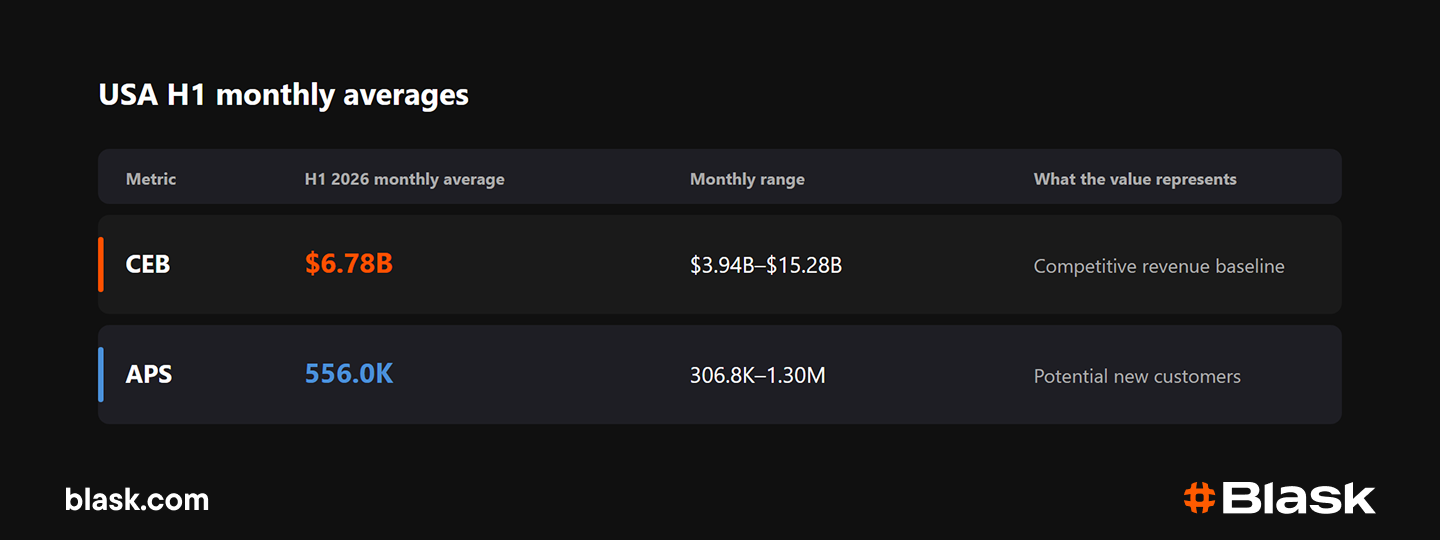
The figures come from the same market position but describe separate stages of performance. APS translates demand into acquisition potential; CEB translates market position and acquisition context into a revenue baseline. Neither figure reports what US operators booked.
CEB vs GGR
Gross Gaming Revenue records stakes minus player winnings under the accounting or regulatory rules used by the reporting entity. It is a completed financial result for a defined operator, product, licence and period.
CEB is modeled across the competitive market. A local brand’s CEB can use regulatory GGR as a calibration input, but the resulting range remains a benchmark. International operators need a different calculation path because their revenue is usually absent from domestic filings.
| Question | GGR | CEB |
|---|---|---|
| What is measured? | Gross win from completed gambling activity | Revenue potential at a competitive position |
| Who supplies the data? | Operator or regulator | Blask model and public calibration inputs |
| What is the output? | Reported value | Minimum, average and maximum range |
| Does it include unreported offshore activity? | Usually no | It can model international brands separately |
A gap between internal GGR and CEB is not automatically a data error. It can reflect conversion, product, retention, player value or a difference in coverage. The two values become comparable only after the brand, market, product, currency and period are aligned.
APS vs FTD
A first-time deposit is a transaction recorded when a player funds an account for the first time. Operators define qualifying rules in their own systems, so an FTD count may exclude duplicate accounts, failed payments, bonus-only activity or deposits below a threshold.
APS does not observe that transaction. It estimates the potential number of new customers supported by the brand’s market position. The older eFTD label is therefore not a current Blask metric: APS replaced a transaction-like name with a benchmark that is explicitly separate from operator reporting.
| Question | FTD | APS |
|---|---|---|
| What is measured? | Recorded first deposits under operator rules | Potential new customers |
| Data source | Operator CRM, payments or BI | Blask demand and market model |
| Output | Actual count | Minimum, average and maximum range |
| Timing | As transactions occur | Monthly for completed periods |
An operator can compare its internal acquisition count with APS after matching the market and period. The comparison indicates whether actual customer acquisition sits below, within or above the external range; it does not identify the cause on its own.
How APS and CEB fit with Blask Index and BAP
Blask separates demand, share, acquisition potential and revenue potential instead of presenting them as one measure.
The sequence begins with Blask Index, which tracks search-based demand. BAP is the percentage of that demand held by one brand in a country and period. APS converts the position into a range of potential new customers, while CEB adds the revenue layer and competitive context.
| Layer | Metric | Core question |
|---|---|---|
| Demand | Blask Index | How is player attention moving? |
| Share | BAP | What percentage of market demand belongs to the brand? |
| Acquisition | APS | How many new customers could that position support? |
| Revenue | CEB | What revenue range could that position support? |
The separation prevents a demand shift from being mistaken for revenue and stops a modeled acquisition baseline from being read as an FTD ledger.
You can think of Blask Index, BAP, APS, and CEB as your market compass.
FAQ
What does CEB mean?
CEB means Competitive Earning Baseline. It is Blask’s monthly estimate of the revenue a brand could realistically capture at its competitive position, shown in US dollars as a minimum, average and maximum range. It is not reported GGR or P&L revenue.
What does APS mean?
APS means Acquisition Power Score. It is Blask’s monthly benchmark for the number of potential new customers supported by a brand’s position in one market, shown as a minimum, average and maximum range. It is not a count of deposits or registrations.
What is the difference between CEB and GGR?
GGR is a completed financial result calculated from stakes minus player winnings under a stated reporting definition. CEB is a modeled competitive revenue range. Regulatory GGR can calibrate CEB for licensed operators, but CEB does not replace operator accounts or regulator reports.
What is the difference between APS and FTD?
FTD records a player’s first qualifying deposit in an operator’s system. APS estimates potential new customers from market demand and competitive position. FTD is an internal transaction count; APS is an external benchmark.
Bottom line
APS and CEB give acquisition and revenue the same external frame without pretending to be an operator’s ledger. Their value lies in the boundary: APS stops before the deposit record, and CEB stops before reported GGR.