- Updated:
- Published:
Share of search in iGaming: measuring brand demand before revenue shows
Share of search measures how much of a market’s total brand search volume belongs to one operator. In iGaming, it predicts market share movements with a 95% correlation — and the signal arrives weeks to months before revenue data does.
Why revenue data comes too late
By the time a monthly financial report lands, the market has moved on.
iGaming operators know this problem. Results come in cycles — quarterly for most publicly traded groups, monthly for platforms that move fast. In between, the market doesn’t pause. Competitors launch campaigns. Affiliates shift traffic. Seasonal peaks open and close. When the data finally arrives, the window to act is already narrowing.
Share of search changes that equation. It draws directly from real user behavior — what players are actively looking for, in real time — and in iGaming, that signal reliably predicts where market share is heading.
What share of search is
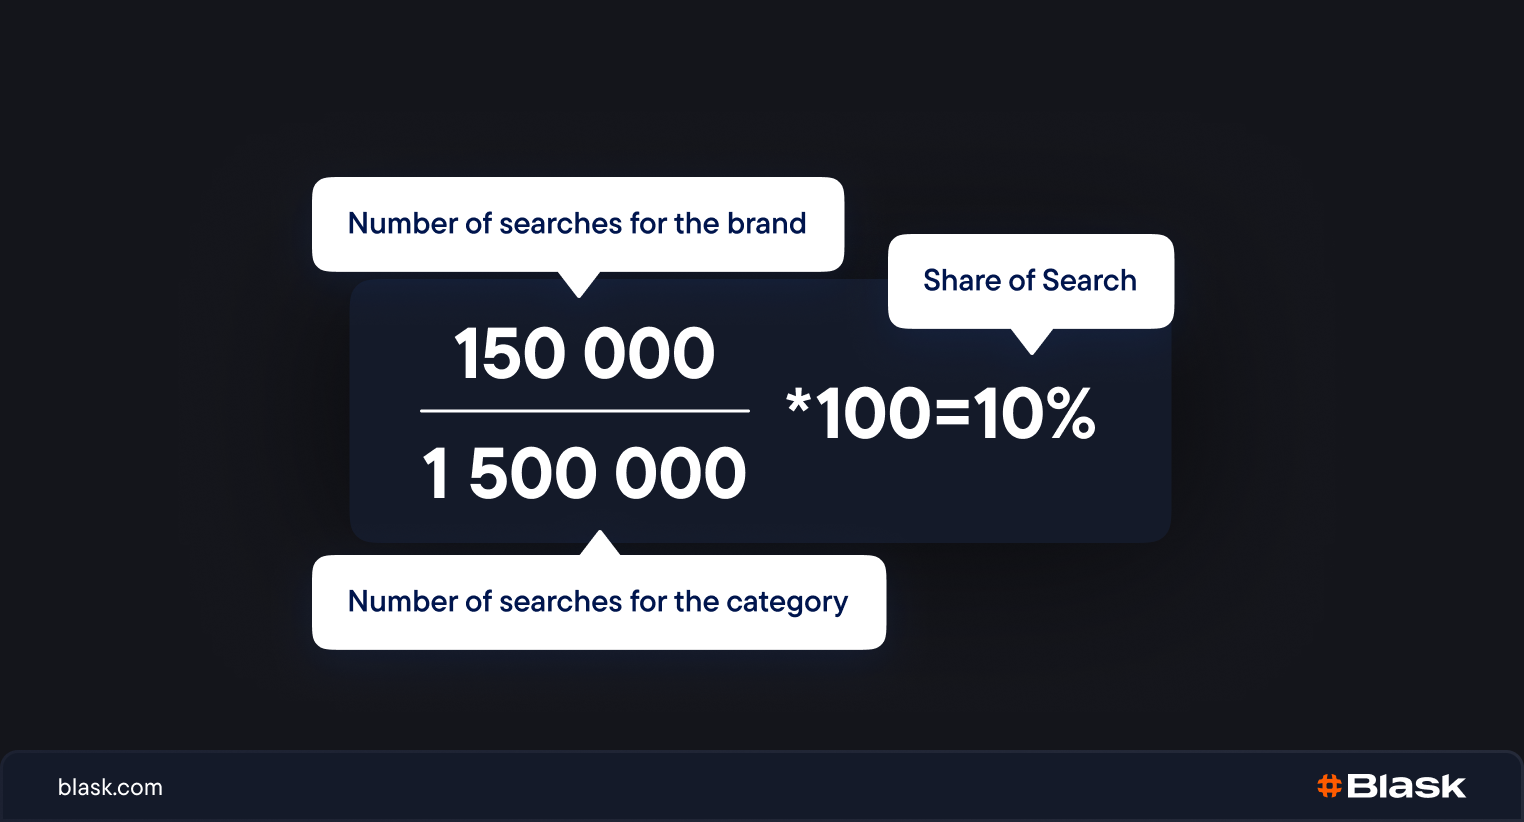
Share of search (SoS) measures what fraction of all brand searches in a category belong to one specific brand. The formula:
SoS = (searches for the brand ÷ total searches for the category) × 100
A brand holding 10% share of search captures one in every ten searches made across all competing operators in that market.
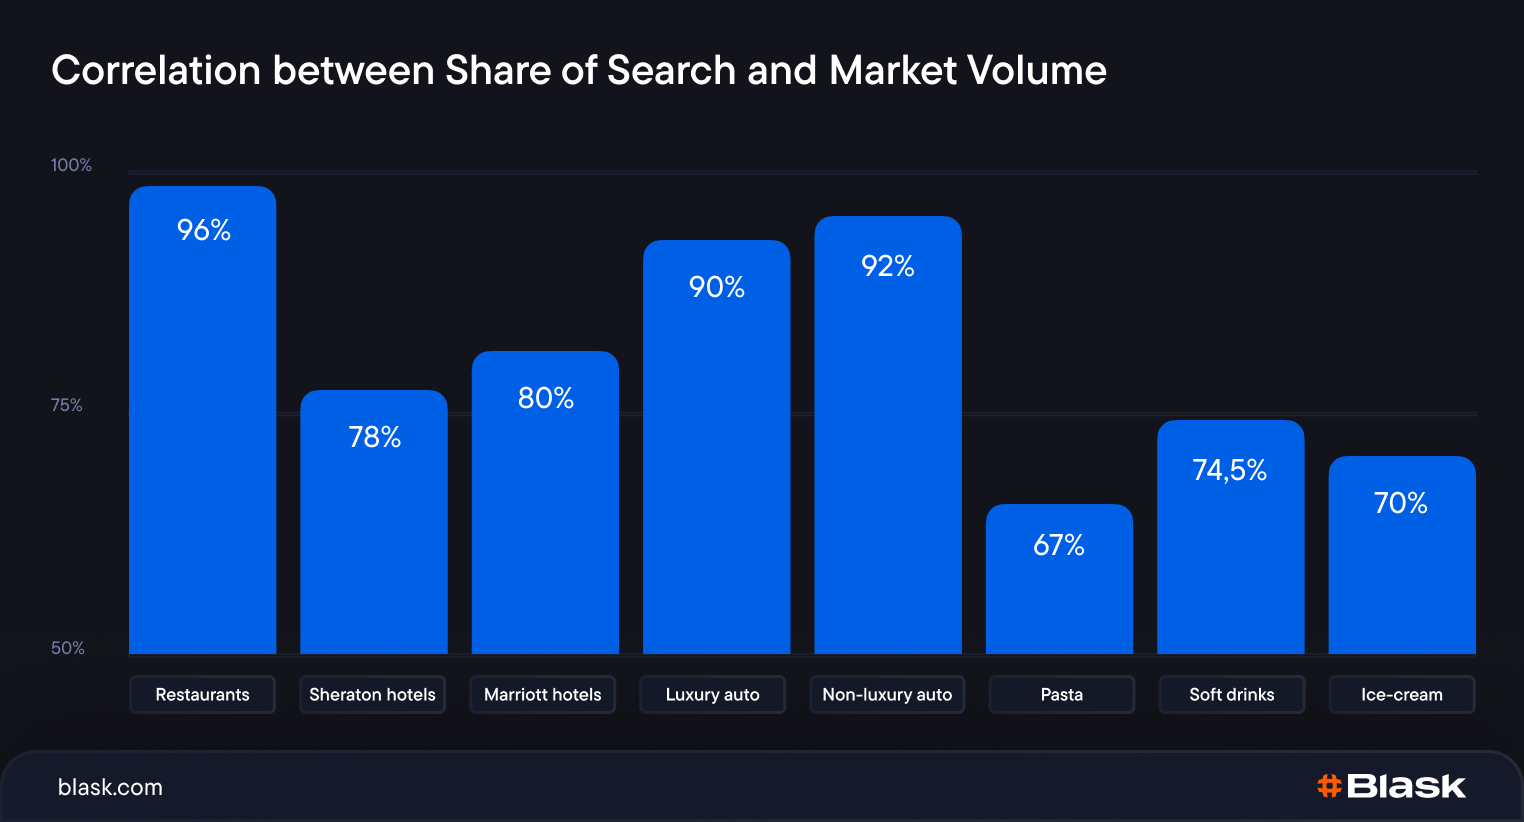
The metric was introduced in 2020 by Les Binet and James Hankins, two British marketing effectiveness researchers. After reviewing over 30 studies across seven countries and 12 industries, they found SoS correlates with market share at an average of 83%. The range by sector: luxury automotive at 90%, restaurants at 96%, hotels at 78–80%.
Blask ran its own analysis for iGaming and confirmed a 95% correlation between share of search and actual market share in the sector. That makes iGaming one of the highest-performing categories for SoS-based prediction.
Why SoS works especially well in iGaming
Most industries where SoS performs well share one structural trait: buyers research before they commit. This is true in automotive, financial services, and hospitality — and it applies directly to gambling.
Before depositing with a new operator, players search. They compare brands, read reviews, look up promotions and license details.
This research happens entirely in Google before any registration or deposit takes place. Search intent precedes transaction intent by a measurable window.
This makes brand search volume a direct proxy for acquisition demand. When an operator captures a growing share of iGaming searches in a market, it is drawing in players who are actively weighing that brand against alternatives. Some will deposit within days; others will take a few weeks. Either way, the SoS signal arrives before the revenue does.
A second factor: iGaming market structure. In regulated markets, a bounded set of licensed operators compete for the same player pool. Search activity concentrates among those brands, which stabilizes the relative proportions and makes small shifts meaningful.
An operator moving from 8% to 12% SoS is not experiencing statistical noise — it is capturing a real shift in player attention.
How Blask measures share of search
Blask builds its core metric — Blask Index — directly on share of search methodology, using data from Google Keyword Planner and Google Trends.
Raw SoS has one recognized weakness: not all searches carry commercial intent. A player searching “operator name withdrawal problem” is not in acquisition mode. A brand caught in a regulatory dispute will spike in search volume for the wrong reasons — raw SoS would read that as demand growth.
Blask addresses this through keyword filtering. The platform tracks positive-intent queries only — searches indicating genuine interest in using a brand (“bet365 betting”, “paddy power login”, “sky bet offer”) — and excludes negative-intent patterns tied to complaints, disputes, and media coverage.
The result is a cleaner signal than raw search volume. Blask Index measures the search activity that predicts player acquisition, not general brand awareness or controversy traffic.
Blask Index is Blask’s demand signal for iGaming brands, built on share of search methodology with positive-intent keyword filtering. It measures how much real acquisition interest each brand generates in a given market, updated continuously from Google data.
Read also: how Blask measures casino brand performance
Brand Accumulated Power (BAP) — Blask’s normalized measure of each operator’s share of total market demand — is the direct SoS output. BAP tells you what percentage of a market’s total player attention a specific brand holds in a given period.
BAP (Brand Accumulated Power) is a brand’s percentage share of total market demand in a country and period. A brand at 12% BAP holds 12 cents of every dollar of acquisition demand in that market.
SoS in practice: the UK market
The UK is one of the most competitive regulated iGaming markets globally. Blask data shows how concentrated demand actually sits at the top.
Based on Blask data for January–December 2025, the top five operators by share of search held:
| Rank | Brand | BAP |
|---|---|---|
| 1 | Bet365 | ~11.5% |
| 2 | William Hill | ~10.1% |
| 3 | Sky Bet | ~6.9% |
| 4 | Ladbrokes | ~6.4% |
| 5 | Paddy Power | ~5.8% |
These five brands together held roughly 40% of all measurable acquisition demand in the UK, offering a clear view of iGaming brand market share in action.
The practical scale of SoS movement: Blask’s total Competitive Earning Baseline (CEB) for the UK market in 2025 was $11.5B ($8.4B–$20.9B range). CEB is Blask’s market-based revenue benchmark, estimating how much an operator should be earning given its competitive position — calculated from behavioral signals, not operator-reported financials. A single percentage point of SoS in that market represents a material volume of player acquisition capacity.
Bet365’s Acquisition Power Score (APS) — Blask’s benchmark for how many new players a brand’s market position implies — reached an average of 2.28M annual new customers in the UK during 2025 (1.71M–3.99M range), growing 15.18% year-over-year. That growth trajectory was visible in Blask’s SoS data months before any public financial results confirmed it.
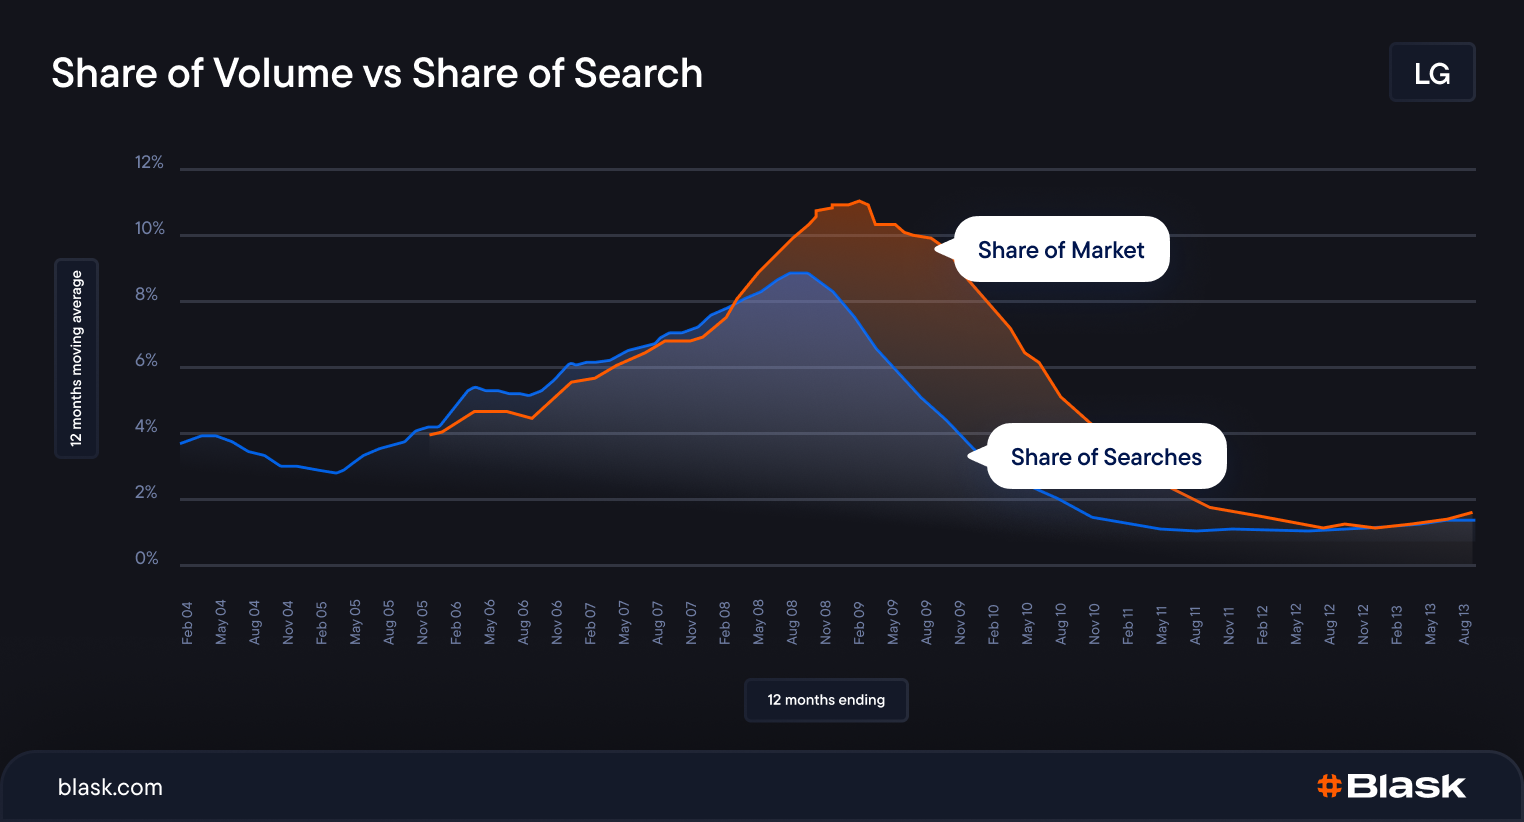
Share of search vs share of voice
The two metrics are frequently confused. The distinction matters for how you act on each.
- Share of voice measures a brand’s presence in paid and earned media: advertising spend, PR coverage, social impressions. It tracks how much a brand is talking to the market.
- Share of search measures how much the market is talking back. It is a demand-side signal. Players initiate these searches independent of what operators are doing with media budgets.
| Share of voice | Share of search | |
|---|---|---|
| Direction | Brand → market | Market → brand |
| Source | Media spend + PR | Google search behavior |
| Lags when campaigns stop? | Yes — immediately | No — brand equity persists |
| Predicts market share? | Weakly | Strongly (83–95% correlation) |
Brands can spend heavily on share of voice without moving share of search. When advertising stops, voice drops immediately — but SoS momentum carries forward based on accumulated brand awareness. This makes SoS a better indicator of durable brand equity.
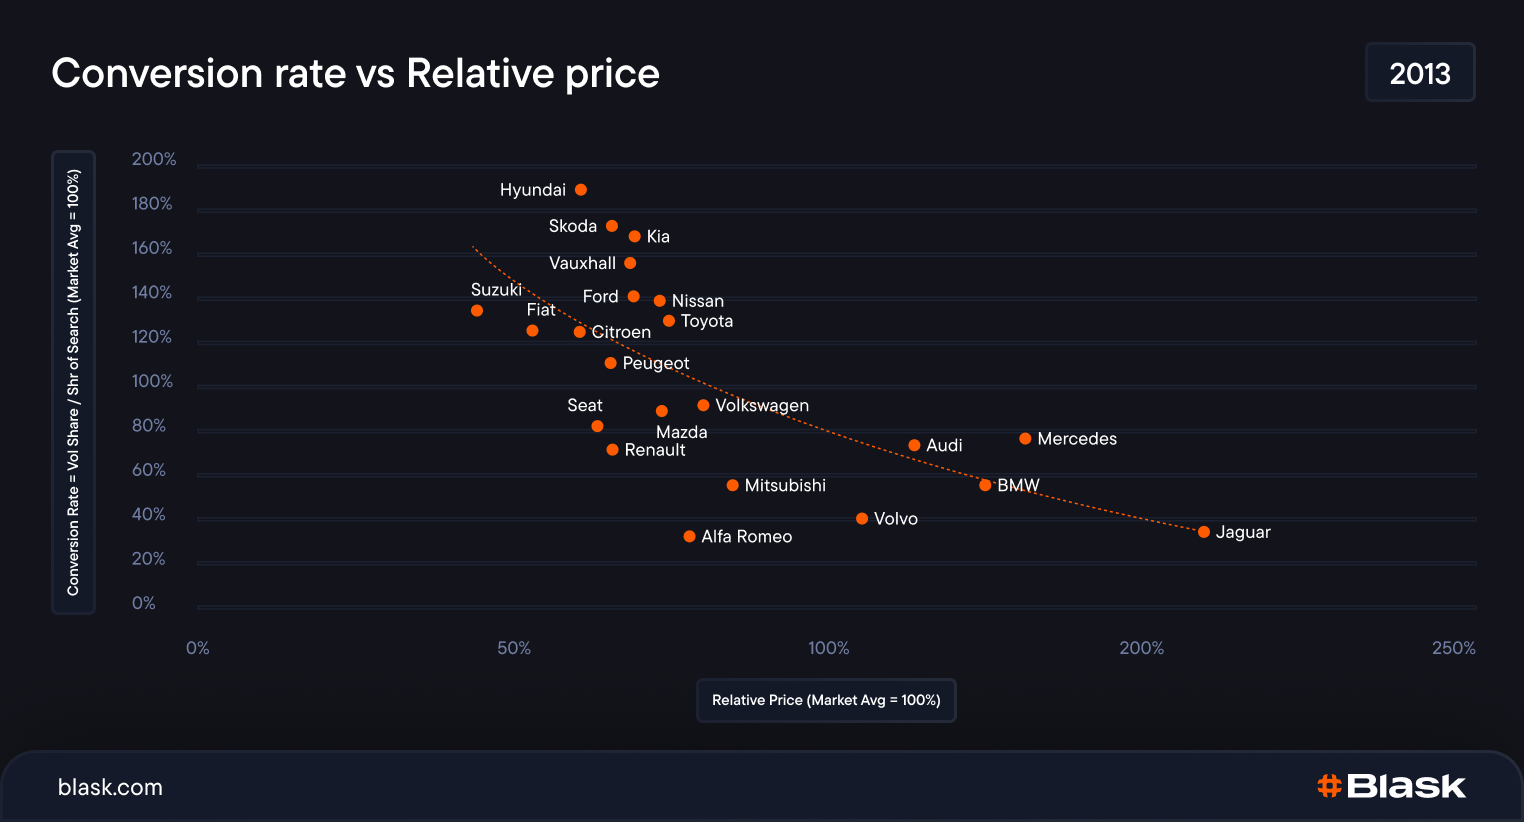
SoS also reveals conversion efficiency. When you divide a brand’s market volume share by its share of search, you get a ratio that shows whether the brand converts search interest into customers better or worse than the market average. Brands above the curve — like Mercedes in the chart below — outperform what their search share alone would predict. Brands below the curve are losing players somewhere between search and sign-up.
The practical implication for operators: a competitor growing SoS without high media noise is building a real demand advantage. It will show in revenue within weeks to months. Watch both metrics, but act on the one that predicts outcomes.
How to track competitor growth using SoS
SoS becomes most useful as a trend, not a snapshot. For iGaming brand benchmarking, what matters is not just where a brand stands today, but how fast its position is changing. A brand at 8% share of search for three straight months is stable. A brand moving from 6% to 8% over 60 days is accelerating — and that acceleration converts to market share within weeks to a few months depending on the market.
When monitoring competitors via Blask, watch for:
- Trend direction over 30–90 day windows.
Consistent SoS growth usually aligns with identifiable causes: major sports league launches, a strong bonus campaign, new affiliate partnerships, or a regulatory approval opening new player segments. The trigger is often traceable once you see the movement. - SoS divergence from market trend.
If total market Blask Index rises 20% during a major sporting event and a competitor’s share goes flat, that operator is underperforming against the seasonal lift. The market grew; they didn’t capture their proportional share. - New entrant SoS velocity.
A brand newly licensed in a market that captures 1–2% SoS within 90 days of launch has meaningful demand-generation capacity and is worth tracking as a future competitor. - Long-term share drift.
Gradual declines in SoS — 0.5–1 point per quarter — often precede significant revenue drops by 3–6 months. In iGaming, the correlation tightens as the market matures, because acquisition demand shifts before players actually churn.
Limitations and how to address them
SoS has one structural limitation: it can misfire when a brand attracts search for non-commercial reasons — regulatory action, a media scandal, or a major technical outage. In these cases, brand searches spike without reflecting acquisition interest.
Raw SoS reads this as demand growth. Blask addresses it through keyword intent filtering: searches combining a brand name with transactional modifiers (“bet”, “login”, “sign up”) are tracked; searches combining the brand with news terms (“fine”, “ban”, “investigation”) are excluded. The signal stays clean through adverse events.
The second limitation is timeline. In iGaming, the SoS-to-market-share lag runs roughly 1–4 months — shorter than the 6–12 months Les Binet measured in automotive, because iGaming acquisition cycles are faster. Short-term SoS movements warrant attention, but confirm them with 60-day trend data before acting on a single week’s shift.
Despite these limits, the 95% correlation Blask confirmed in iGaming is robust. No other publicly available signal predicts market share movement as early or as accurately.
What SoS shows that revenue reports don’t
Revenue data shows what happened. Share of search shows what is happening — and, with a lead time of weeks to months, what is about to happen.
For operators in competitive markets, that difference is the gap between reacting to market shifts and anticipating them. Brands that monitor SoS alongside their own campaign and commercial data have time to adjust acquisition spend, renegotiate affiliate terms, or accelerate a campaign before competitors can respond.
Blask tracks share of search across over 4,000+ iGaming brands in 120+ markets, updated continuously from Google data. The result is a real-time view of demand dynamics that no monthly report can replicate.