- Updated:
- Published:
How Blask AI maps every casino market in real time
AI now lets casino operators track every rival and revenue driver in real time: two vision-plus-language models spot new brand sites within 48h, while the hourly Blask Index flags demand spikes before chips hit the felt.
Add Blask’s AI gauges — APS, CEB and BAP for true lobby position — and you know exactly how many players, dollars and market position you should own.
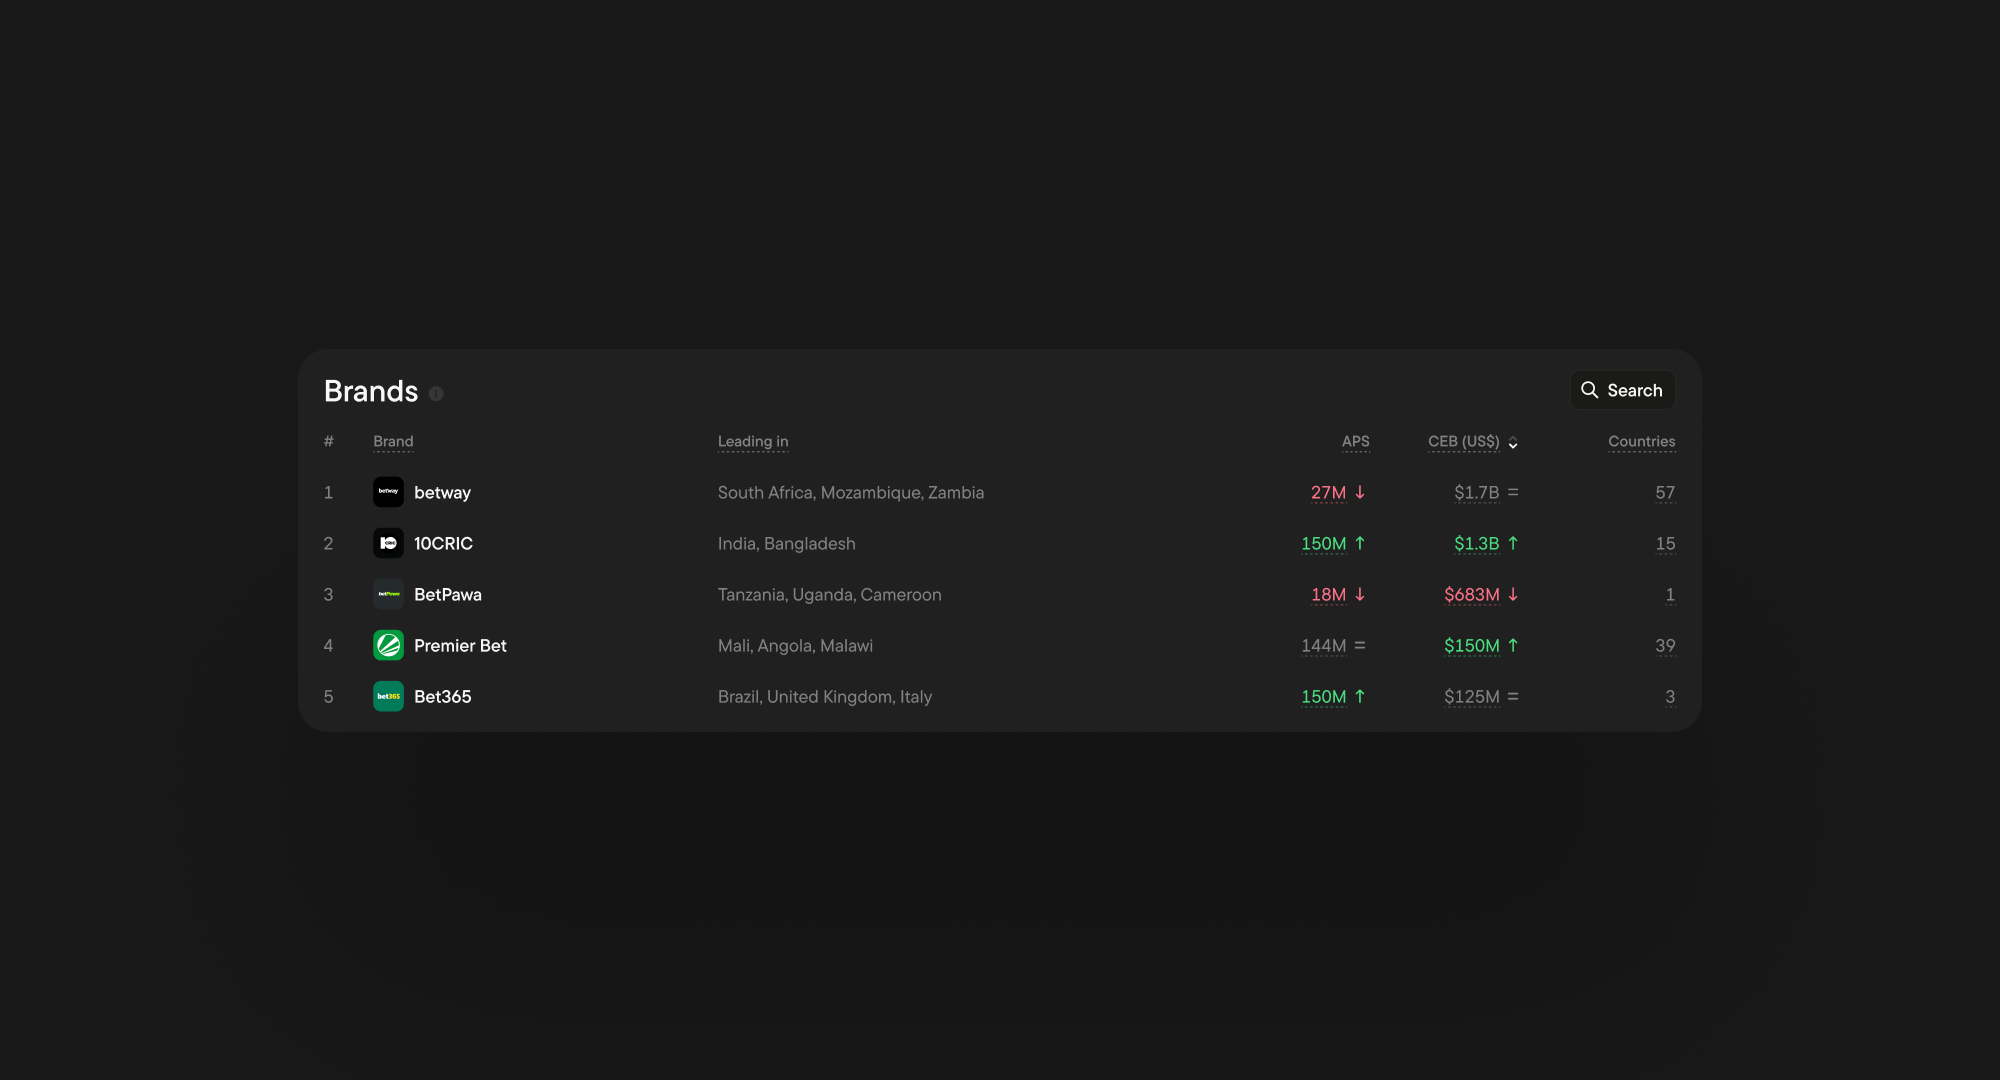
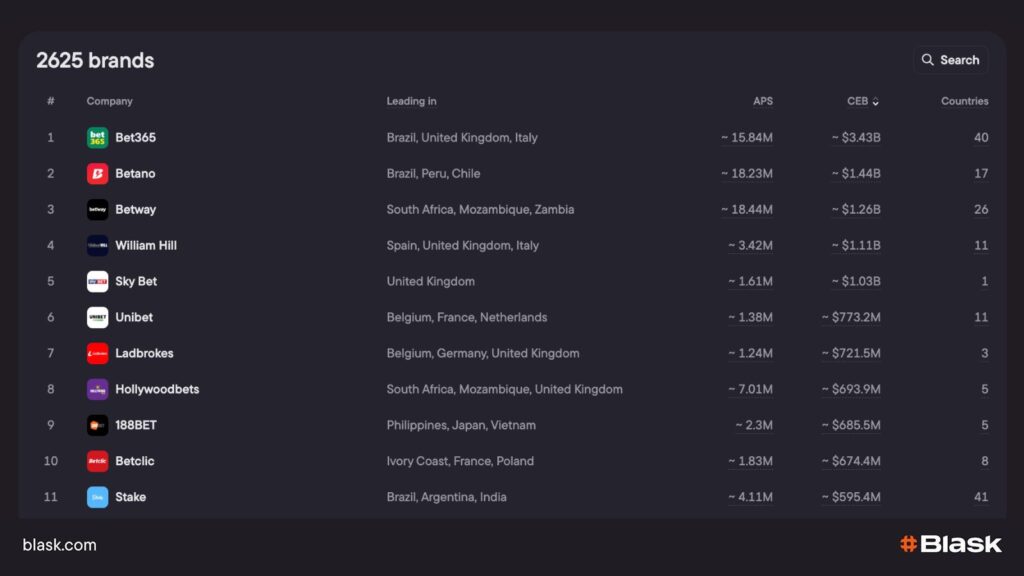
See every competitor — Brand Discovery, two SOTA models.
Blask’s discovery engine starts with a keyword spider that pulls every URL ranking for queries like “online casino” or “sports betting” in the target language.
A computer-vision network looks for slot logos, odds tables and live-dealer frames; a text-analysis model filters out affiliates and news blogs.
💡 Borderline cases go to human review, pushing new brands into the Brands table within 24-48 h and at ≈95 % precision.
📚 Read more: How does Blask search for new iGaming brands?
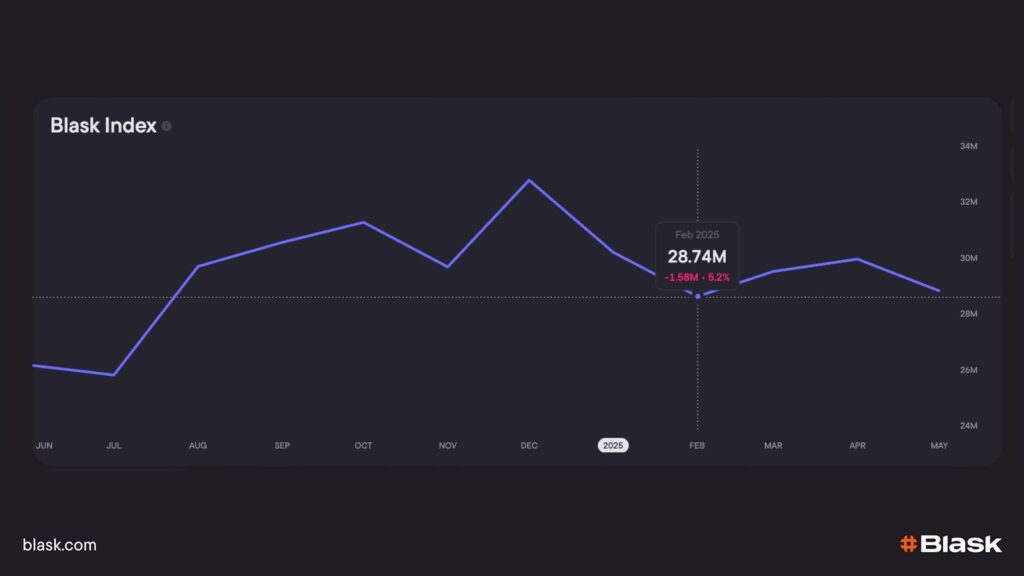
Track market appetite in real time — Blask Index & BAP
Blask Index icalculated every hour for both an entire country and each individual brand or game. It converts raw Google-query volume into an instant proxy for demand, a method that academic studies show predicts future market share with 83-96 % accuracy.
At brand level you can watch:
- whether today’s promo lifts your own curve,
- how a rival’s campaign bends theirs,
- or how players react the hour a new game title
Blask layers that hourly Index with visibility and competitive crowding to create Brand’s Accumulated Power (BAP) — a momentum line that shows whether your share of attention is compounding or stalling. It’s especially useful when your slice is tiny: climb from 0.6 % to 1 % and you jump half the table even before revenue notices.
📚 Read more: BAP is all you need
At country level the same widgets reveal:
- whether total demand is swelling or shrinking,
- which events (a final, a licence launch) trigger the biggest spikes,
- and which time-of-day windows see the heaviest search traffic — perfect for scheduling influencer drops.
💡 Hourly Index for pulse, BAP for trajectory: together they turn search behaviour into a real-time scoreboard you and every competitor share.

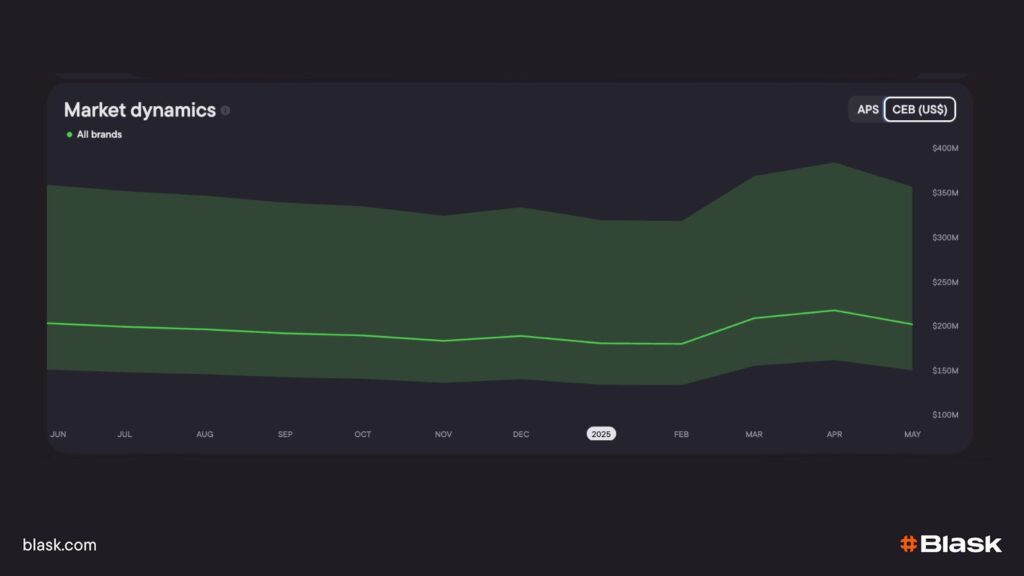
APS & CEB — turning attention into dollars before the month is over.
Blask acts with two forward-facing, AI-driven gauges that appear in the dashboard the second week of every month. Together they show how many new players you should have landed and how much revenue the market says you should be making next month.
Blask’s Acquisition Power Score (APS): an AI model mixes the month’s Index curve with social buzz, app-store rank and affiliate reach, then publishes a three-band range (worse · average · better) showing how many first-time depositors you should have won.
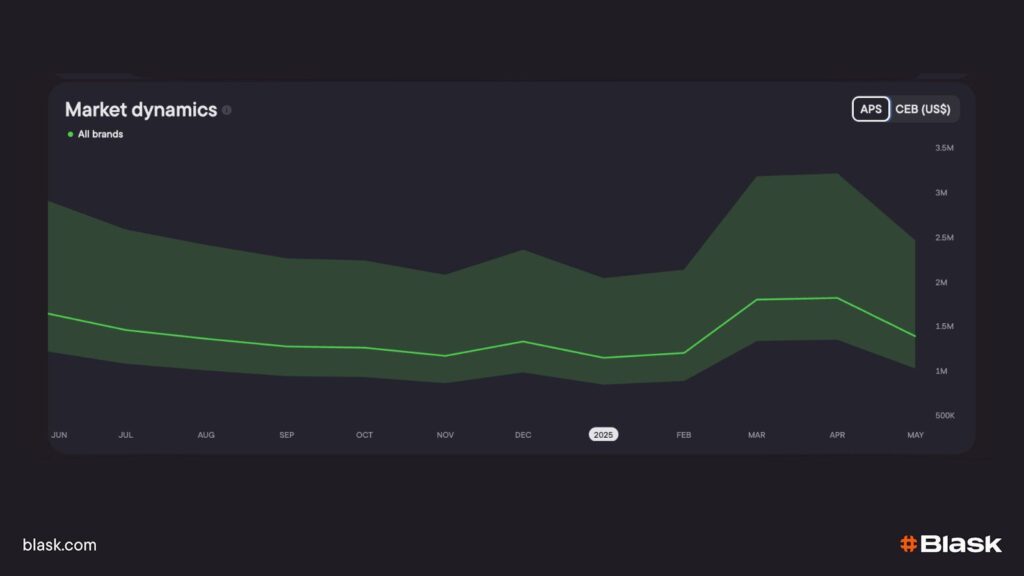
Competitive Earning Baseline (CEB) takes APS, BAP and macro factors (regulation, income, tax drafts) to set a USD revenue corridor for the previous month. GGR below the red floor = under-monetising; a CEB band below peers = under-positioned for the future.
Acquisition Power Score (APS) — volume you should have converted
| What it is | How Blask calculates it | How to use it |
|---|---|---|
| Hourly Blask Index for the past calendar month is blended with social buzz, app-store rank, affiliate reach and seasonality to publish a three-band range in FTDs: worse · average · better. | A gradient-boost model ingests (1) last-month Index curve, (2) share of voice in Meta/TikTok, (3) top-50 keyword positions, (4) app-store visibility and (5) affiliate click-outs. The output is pushed on day 10 each month. | Benchmark: align your internal FTD log to the band. If you sit in red, you’re leaking sign-ups; in green you’re maxing out demand. Spy: filter the All-Brands table to peer operators — a rival in green while you’re red means their funnel, not their spend, beats yours. |
Competitive Earning Baseline (CEB) — revenue you should capture next month
What it is How Blask calculates it How to use it A USD corridor (worse · average · better) showing realistic next-month GGR. The model layers APS, BAP, macro signals (GDP, disposable income, tax drafts) and competitor yield to set the band. Gap analysis: drop last month’s GGR on the bar. • Below red = under-monetising; optimise VIP, retention and cross-sell. • Mid band = room to grow. • Above green = outperforming model; replicate across markets.
Benchmark: if your band trails peer CEB, you need deeper product mix or new licences.📚 Read more: A new era of brand performance: APS & CEB
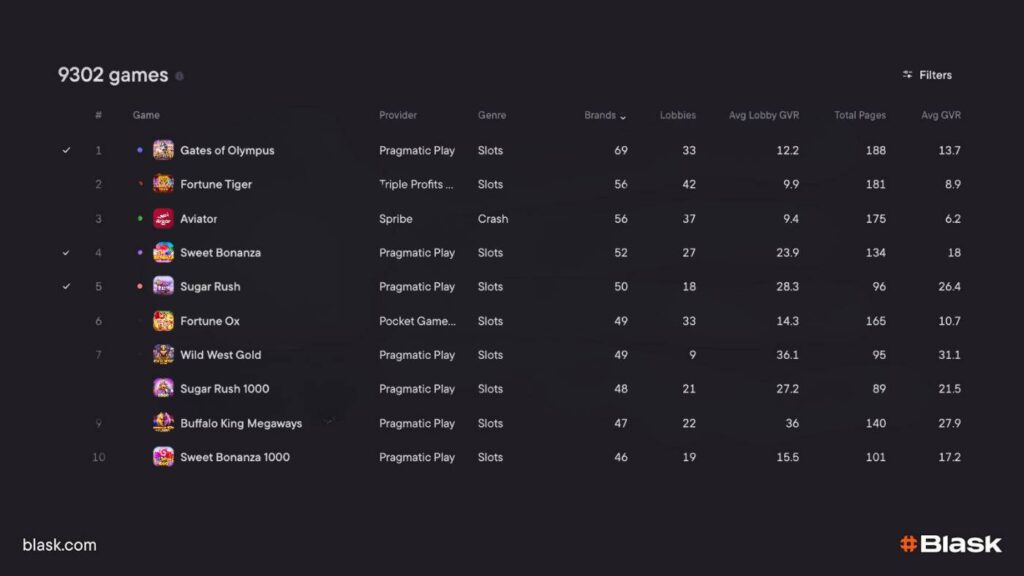
Game Visibility Rank (GVR) — computer vision that audits every lobby.
Blask’s Games engine sweeps hundreds of operator sites every night, captures full-length screenshots, then runs a computer-vision model that recognises 10 000-plus game logos at 400 frames per second.
Each tile is numbered top-left to bottom-right, so the system outputs a single metric — Game Visibility Rank — pin-pointing where a title really sat when most clicks occur.
Benefits & use-cases for operators
- Provider negotiations – Sort GVR by studio; if a top-fee supplier owns only one game in the national top-20, you have leverage to renegotiate.
- Promo truth-check – Monday morning, marketing sees whether last weekend’s banner jumped a slot from seat 23 to seat 4, quantifying ROI instant-ly.
- Catalogue pruning – Any game whose average GVR drifts past 70 and Share-of-Interest drops under 0.1 % is flagged for archive, slimming lobby load-times.
Customer Profile — AI psychographics on tap.
Blask fused 80 000 player surveys with a Retrieval-Augmented Language Model to predict, for every market segment, age bracket, income band, preferred product and motivations.
Benefits & use-cases for operators
- Hyper-targeted campaigns – Push cricket-themed free bets only to segments the model tags as “sports-first, high LTV,” halving bonus burn.
- Safer-gambling triggers – Overlay harm-risk scores on high-intensity cohorts so RG teams intervene before losses spiral.
- Market-entry due-diligence – Before lighting up a new licence, forecast the likely age-income mix and set payment options that match local banking habits.
💡 Together, GVR shows where your games sit, while Customer Profile reveals who is likely to click them — and why — giving operators a full-stack view from lobby shelf to player psyche.
📚 Read more: How Blask AI powers Customer Profile
What you gain.
- Real-time reporting – Hour-level Index, BAP and GVR mean decisions match the news cycle.
- Full competitor transparency – Discovery table shows who just entered and who surged.
- Market-health radar – APS & CEB reveal growing or cooling regions before revenue lags.
- Audience clarity – Customer Profile spells out who is clicking next.
- Licensing & strategy clarity – Local/International split shows where regulation bottlenecks or opens lanes.
Conclusion.
Blask’s AI stack turns the entire casino market into a living dashboard: brand-discovery models reveal every competitor, the hourly Blask Index + BAP show demand momentum, APS and CEB translate that attention into realistic player and revenue targets, GVR audits actual lobby placement, and Customer Profile tells you exactly who is likely to click — and when.
The result is real-time intelligence, full transparency on rivals, early alerts on rising or fading markets, granular audience insight and a clear view of where licences or product depth will matter next.
Operators no longer wait for quarterly revenue to decide; they adjust campaigns, funnels and road-maps before the next spin lands.