- Updated:
- Published:
How to collect data on iGaming brands without Blask?
In developing Blask, we discovered that iGaming professionals spend significant time, resources, and budget on competitor analysis and performance benchmarking. Blask’s AI-driven technology streamlines this process. Let’s look at what it would actually take to do it yourself — and why most teams quietly give up halfway through.
How many people are searching for a specific brand?
This is the simplest information you can find without Blask, and it’s absolutely free.
At the heart of Blask lies our unique metric, Blask Index, which measures players’ search interest in iGaming brands. We sum search query volumes across all relevant keywords for each brand to produce a single, comparable number per country. Sounds straightforward. Here’s where it gets complicated.
We’ll use Google Search — specifically Google Trends:
- Follow this link.
- Enter the brand name.
- Select the time frame and country.
- Google will generate a chart.
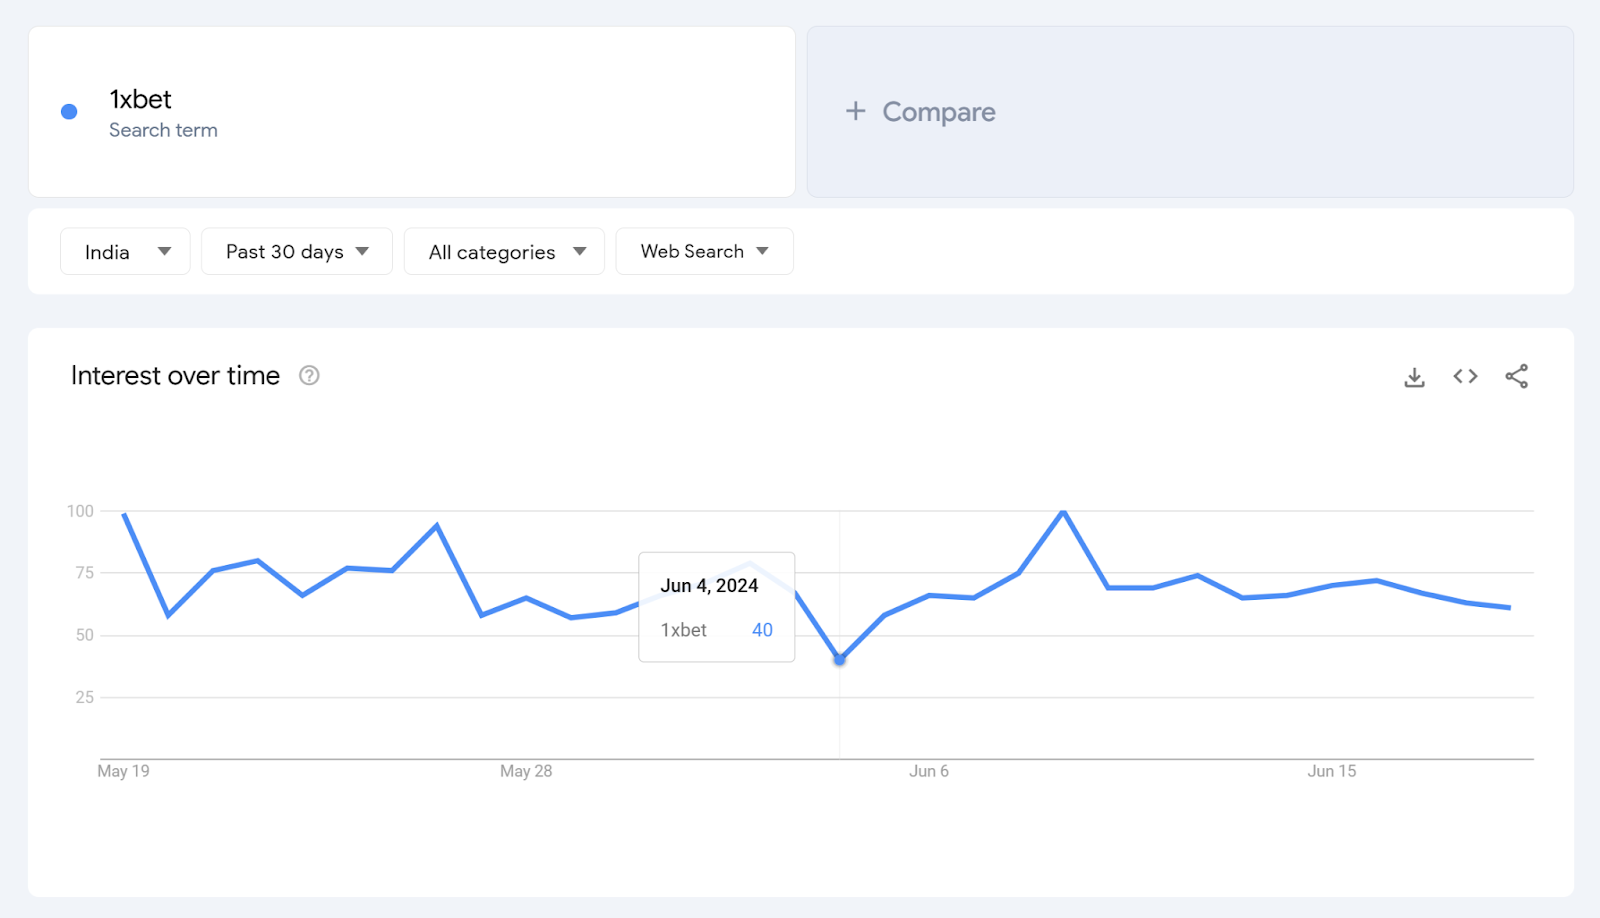
And then you’ll notice those numbers from 0 to 100. Google Trends doesn’t show absolute search volumes — 100 represents peak interest, 50 is exactly half, and 0 means effectively zero. Useful directionally, but not actionable on its own.
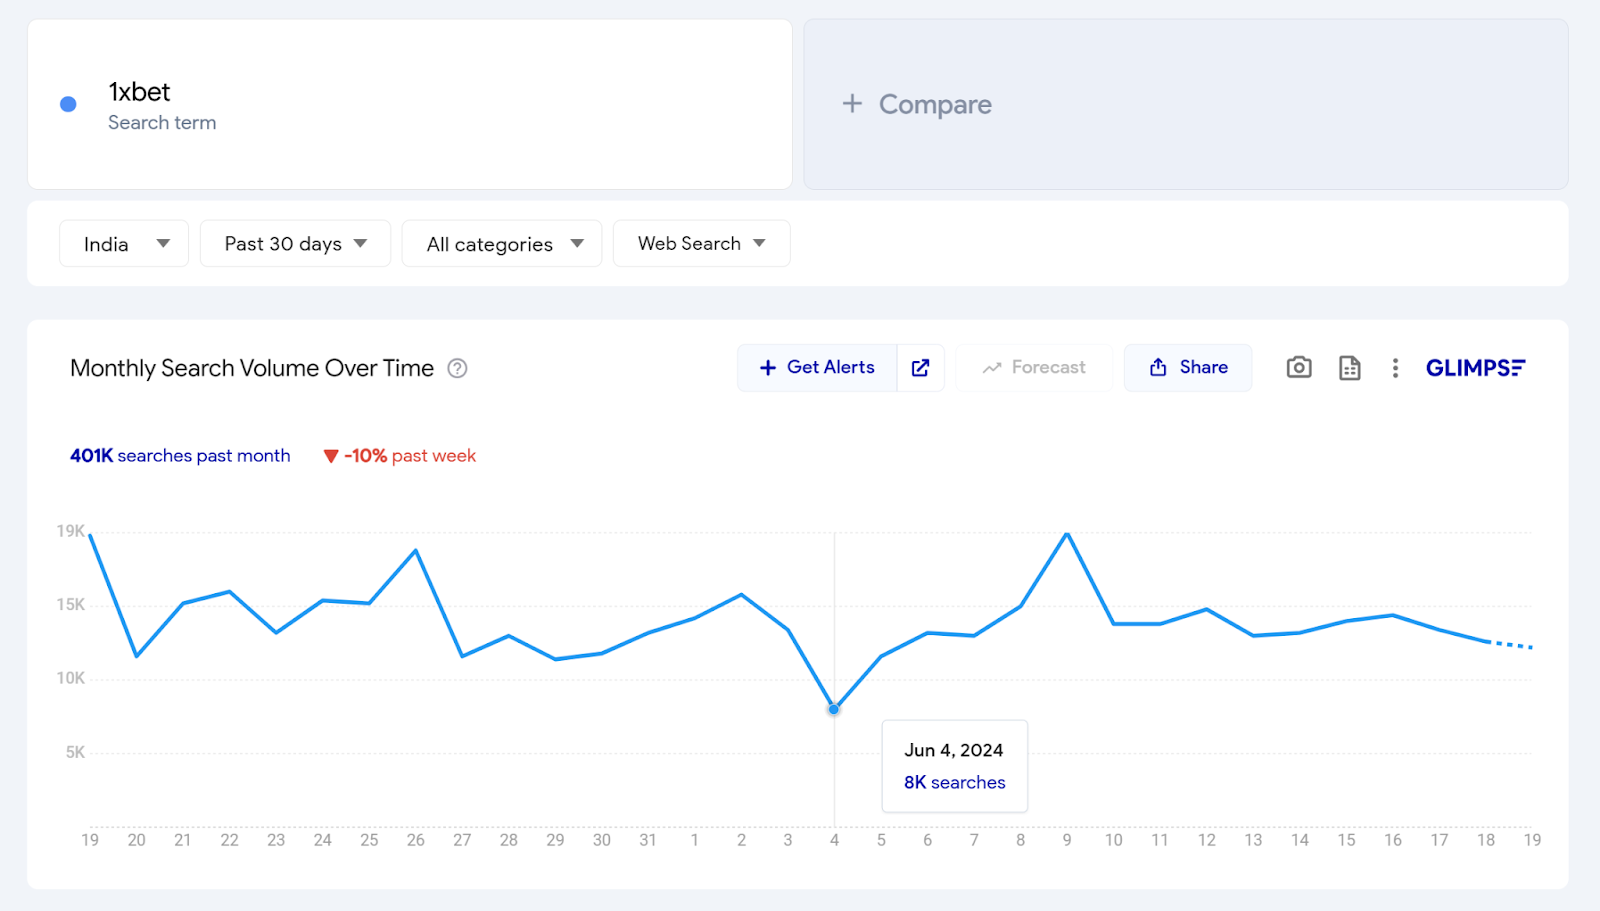
To convert those relative values to real query counts, you’ll need Google Keyword Planner — or one of several Chrome extensions that overlay absolute search volume data directly onto Google Trends charts. The math is simple enough: if “40” on the chart corresponds to 8,000 monthly searches, then 1 unit = 200 searches, and 100 = 20,000 searches.
👉 Now repeat this for every brand you want to track. How many are there? In India alone, Blask tracks 477 active brands as of 2025. In Brazil, 542. In 2024, some industry blogs cited “top 10 lists.” The math doesn’t work in their favor.
A single brand takes roughly an hour to process properly. And that data will be stale by next week.
Google Trends limitations
It’s worth noting that Google Trends sometimes contradicts itself. We ran the same query for “1xbet” in India over the same period, just a few days apart — the charts looked similar, but the index values differed by 11 points (89 vs. 78). That’s not a margin of error; that’s a structural inconsistency. Google acknowledges this openly: their charts are based on a sample of search queries, and variance is expected.
Blask addresses this by querying the same period multiple times and averaging across runs. It’s the only statistically sound approach — unless you happen to work at Google.
Spelling variants matter more than you think
People misspell brand names constantly. “1xbet”, “1 x bet”, “1x bet”, “1 xbet” — each variation pulls different data. For a hundred brands, manually cataloguing every spelling permutation is the kind of task that makes analysts reconsider their career choices.
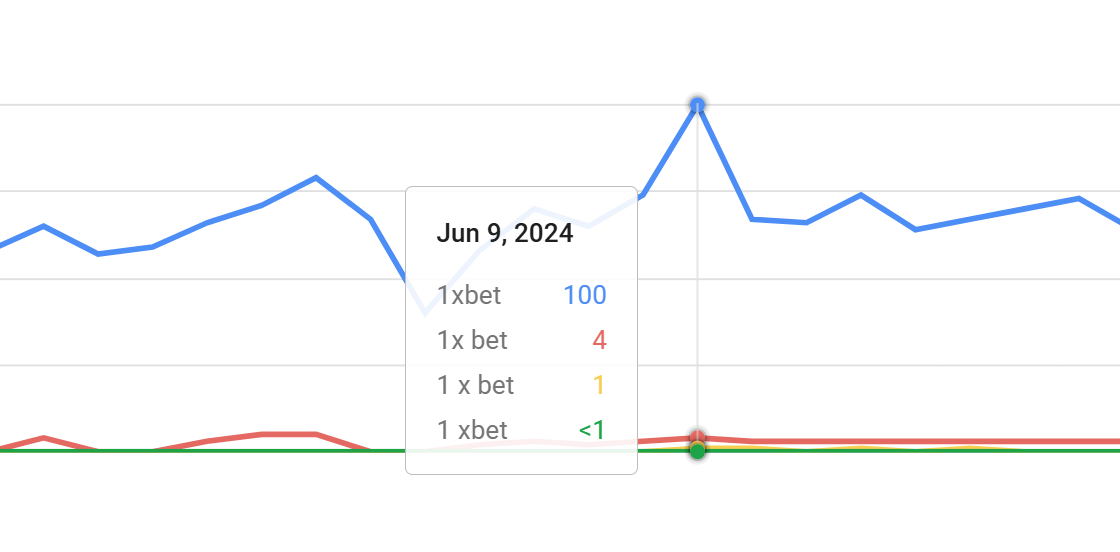
Blask tracks all known spelling variants automatically and rolls them into a single Blask Index figure per brand.
Non user-friendly design
Google Trends doesn’t exactly invite deep analysis. Constant date-switching, relative values instead of absolutes, no multi-brand comparison beyond five at a time. It does what it does.
Blask displays all brands on a single chart across their entire market history, at hourly granularity.
How many people make their first deposits?
APS (Acquisition Power Score) measures how effectively a brand converts market-wide search demand into new depositing players. It aggregates Blask Index trends, market positioning, and conversion benchmarks to estimate the volume of new customers a brand acquires over a given period.
For context: in 2025, India’s iGaming market generated an estimated ~19 million new player acquisitions across all tracked brands. Brazil: ~79 million. Those aren’t guesses — they’re derived from Blask’s model, trained on regulatory reports, partner data, and player surveys.
Can you estimate this without Blask?
If you work at an iGaming brand with access to your own internal analytics, yes — partially. The standard shortcut is to apply your own conversion rates to a competitor’s search traffic estimate. Multiply their Blask Index (obtained through the method above) by your conversion rate to get a rough APS proxy.
This works reasonably well if your brand is close to market average. If you’re significantly above or below average — which most brands are, in either direction — the estimate drifts fast.
For markets where you don’t operate, or if you don’t have access to internal analytics, there are two paths:
- Consult iGaming analysts who work across multiple markets. They typically have conversion rate benchmarks. Consultations are not cheap.
- Study regulatory commission reports in licensed markets. France, Sweden, UK, New Jersey — these publish regular data. Most markets don’t.
🧠 Expert consultations, if you can afford them, give you a snapshot. They don’t give you a trend. They definitely don’t give you 477 brands in India.
Blask’s AI model calculates APS for both regulated and unregulated markets. The model is trained on 56GB of analyst data, open regulatory reports, and player surveys, validated continuously by partner brands.
How much revenue do iGaming brands generate?
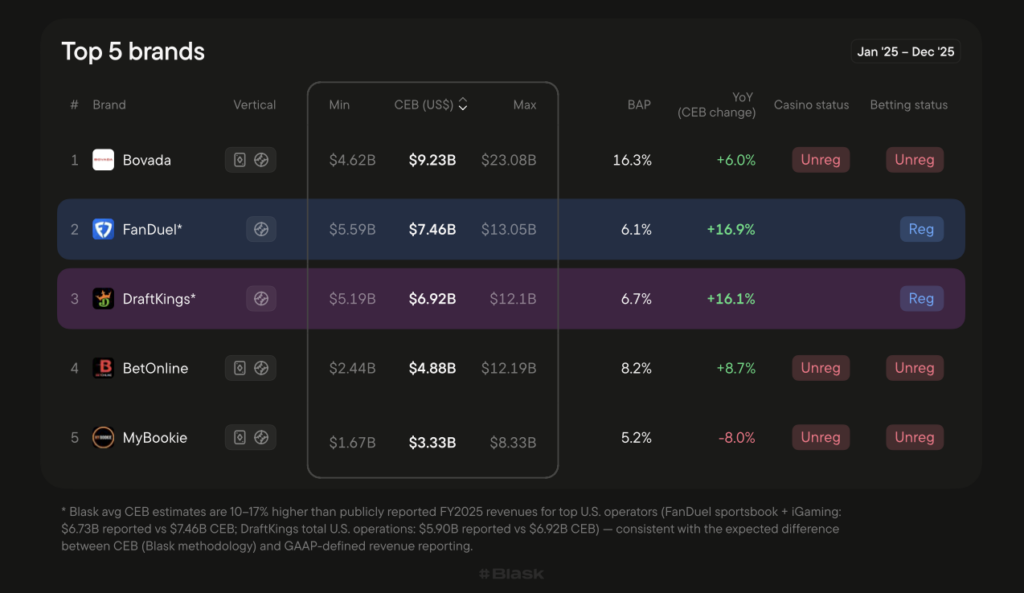
CEB (Competitive Earning Baseline) is a forward-looking revenue estimate derived from APS, market benchmarks, and competitor dynamics. It tells you what a brand should be earning based on its market position and acquisition power — not just what’s self-reported.
Calculating net income without internal access is essentially impossible. But Gross Gaming Revenue (GGR) estimation is theoretically achievable — if you’re willing to accept heroic assumptions and months of manual work.
Here’s what GGR actually requires to estimate:
- Player retention rates over time
- New player volumes (APS, covered above)
- First deposit size distributions
- Redeposit behavior patterns
- Seasonal effects (a major sports event can swing weekly revenue significantly)
A casino’s player base isn’t static. It turns over constantly. Players churn after the welcome bonus, stay for the loyalty program, return for the Champions League. Manually modeling this for one brand is genuinely difficult. For a competitive set of 20 brands across three markets, it stops being a competitive intelligence project and starts being a data science engagement.
The only practical shortcut is to find publicly filed reports from regulated markets — and then pray your market of interest has mandatory GGR disclosure. Many don’t.
Blask’s CEB model runs on public regulatory data, expert insights, and ongoing validation from brands already using the platform. All calculations are updated automatically.
What’s a brand’s market share?
This is a metric the original competitive intelligence playbook didn’t have a good answer for. It still doesn’t — unless you use Blask.
BAP (Brand’s Accumulated Power) measures a brand’s percentage share of total market search demand. It’s calculated as the brand’s Blask Index divided by the sum of Blask Index across all tracked brands in that country.
Why does it matter? Because raw Blask Index numbers are hard to interpret in isolation. A brand growing 30% YoY might still be losing ground if the market is growing 60%. BAP normalizes this: it tells you whether a brand is gaining or losing competitive position, independent of market-wide trends.
For context: in India in 2025, the top brand (4rabet) held roughly 10.6% BAP. The market was competitive enough that the #10 brand still had meaningful share. Doing this calculation yourself requires knowing the Blask Index for all 477 active brands simultaneously — see previous section on why that’s not a weekend project.
What brands even exist?
Here’s what we found when we started mapping the iGaming landscape: media and blogs reliably cover the top 5–10 brands per market. Industry professionals know up to 50. The actual competitive landscape is orders of magnitude larger.
🔗 As of 2025, Blask tracks:
- 477 active brands in India (up from 242 in June 2024)
- 542 active brands in Brazil (up from 171 in June 2024)
- 584 total tracked brands in Brazil including inactive and discontinued operators
And these numbers keep growing. The market changes daily: new brands launch, old ones quietly shut down, white-labels rebrand.
How do you find all brands manually?
- Option 1: Google it. Search “betting India” and go through result pages. You’ll wade through affiliate sites, aggregator blogs, news articles, and eventually arrive at actual brand pages. The author of this article tested this personally — two hours of searching surfaced 63 brands in India. Blask found 477. That’s a 7.5× gap, if you’re counting.
- Option 2: Ask people. Reach out to journalists, analysts, consultants. They’ll tell you about brands they know. They’ll also miss brands they don’t know about, won’t share commercially sensitive data, and their information will be at least several weeks old by the time it reaches you.
- Option 3: Go to industry events. SiGMA, ICE, SBC Summit — the right conversation can surface brands that never appear in press coverage. Blask won the SiGMA Asia Startup Pitch 2024, SiGMA Eurasia Best AI Solution 2026, SBC Rising Star in Casino Innovation 2025, and iGB Affiliate Best Tech 2025 at these kinds of events. The networking is genuinely valuable. It doesn’t scale.
Blask’s AI continuously monitors the web to detect new iGaming brands, classify them by market and platform type, and add them to the database. No manual curation required.
Games: what’s actually in the lobby?
This is a layer of competitive intelligence that doesn’t have a manual equivalent at all.
Blask’s GVR (Game Visibility Rank) measures how prominently a game is featured in a brand’s lobby — a proxy for operator commitment to that title. Combined with Blask’s game-level demand index, you can answer questions like: which games is Betano actively promoting in Brazil right now? Is a specific provider gaining or losing shelf space across the top 20 operators?
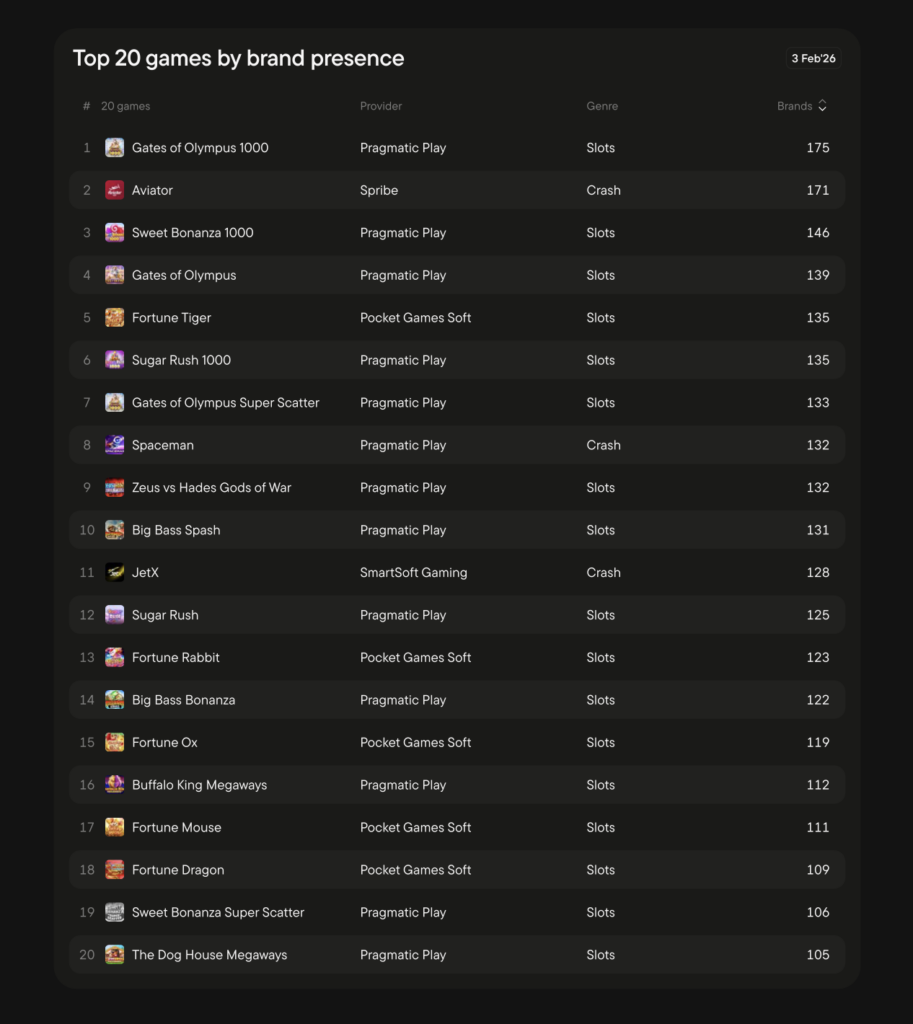
The alternative is to manually visit brand lobbies, screenshot and log game placements, and do this across hundreds of brands in dozens of markets. There is no reasonable manual version of this.
How to keep all data current?
Manual competitive intelligence degrades immediately. A market entry, a brand rebrand, a regulatory shift — these happen constantly. Data collected in January doesn’t reflect February.
The cost of staying current manually includes: regular analyst time, specialized tools, and the latent risk of acting on outdated numbers.
Blask’s update schedule:
- Blask Index — refreshed hourly
- APS and CEB — updated monthly
- Brand discovery — continuous (AI monitoring)
- Game analytics (GVR) — updated regularly
The interface handles interpretation: all brands on one chart, full historical coverage, hourly granularity, and an API for teams that want to pull data into their own systems.
The honest summary
Every section of this article follows the same pattern: there’s a manual method, it works for one brand in one market, and it stops being feasible somewhere around brand number 10 or market number 3.
The information is out there — Google Trends is free, regulatory reports are public, industry experts are reachable. What’s not free is the time it takes to collect, normalize, and maintain it. And time, if we’re being honest, is the resource most iGaming teams have least of.
Blask has already done the collection. The models are trained. The data is current. The brands are found — including the ones you haven’t heard of yet.
Choose Blask for timely, accessible, and comprehensive iGaming analytics — now recognized as the Best AI Solution .