- Updated:
- Published:
From boom to bust: how Blask helps predict and navigate market cycles.
The iGaming industry’s volatility demands more than instinct — Blask provides AI-driven insights to forecast trends, track market shifts, and explain why they happen. With tools like Blask Index, Blask Trends, Market Explanation, and Customer Profile, operators can thrive in any market condition.
The iGaming industry is notorious for its volatility. One minute, the market is booming, with players flocking to online platforms, and the next, there’s a sharp downturn, often leaving operators scrambling for stability. Successfully navigating these cycles requires more than just instinct — it demands real-time data and predictive insights.
Blask offers exactly that. From forecasting market trends to explaining why they shift, Blask empowers operators to thrive, whether the market is surging or faltering.
How do market booms and busts work in iGaming?
In the iGaming world, market cycles are driven by a variety of factors, including technological innovation, sporting events, changes in regulations, and macroeconomic conditions.
Booms occur when market conditions favor growth, such as the launch of major sports events, shifts in consumer behavior, or new technology like mobile gaming or blockchain adoption.
Busts, on the other hand, are often triggered by oversaturation, increased competition, or stricter regulations.
💡 Read more: How different events influence the iGaming market.
Track iGaming trends with Blask Index
Blask Index serves as a barometer for the iGaming market, tracking search queries and market interest in real-time. Updated hourly, this tool gives operators a current view of market trends, helping them react swiftly to both positive and negative changes.
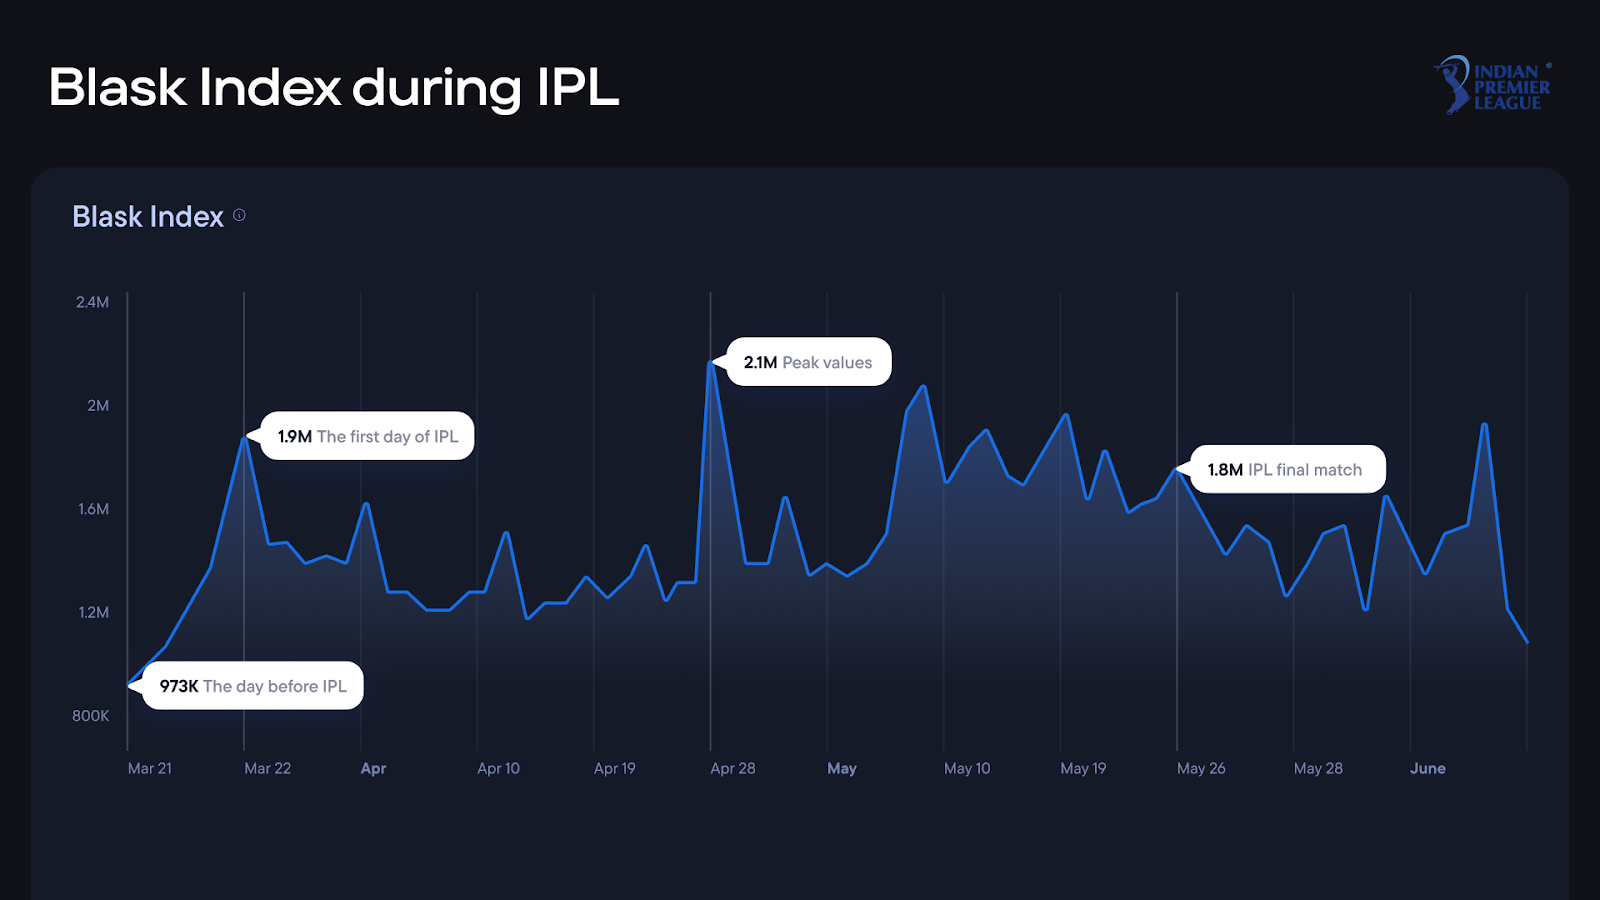
Use Blask to determine the impact of past events on the iGaming market in a selected country. For example, in India, we observe a significant increase in activity and interest during the IPL (Indian Premier League) period. Check out our report on IPL 2024 if you wish to delve into the details.
Equipped with insights from the past and a calendar of future events, it becomes possible to forecast not only when the next boom might occur but also how long it is likely to last.
Blask Trends — cut through the noise
Blask Index captures everything — including spikes from finals weekends, headline sponsorships, and one-off bonus surges. That granularity is powerful, but it can also be noisy.
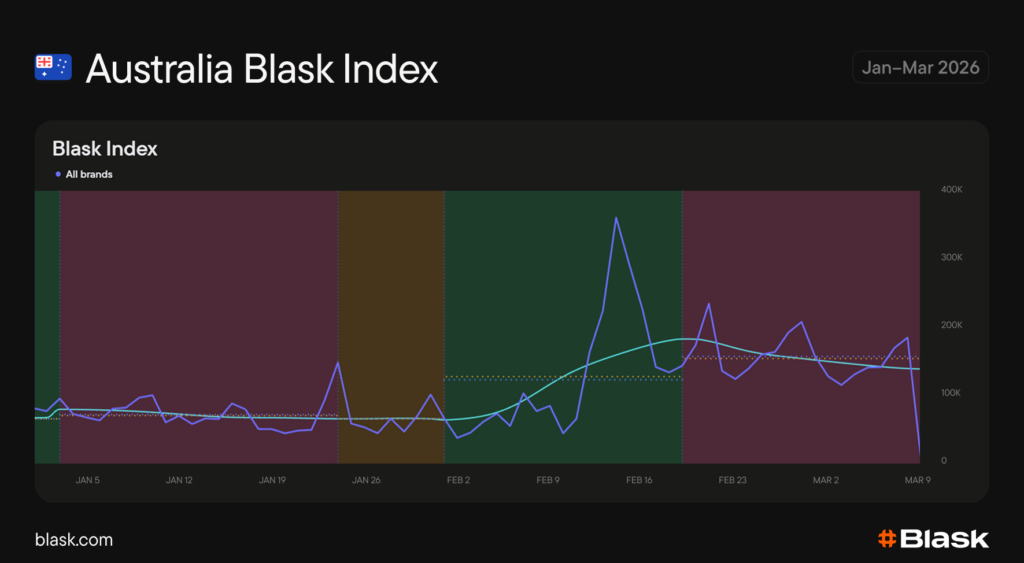
Blask Trends strips out the extremes and smooths the volatility to reveal the clean underlying direction of a market. On top of the smoothed line, it classifies every market into one of three states:
- 🟢 Growth — sustained upward momentum
- 🟡 Stagnation — flat or sideways movement
- 🔴 Decline — consistent downward pressure
You can toggle Trends on and off inside the Blask Index widget and set it as your default view. AVG and MED values for the selected period are always visible, giving you a stable reference for what “normal” looks like.
Blask Trends lives inside the Blask Index widget across every market, with the same hourly refresh cadence as the core Index.
Market Explanation — now Blask tells you why
Blask Index shows what is happening. Blask Trends shows where it’s heading. The hard part was always explaining why — fast, and with evidence. Market Explanation does it in one click.
Click any trend segment and the system returns a structured, source-cited explanation of the forces behind the current market cycle:
- Overview — what drove this cycle, in two sentences.
- Drivers — categorised: sports, regulation, payments, operators, macro, seasonality.
- Key events table — specific dates, policy changes, operator moves that shaped the period.
- Sources — numbered citations with direct links.
📌 Available across all markets Blask tracks. Refreshes four times daily.
Apply global data to your market
At the time of publishing this article, Blask is gathering data from 34 countries, and this number is constantly increasing! One day, we will reach all the countries in the world!
We understand that every country is unique and that regulations can vary significantly; however, it is still preferable to rely on relatively comparable data rather than navigating in the dark without a flashlight.
Consider how sporting events, periods of political instability, the COVID-19 pandemic, and the introduction of regulations or bans on iGaming entertainment have impacted markets in other countries. You may find yourself expecting an overly large increase in players from a local football match or, conversely, overestimating the impact of a student protest.
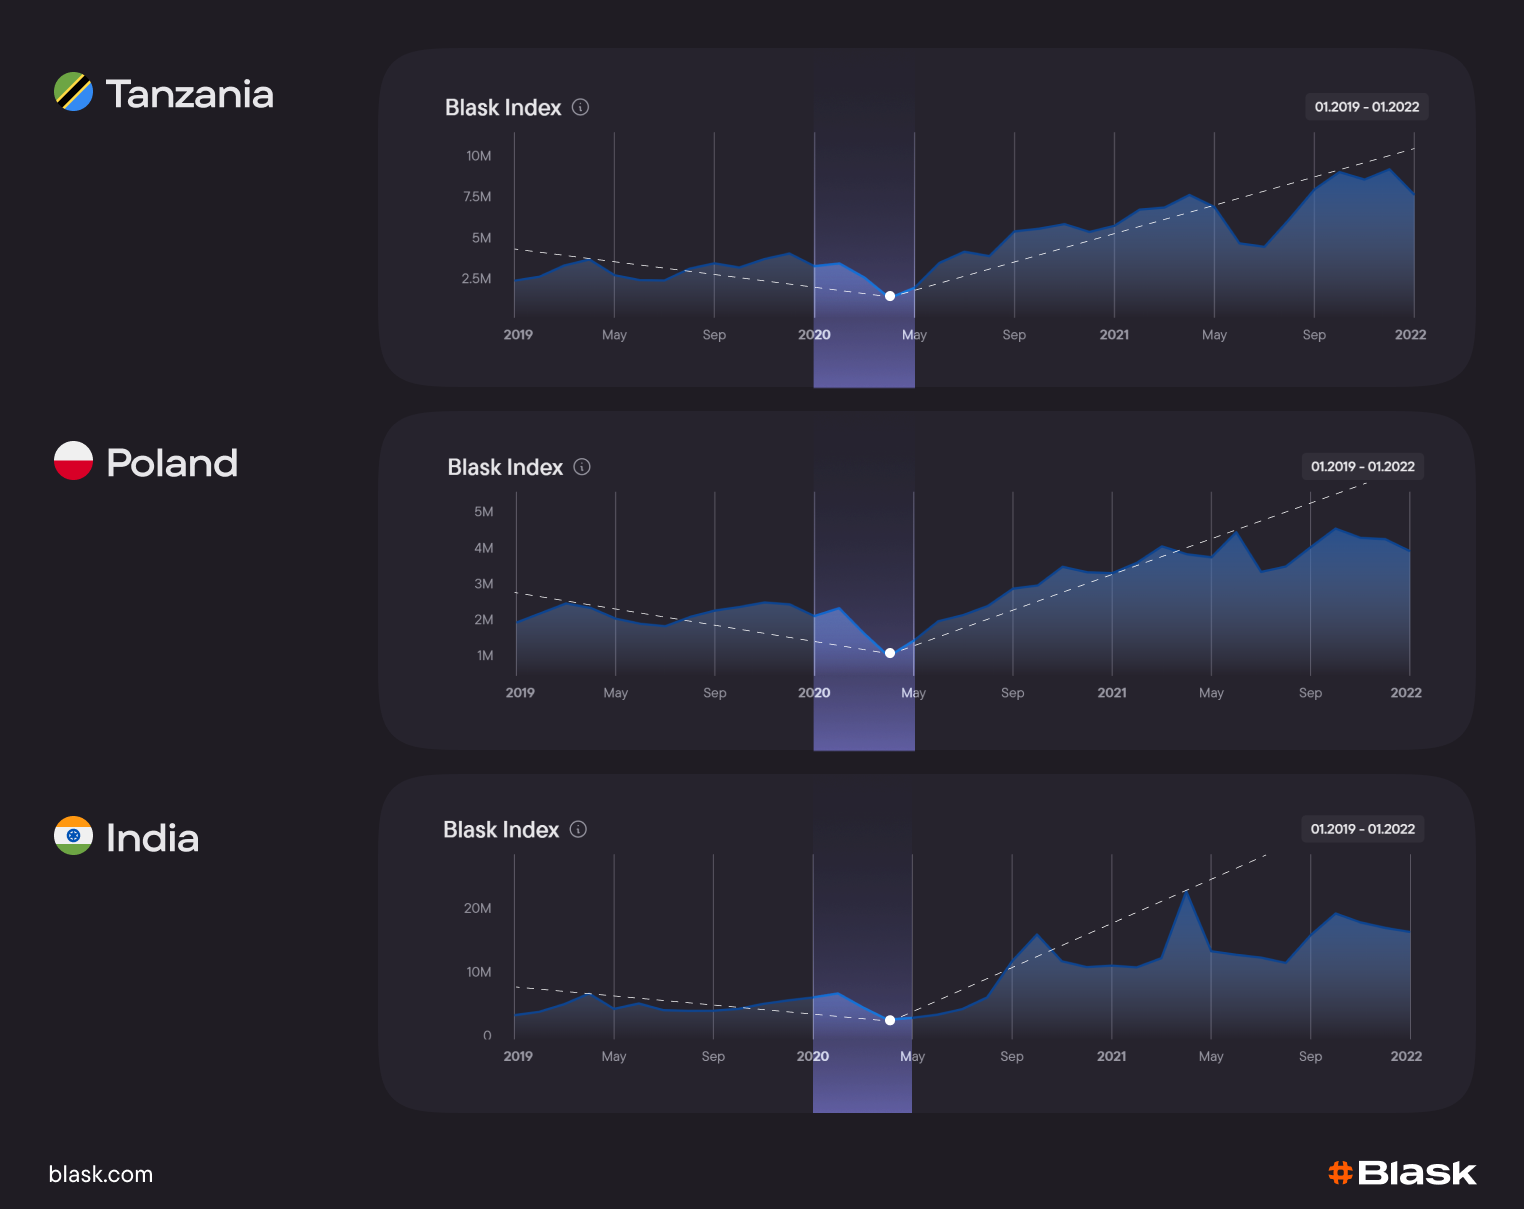
At Blask, we have observed a notable decline in interest in iGaming entertainment across various countries during the COVID lockdowns. Should something similar occur again, we will already have an understanding of what to expect from the market and can thoroughly analyze brand actions during that period to replicate the strategies that proved effective.
Learn from brand performance data
Blask collects data on all brands present in the country’s market throughout their entire existence. This enables you not only to track the dynamics of various brands but also to learn from their mistakes.
At the time of this publication, India is the country with the largest number of iGaming brands, where Blask has gathered analytics on 229 brands.
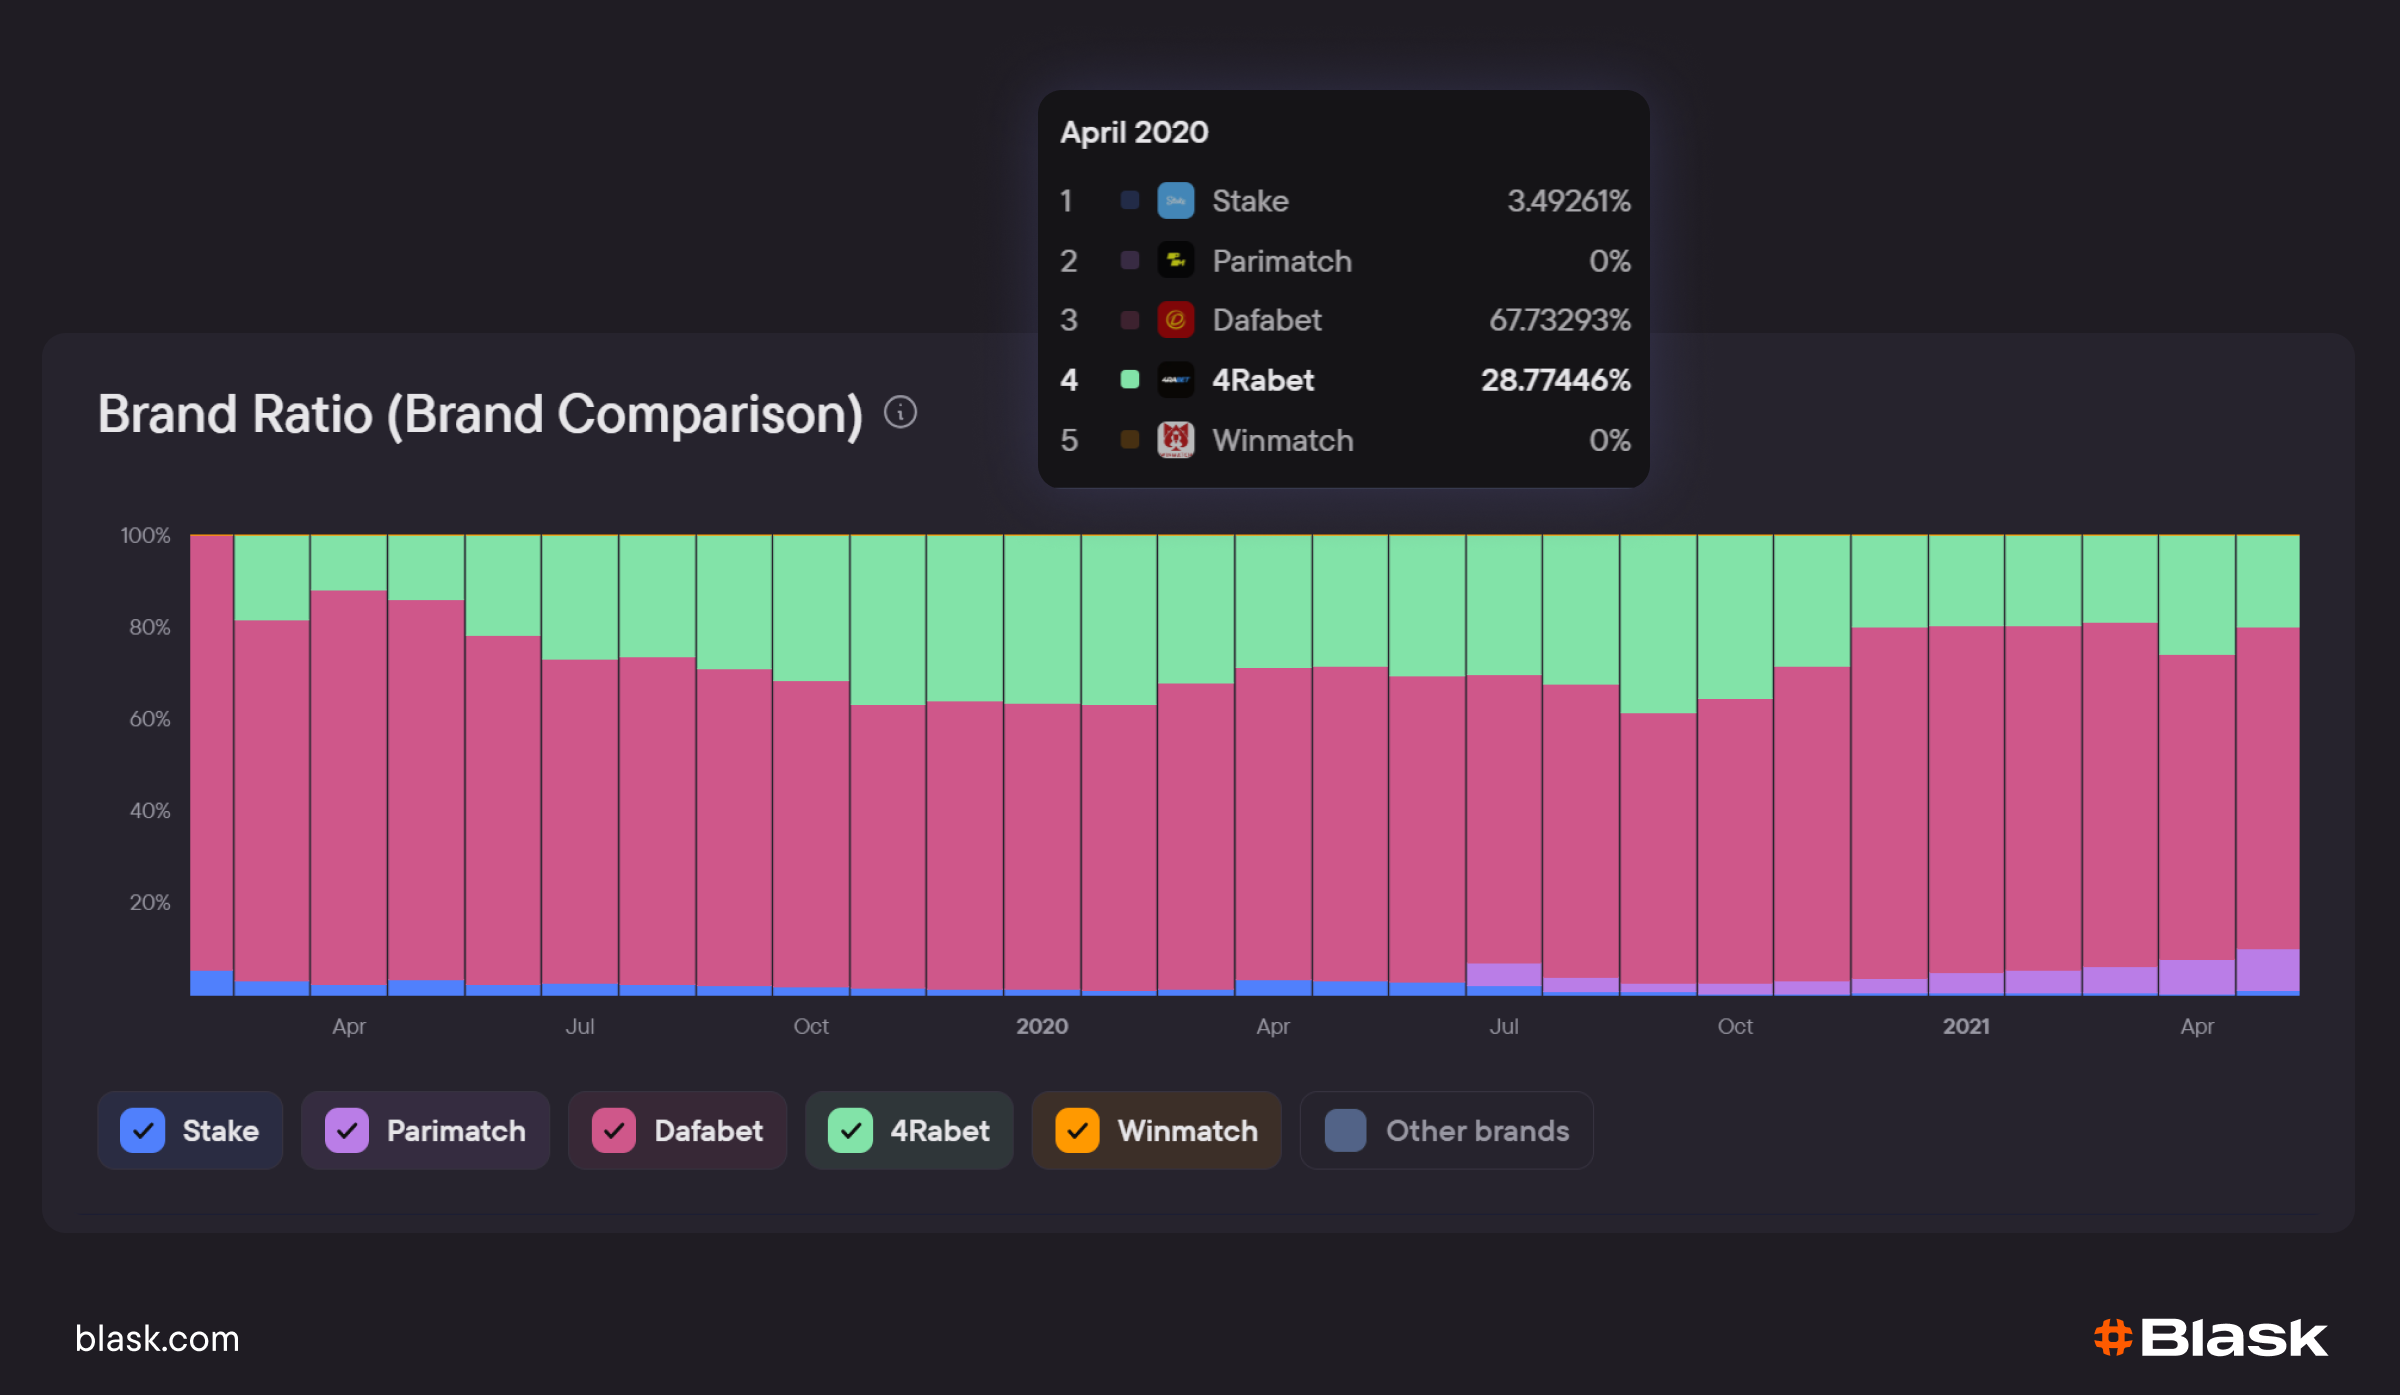
In India, at the beginning of 2020, we observe a sharp rise for the brand 4Rabet and a notable decline for Dafabet. Despite all the challenges posed by COVID-19, 4Rabet achieved something remarkable by capturing and maintaining market share during such a difficult time.
Seek out similar brands that have successfully navigated challenging circumstances, analyze their actions, and lead your brand to success.
Spot growth with Customer Profile data
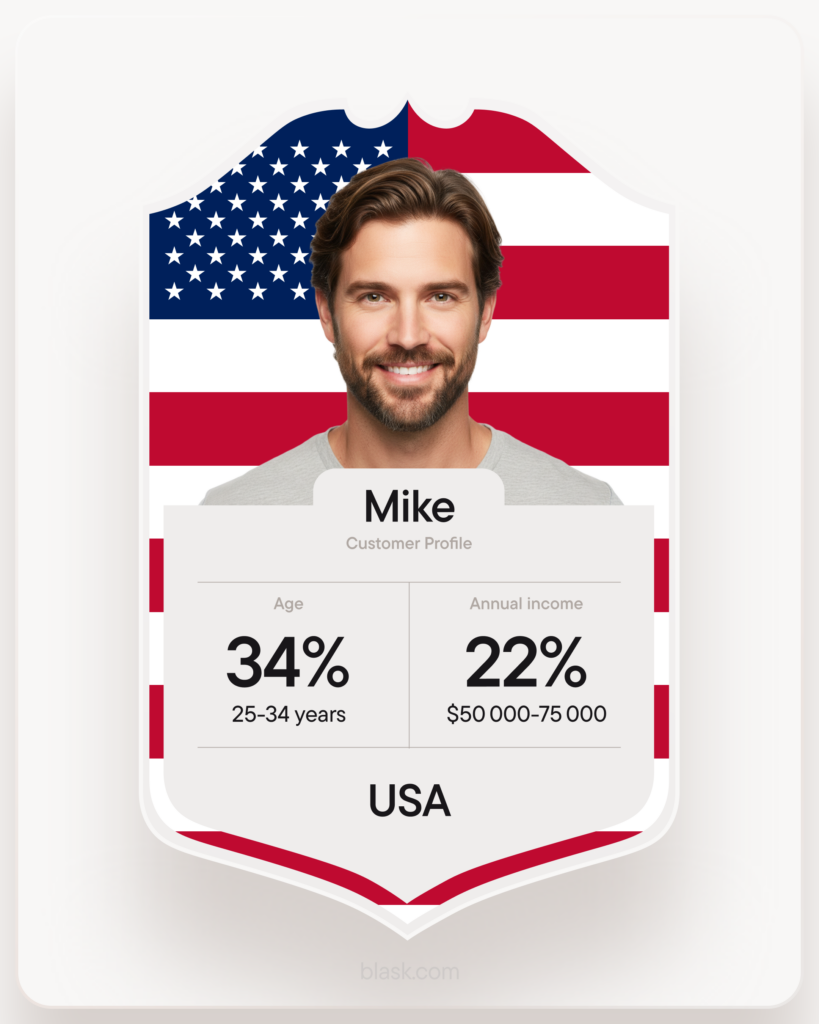
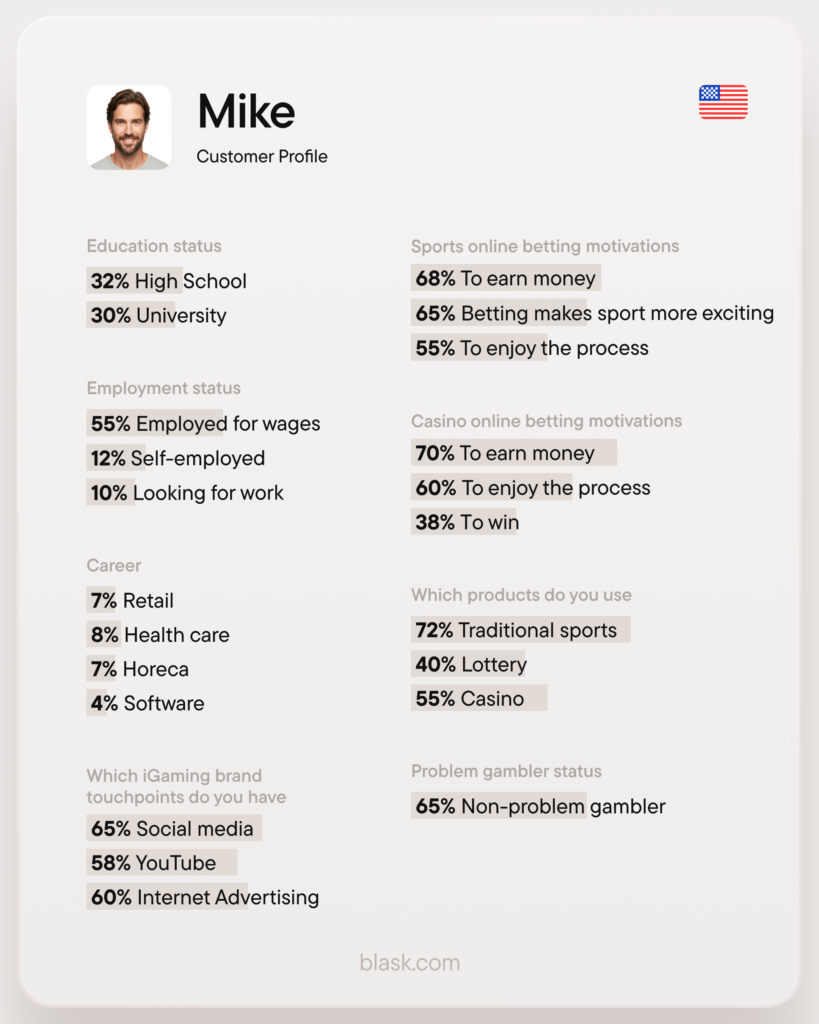
Blask Customer Profile reveals the characteristics of an audience interested in iGaming entertainment in a selected country. You can find data on age, income level, career, interests, and player preferences, as well as their motivations for playing and placing bets.
The complete picture: from signal to explanation to action
Here’s how the four tools work together across a typical market cycle:
| Moment | Tool | What you get |
|---|---|---|
| Market starts moving | Blask Index | Real-time hourly signal — you see the movement first |
| Is this a trend or noise? | Blask Trends | Growth / Stagnation / Decline classification with AVG and MED |
| Why is this happening? | Market Explanation | AI-generated brief with drivers, events table, and cited sources |
| Who is entering the market? | Customer Profile | Audience demographics, motivations, and preferences |
No more operating on instinct. Every boom and bust now comes with context — and a plan.