- Updated:
- Published:
Share of Search: a new metric for understanding market volume
Explore the power of Share of Search (SoS) as a predictive metric for brand health and market trends. Learn how SoS leverages Google’s vast search data for competitive analysis and market insight, offering a real-time view of consumer interest and brand performance.
Share of Search (SoS) offers a fresh perspective on online presence and brand health. Unlike traditional metrics that provide a snapshot, SoS tracks user interest over time, enabling predictive insights into brand performance and emerging trends.
What is Share of Search?
Share of Search (SoS) measures how often a brand is searched online compared to its competitors, reflecting its online visibility and consumer interest.
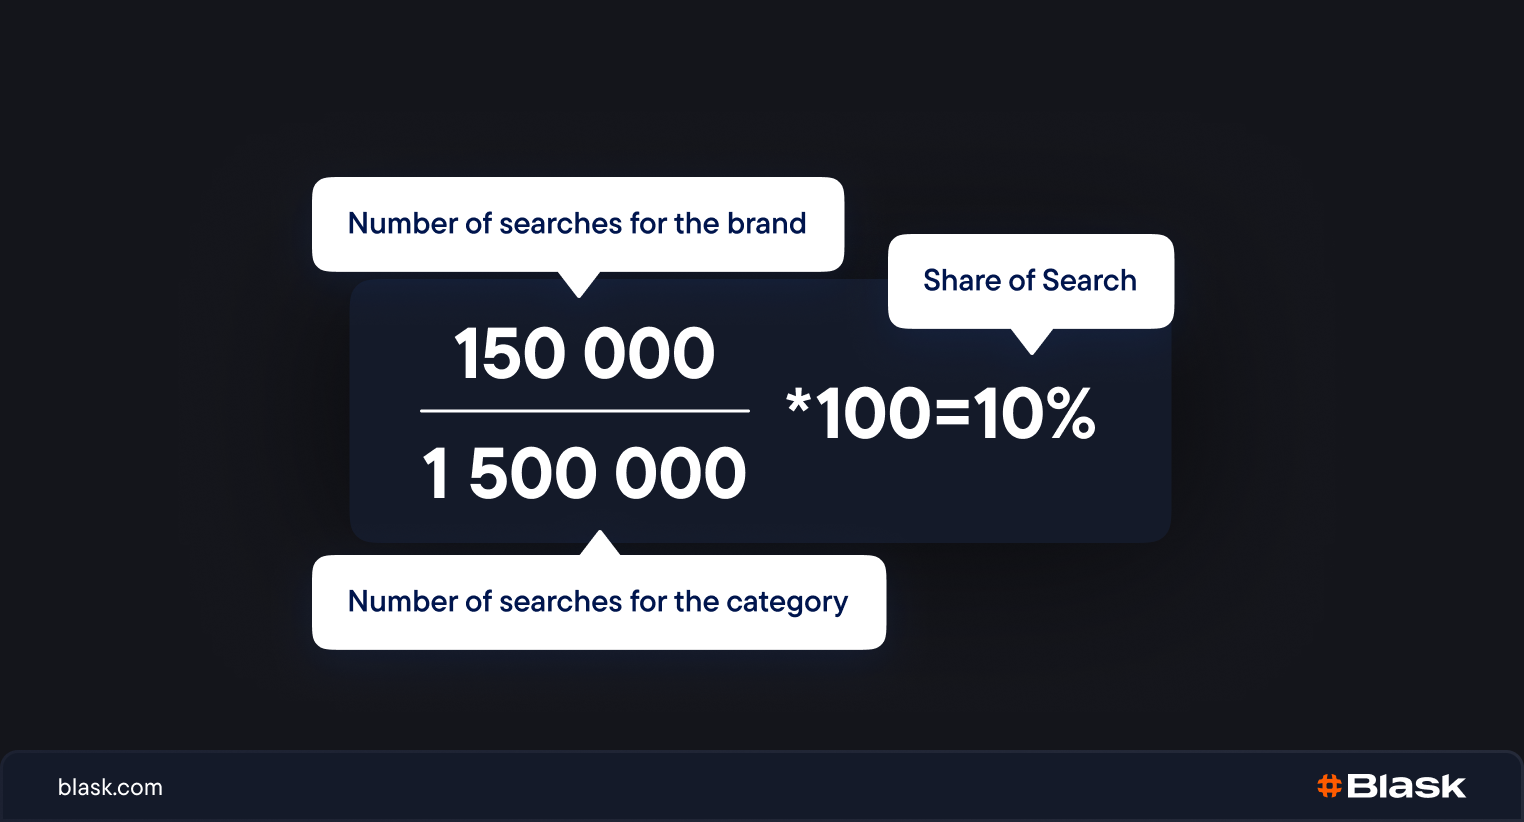
The Share of Search formula is:
Share of Search = (Number of searches for the brand / Number of searches for the category) * 100
At its core, SoS uses Google’s extensive search data to analyze consumer behavior. With over 8.5 billion daily searches, Google provides a wealth of insights into consumer interests. Share of Search utilizes this data to gauge a brand’s volume of searches relative to its competitors.
Who discovered it?
The Share of Search metric was introduced in 2020 by leading marketers from the United Kingdom, Les Binet and James Hankins.
This metric is now widely used by marketers across all industries and companies, and further in the article, we will provide examples to illustrate its application.
Why use Share of Search?
Traditional methods like surveys can fail to capture consumers’ actions and preferences, as sometimes people’s actions must align with their stated opinions. Financial reports are not always available or are accessible with significant time delays. Therefore, marketers need an alternative tool to measure market volume.
📈 The Share of Search metric has an up to 96% correlation with Market Volume.
Share of Search (SoS) offers real-time insights into consumer interest based on online search behavior. This approach offers a more direct reflection of what people are genuinely interested in.
The main advantage of Share of Search is its ability to be calculated for any time period. Unlike market shares traditionally determined through surveys or financial reports, which are often tied to a month, quarter, or year, Share of Search can be recalculated as frequently as every day or even every hour.
The predictive power.
Share of Search serves as a leading indicator and provides a glimpse into the future direction of market share.
The things people search for today can indicate what they will buy and engage with in the future. It’s essential to pay attention to these search trends to understand consumer behavior better. An increase in SoS typically signals an upcoming rise in market share, and a decrease suggests a potential drop.
Share of Search can predict a company’s market share, but the accuracy timeline differs by industry. According to Les Binet, in automotive, predictions are accurate 12 months in advance, and in energy, for 3 months. For other sectors, the timeframe ranges from a few hours to a year.
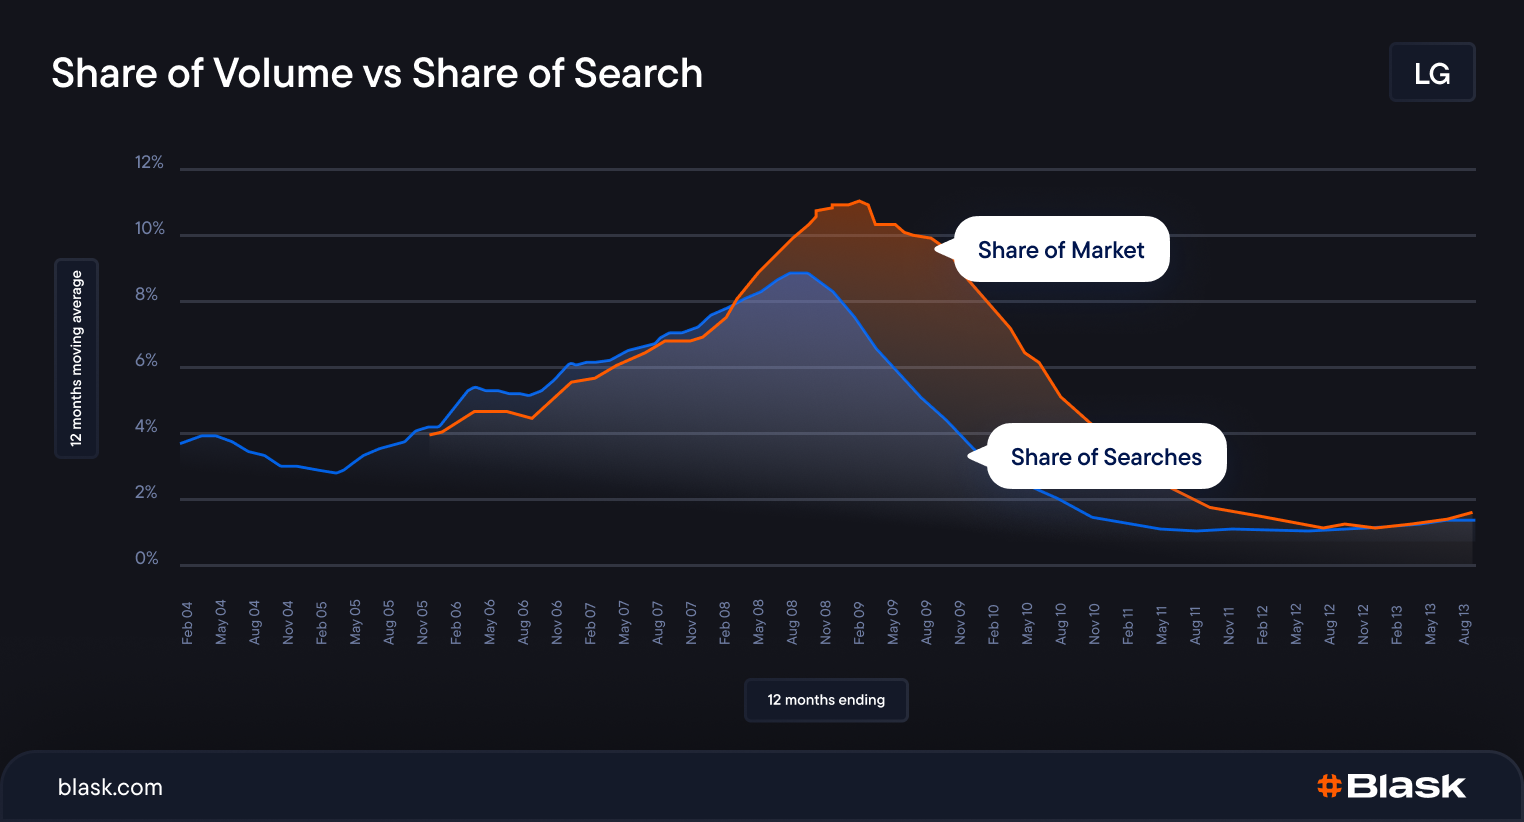
In the chart above, the Share of Search graph was overlaid onto the Market Share graph for LG smartphones, providing insights into the relationship between online search interest and market dynamics. The charts are remarkably identical, with a 6-month time lag.
Had LG monitored search share, they would’ve had six months to address the situation before losing smartphone market share.
💡 By tracking search share fluctuations in real-time, brands gain warning to capitalize on opportunities and correct course.
Share of Search as a performance indicator.
Share of Search (SoS) is a metric that reflects how effectively a brand turns online interest into sales.
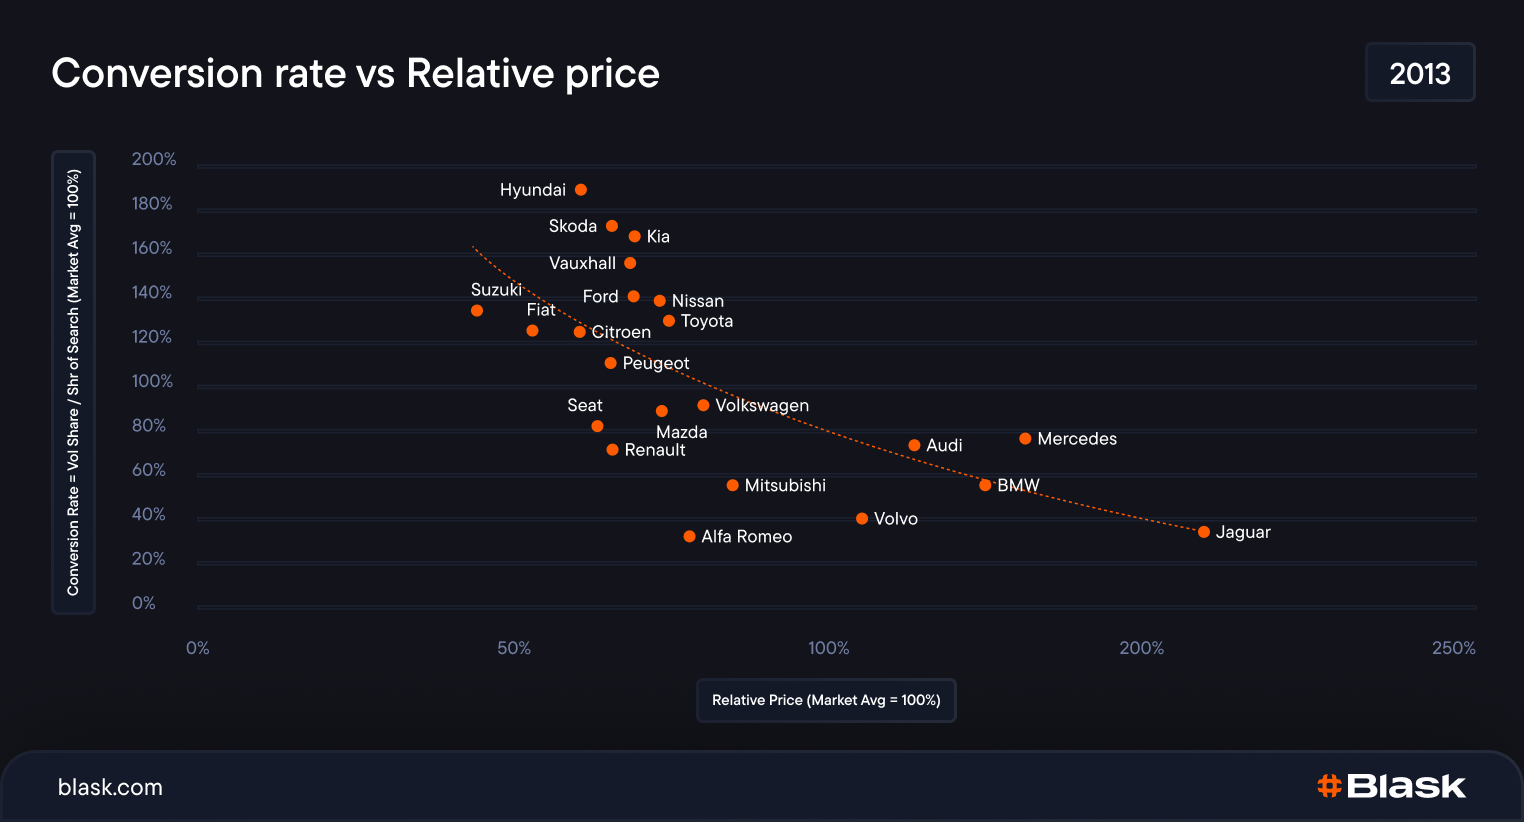
For example, in this graph, Mercedes’ search share exceeds the expected performance curve, indicating their market performance is notably strong. This could be due to a more efficient sales process, superior service, or a user-friendly website, among other factors.
📊 Share of Search highlights a brand’s effectiveness in converting online searches into customers.
By comparing search volume against market share, companies can pinpoint areas for improvement to enhance their conversion of interest into sales. This process enables them to address underperformance and eliminate bottlenecks, streamlining the path from initial interest to final purchase.
Share of Search highlights trends and opportunities.
Monitoring changes in the Share of Search can reveal necessary signals:
- An upward trend may suggest increasing consumer interest, successful marketing efforts, or emerging market opportunities.
- Conversely, a downward trend could highlight waning interest, heightened competition, or challenges in market positioning.
Monitoring these trends allows businesses to assess their market position, identify growth opportunities, and plan strategies to stay competitive.
Why SoS is not 100% equal to Market Volume?
Share of Search (SoS) doesn’t always equal sales, as many things can influence whether a search leads to a purchase.
Brand conversion barriers.
Despite people’s willingness to buy, some brands have a lower conversion rate due to barriers such as slow customer support, uninformative websites, or broken or inconvenient payment forms.
Want to know what influences the brand conversion funnel and how to improve your metrics? Check out our detailed article on the 5 stages of conversions!
Searches without a purchase intent.
People often search for things like Lamborghini or Rolls-Royce just to see cool cars, not because they plan to buy them. Some searches are made purely out of general curiosity without the intention of buying anything.
Exploration vs. evaluation mindsets.
However, the main reason lies in how people make decisions. Typically, one needs to explore all possible options first and then confirm their decision with additional searches. Depending on the industry, the duration of preliminary research can vary: sometimes people need only a few minutes to make a decision, while other times it can take up to 12 months.
These two mindsets reflect the different stages of a consumer’s journey and their impact on search behavior:
- Exploration Mindset: In the exploration phase, consumers broadly gather information about available options without a commitment to any specific brand or product.
- Evaluation Mindset: Contrastingly, the evaluation phase is characterized by a narrowed focus where consumers assess their shortlisted options in detail. Searches become more brand or product-specific as consumers look for reviews, comparisons, and detailed information to make an informed decision.
🔥 Despite the mindset differences, Share of Search doesn’t match Market Volume exactly, but both metrics maintain a strong and stable correlation at a high level, up to 96%.
Additionally, the correlation is affected by people who researched the market first and then decided they didn’t need the product or service.
What is the correlation between Share of Search and Market Volume?
Les Binet and James Hankins, who created Share of Search, found that after looking at over 30 studies from seven countries and 12 different industries, the average correlation is about 83%.
Specific industries show varying correlation percentages:
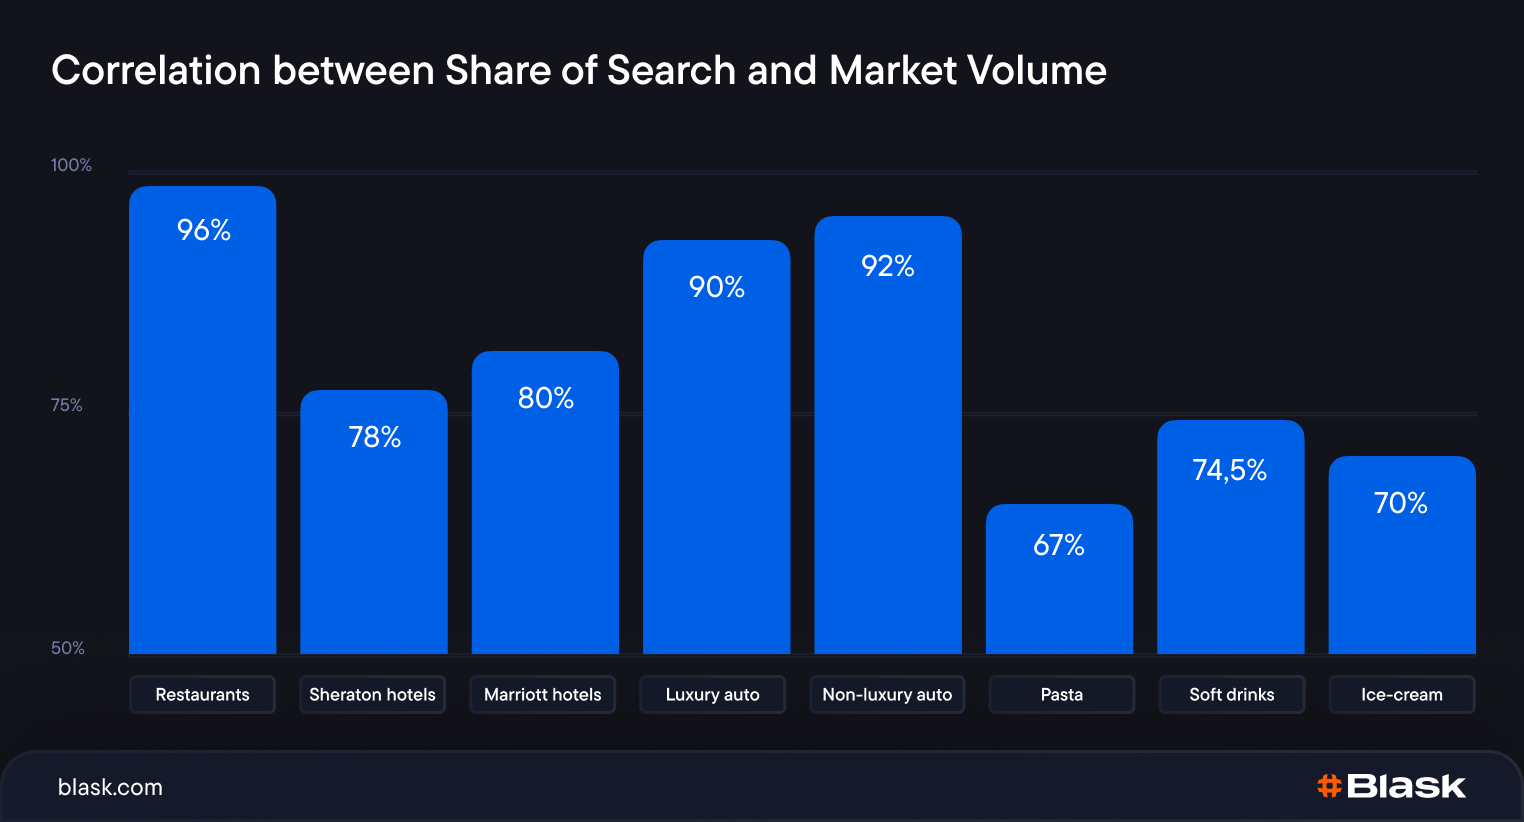
- Restaurants — 96%
- Sheraton hotels — 78%
- Marriott hotels — 80%
- Luxury auto — 90%
- Non-luxury auto — 92%
- Pasta — 67%
- Soft drinks — 74,5%
- Ice-cream — 70%
Also, Blask carried out its own research on the iGaming sector and confirmed a 95% correlation between the Share of Search metric and the actual market size.
📐 Regardless of the industry, Share of Search consistently shows a strong correlation with market volume.
Are there any weaknesses?
Share of Search has one major limitation. If a brand faces a scandal, more people might search for it, but that doesn’t mean they’re buying more of its products. For example, when Volkswagen had its emissions scandal, there were many searches but fewer sales.
It’s essential to account for events and emotional context, not just raw search volumes.
How Blask addresses this limitation of Share of Search?
Blask improves Share of Search by carefully choosing keywords that truly reflect what people are interested in. We focus on positive searches like “brand_name betting” and ignore negative ones such as “brand_name payout problems” or “brand_name scam” to get a clearer picture of market interest This method helps avoid misunderstandings about how famous or successful a brand is.
Thus, the only weakness of Share of Search can be overcome by selecting the right keywords to analyze.
🛠️ Based on Share of Search, Blask calculates its core metric, Blask Index. Check out this article for more details on how we gather and interpret data about iGaming brands.
How to calculate Share of Search?
To calculate Share of Search, look at search data to see how often people search for a brand or product compared to its competitors in the same category. Here’s a general approach on how to do so:
- Identify relevant keywords: Compile a list of keywords related to your brand and product category, including brand names and product types.
- Gather search data: Use tools like Google Keyword Planner, Google Trends, or others to collect data on search volume for each keyword. This data should show how often each keyword is searched within a specific time frame and region.
- Calculate Share of Search: For each brand in the category, divide the total search volume by the total search volume for all brands in the category. This will give you the Share of Search for each brand, usually expressed as a percentage. This figure represents the brand’s visibility in search queries relative to the entire category.
For iGaming analytics, Blask offers a specialized SoS tracking solution.
Harness the power of the SoS metric.
Share of Search provides insights into brand health and market dynamics via organic search analysis, acts as an early indicator of consumer behavior changes, and has demonstrated its effectiveness in predicting market share shifts ahead of financial reports.
While no metric is flawless, the limitations and drawbacks of Share of Search can be effectively mitigated either by analyzing the correct search queries or by correlating the results with world or industry events.
The robust and strong correlation between search volume and market share allows marketers to assess the effectiveness of advertising campaigns easily and swiftly.
Given that Google provides data across all brands, countries, and categories for any time period, it enables a comprehensive analysis of not only your market share but also that of your competitors and the dynamics of these shares over time.