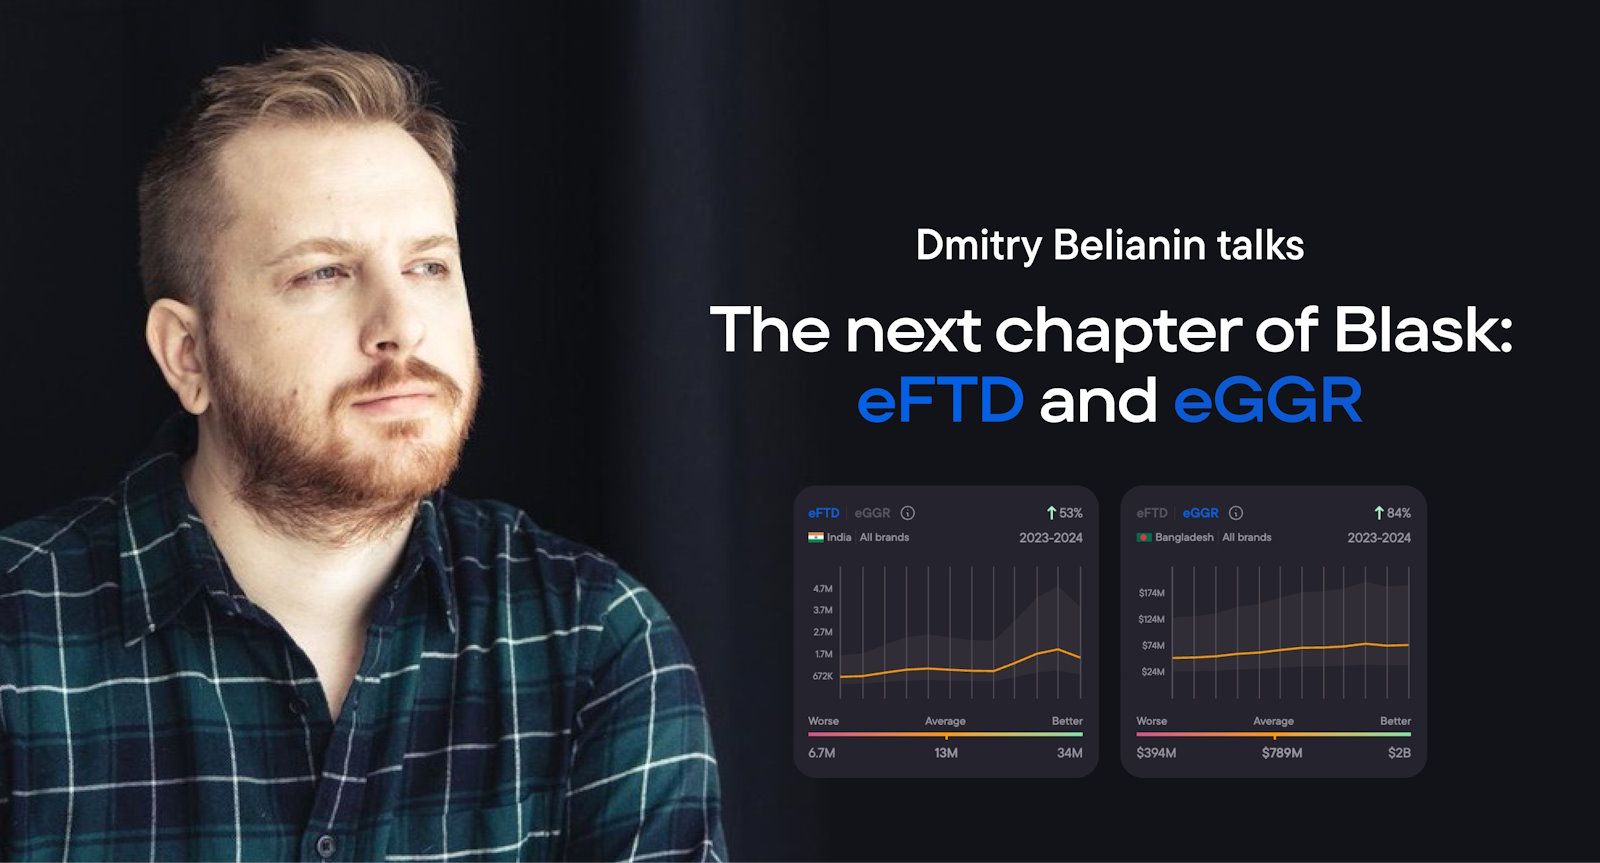
The next chapter of Blask: eFTD and eGGR
Blask's journey mirrors giants like Apple, from an idea to an MVP. Now, Blask AI aims to revolutionize iGaming. With eGGR and eFTD, we use advanced parameters for accurate insights. This is just the beginning—Blask AI will redefine our industry.
All of the world's biggest businesses are built in stages. It’s crazy to think, but even the world’s biggest, most legendary companies, like Apple, went through the growth stages that Blask is going through now. First, they begin with an idea, which is essentially an electrical impulse in your brain. Then, the concept is formed by a group of people before it evolves into something of substance, the MVP. Finally, you release your idea to the world in your Beta phase to refine your creation with real-world feedback.
For Blask, it was a beautiful moment when we hired a team of maths engineers to turn the concept into the MVP because we saw the potential of what we had theorised.
This was done by hardcoding the formula with many variables, using millions of data points from open-source intelligence data, third-party data, and regulatory and public company documents.
We’re now working on a groundbreaking algorithm to process this data more accurately. This is groundbreaking for both Blask, and the entire industry. Its codename is “Blask AI”.
So, I wanted to share a huge update because I view this technology as having the ability to change our industry. Whether you’re a partner or working within the industry, it will impact how you operate in the future.
To explain why this is groundbreaking, I’ll start from the very beginning.
This is how it all started. An idea and a metric.
The idea behind Blask was simple—to create a way for the iGaming industry to understand, measure, and evaluate markets and brands, games, sports, and any other moving parts of the industry.
To do that, Blask Index was created. It was a brilliant idea that our co-founder, Max, came up with. To recap, Blask Index is a pivotal industry metric akin to the Nasdaq Composite and Dow Jones Industrial Average for the US stock market. In order to do this and create a metric that is measurable and understandable, we created a set of formulas:
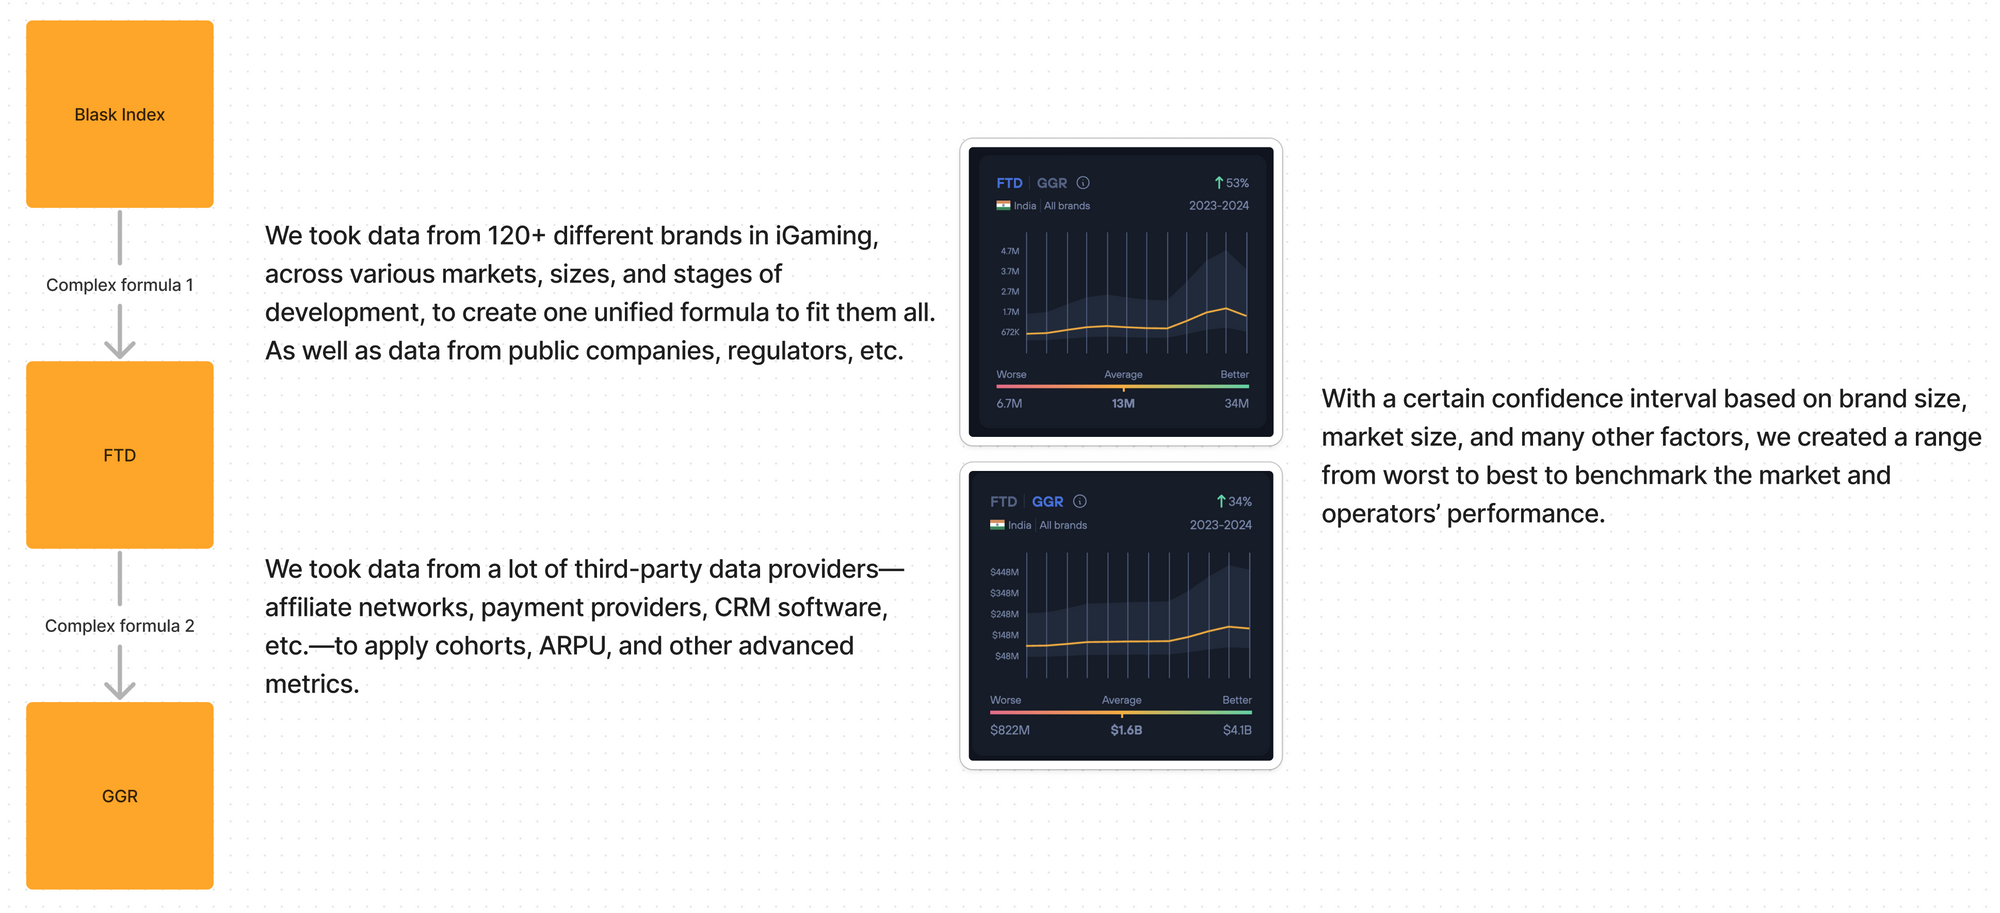
As you can see from the image, this is what our approach initially looked like. We called it a MVP for our approach. The MVP was quite accurate in this case, but it wasn't enough.
We heard different opinions — people were saying, “Wow, our data is so accurate,” and some were saying, “Guys, you're totally off.” I always felt GGR is the wrong name as this is way too straightforward and gives the impression that we’re obtaining this metric as primary data rather than calculating a benchmark.
I ruminated on how to solve this problem until Max shared the results of our first AI research which he had been conducting in the background. Immediately, I thought, “This is it. We need to apply it to GGR and all of our calculations”. I am still an AI newbie, even though I’ve consumed 10s of hours of AI lectures. Max understands AI at a depth far greater than me. So, I can’t properly explain the tech behind it. I am a business and commercial guy, right? Haha!
So, the moment I realised we could create an all-in-one, all-seeing, all-knowing personal AI, we started the process of education. But please, be gentle. This is still an early version of it, but we found its very first application—and this is it.
Ready? Let’s do this.
(I feel like a mad scientist opening up my lab to the outside world for the first time to reveal a monster. Don’t be scared—please come on in.)
Presenting:
Estimated Gross Gaming Revenue and Estimated First Time Deposits (or eGGR / eFTD as it shall be named from now on)
Let me call it a first step. Let me call it an MVP. I don’t want to make any loud statements as it's still a work in progress. I hope that the industry will contribute, as I have been pushing this on my LinkedIn for a while.
But I want to say that this is something the industry has never seen before—an approach that we probably invented, and I want to present it here.
So…
My team will probably create beautiful images afterwards, but for the sake of this announcement's fast publication, we will use my Figma cave-man drawings.
Compared to before, you can see how the formula is becoming increasingly advanced. It uses the “Blask AI” I mentioned previously. Blask AI actually deserves another whitepaper, because as I said previously, this is just one application of Blask AI. I’d estimate it’s just a tiny fraction, maybe 1% of what it’ll be capable of.
But let’s start from the very high level.
We created the initial formula, which was complex. It used cool things like linear regression, time series analysis, Bayesian inference, and the Cobb-Douglas production function.
But it wasn't enough for us.
So, we created Blask AI, which knows all the regulatory data, every brand’s market dynamics, sports events, books, gambler psychology, and user behaviour—EVERYTHING. It understands these things better than OpenAI. It’s still too early to show in detail, but you will know first—probably in August.
(And I already bought the “blask.ai” domain - please don't bother 🙂)
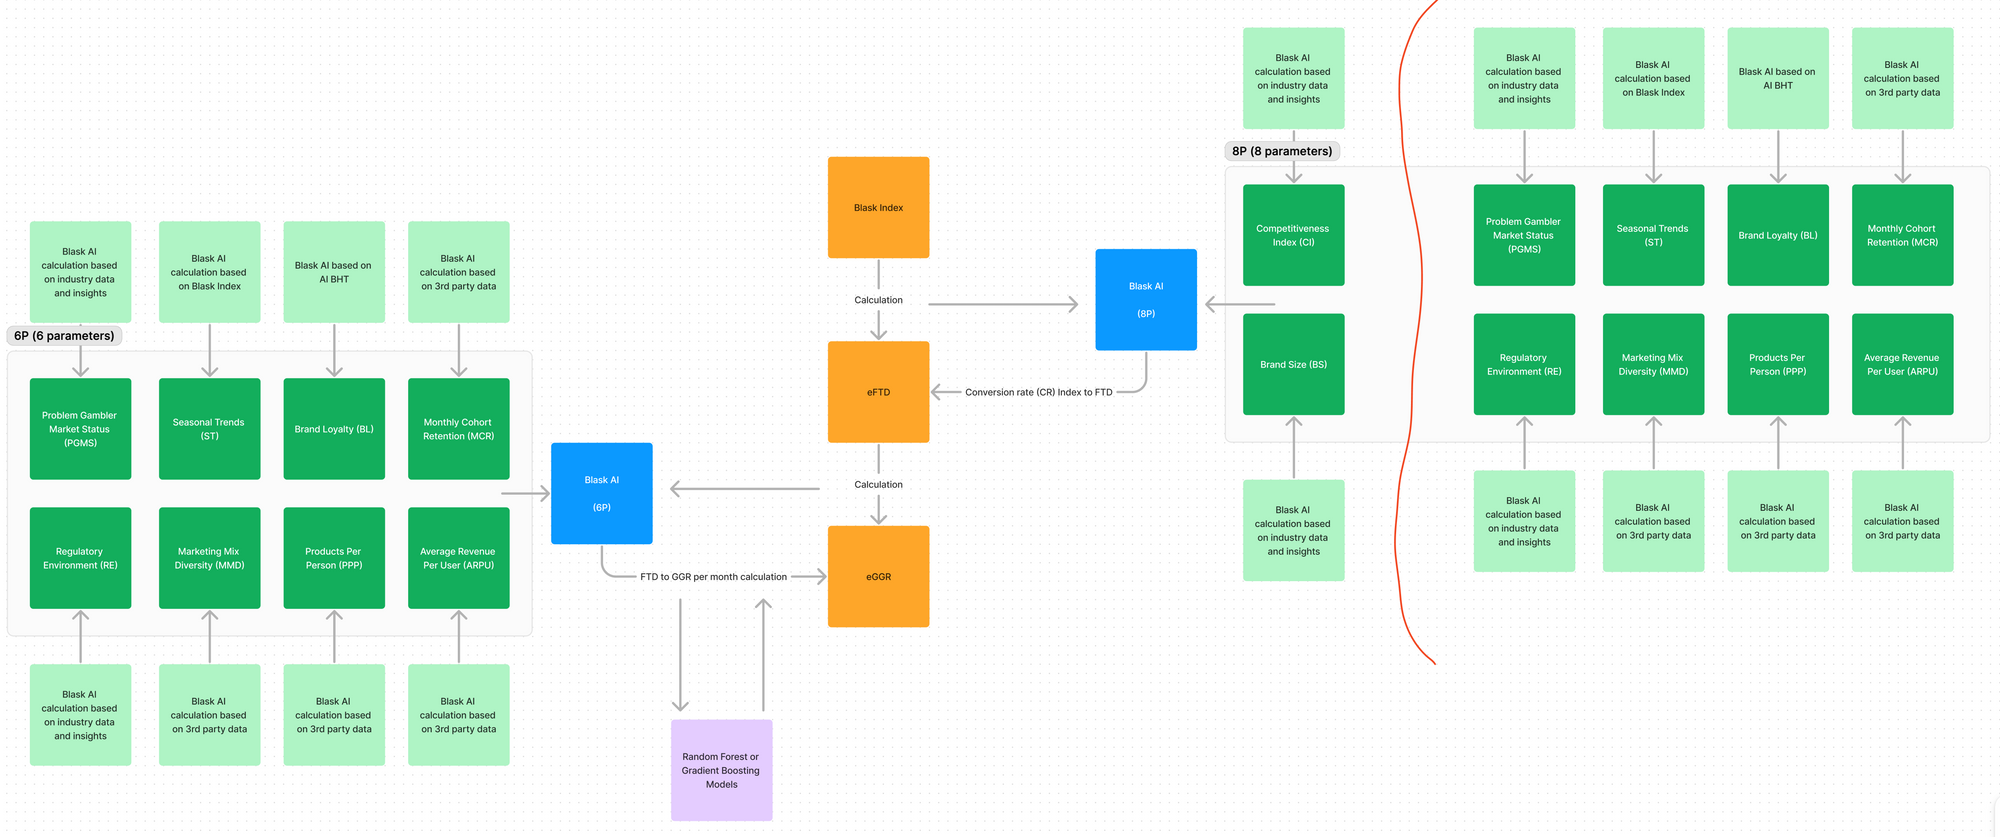
Blask AI, based on whether it’s calculating eFTD (sounds cool, right?) or eGGR, uses a set of inputs and parameters we’ve defined to refine the output. These are based on our calculations and the most important metric we have (and hopefully the most important metric for the industry soon)—Blask Index.
These parameters, based on whether its calculating eFTD or eGGR, apply different coefficients, weights, etc to ensure the parameter is used correctly. The model has all the knowledge and inputs to transition it on the go.
Currently, its 8P (8 parameters) for eFTD, and 6P for eGGR. After some time, I can say that maybe this will be 12P or 222P, I have no idea, we’ve just started. And as I said earlier, I hope that industry will contribute to the number of parameters we have to refine this further.
I want to build this in iterations to obtain the most reliable confidence interval of all time.
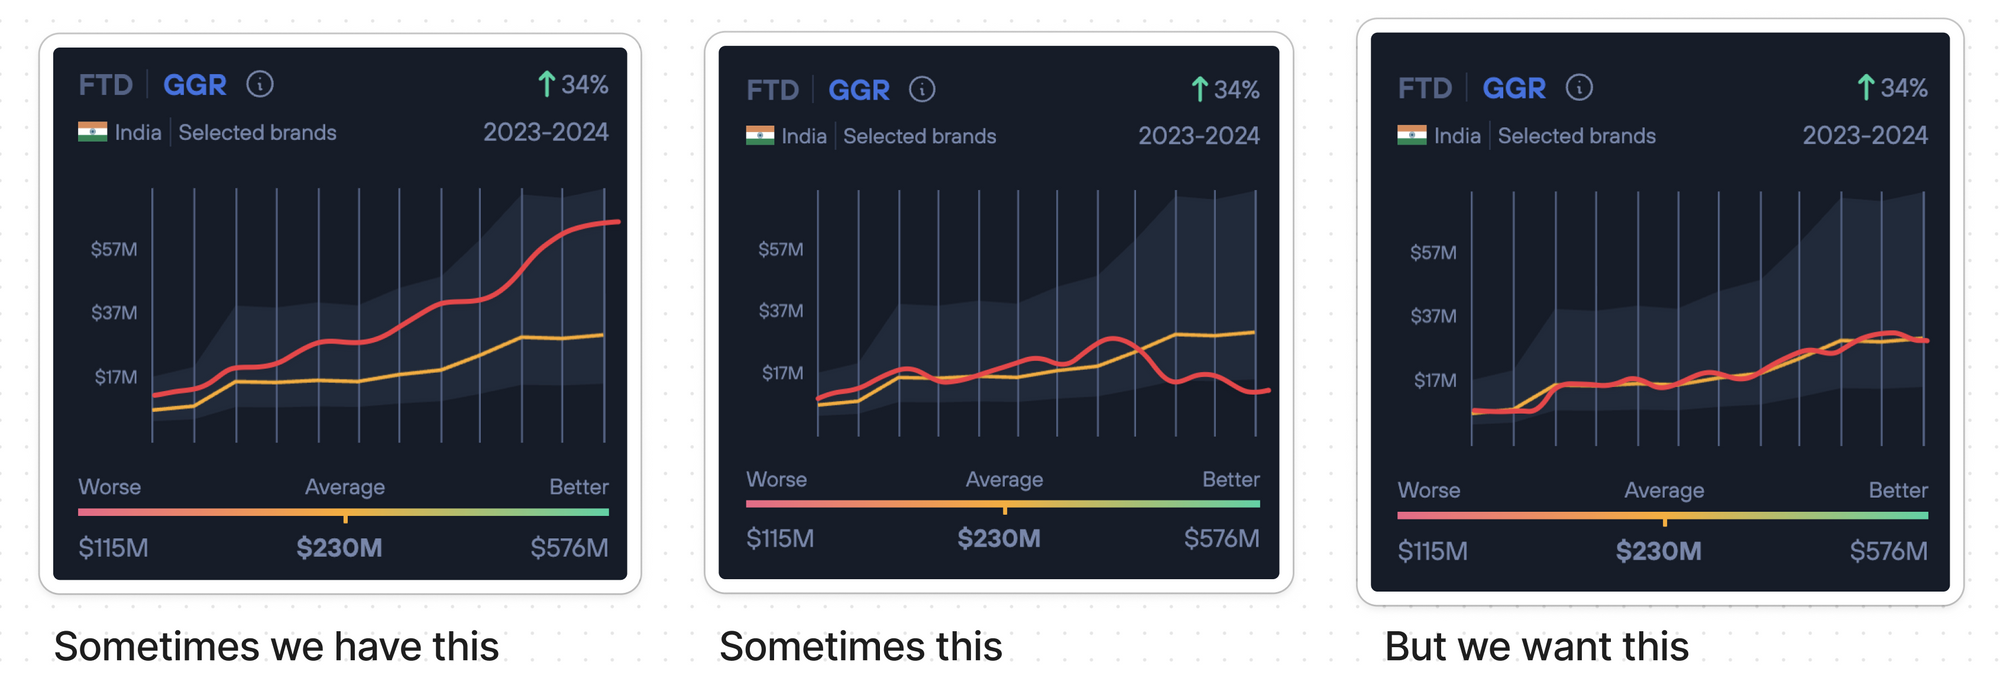
(Red shows the brand’s real GGR, yellow the estimated)
As you know, our industry has used many tools, such as SimilarWeb, Semrush, and Ahrefs. But they’re are all very inacurate. We are too sometimes (or often). And I want us to be as accurate as possible as our tool becomes smarter, and we increase our access to data.
So, let’s talk about the parameters we came up with and why they are so important.
8 parameters to start with.
Now let’s zoom in.
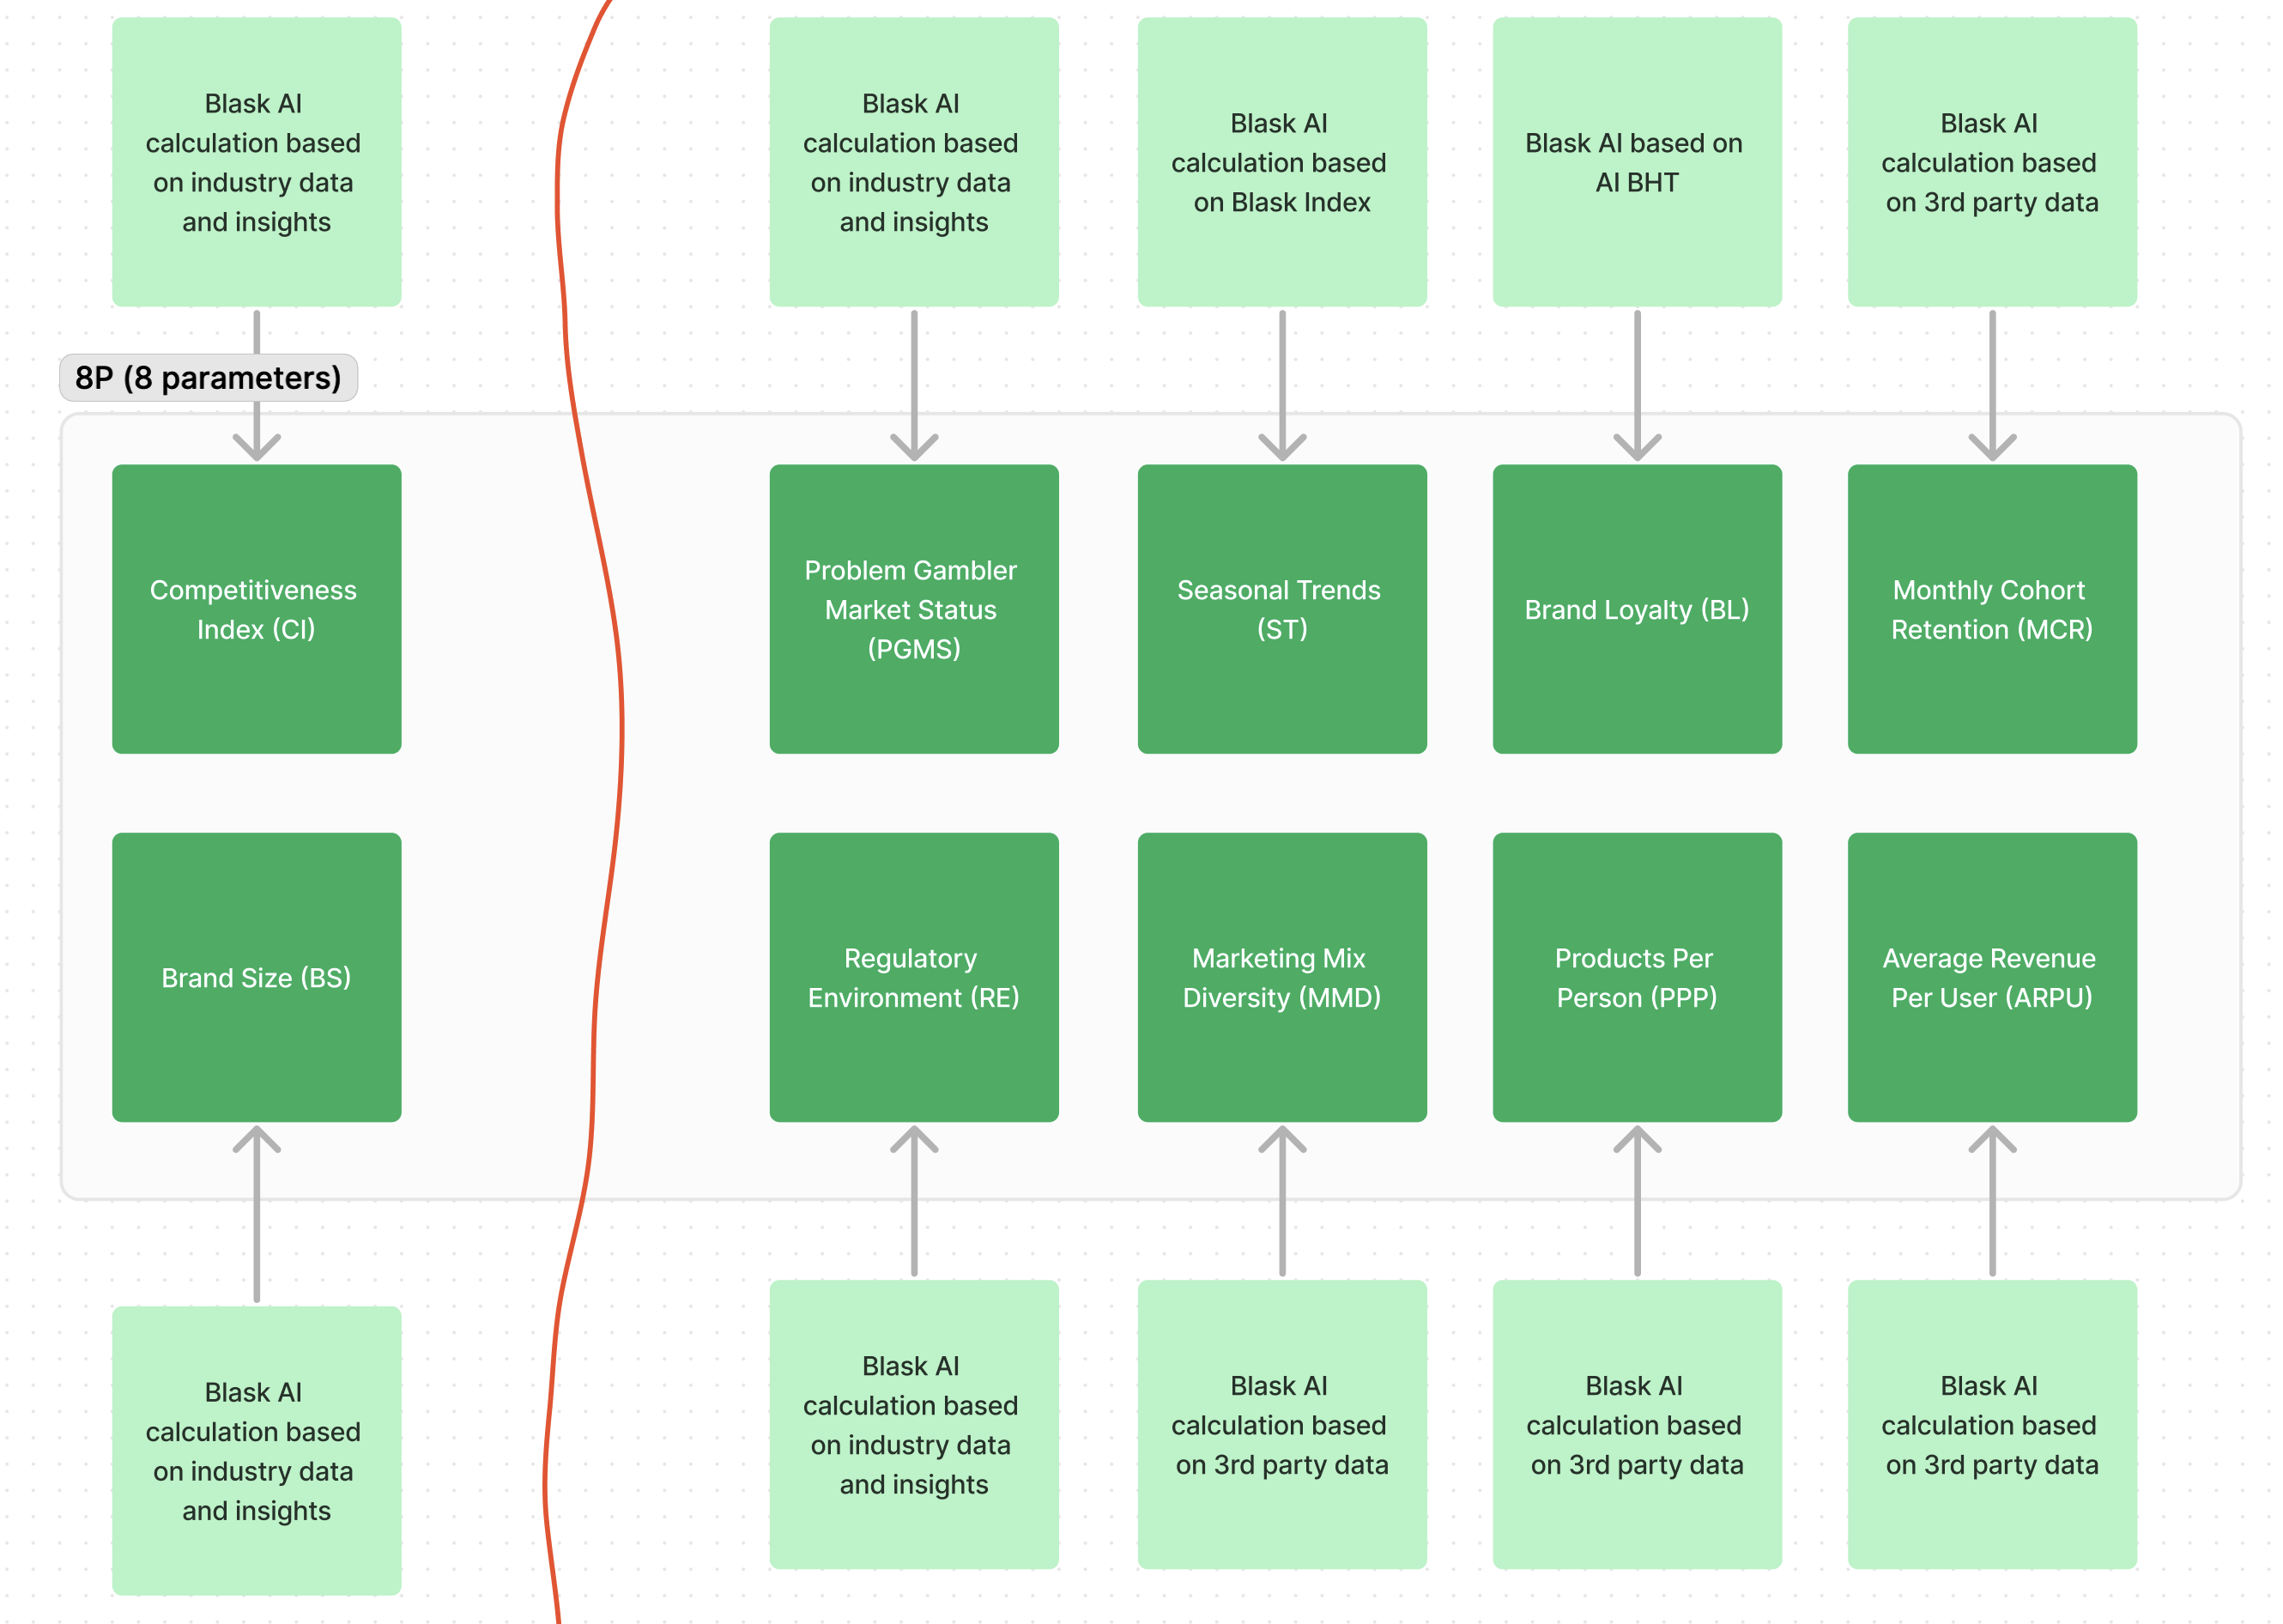
I’ll go one by one. Behind each of these parameters lays a complex calculation formula with tens or even hundreds of inputs, but I will try to make it sound as easy as possible.
Competitiveness Index (CI) - This is the Blask AI calculation based on industry data and insights, one of the key metrics in the calculation. We take into consideration how big the market is, its dynamics, how many brands there are, and whether there’s a big dominating brand - because fighting its market share is a tough job based on econometrics. Also, the size of the category and the speed of growth of the category. Category is something we haven’t released in the product yet, but we’re already using this in our calculation models.
Brand Size (BS): This is the Blask AI calculation based on industry data and insights. The brand size in terms of market share and its Blask Index score as it’s also one of the most crucial metrics reflecting the number of first-time depositors. The bigger the brand—based on the market—the better or worse it can convert.
To give you a few examples here:
Nigeria. The market has not really grown in the last few years in terms of its total size.
Bet9ja’s dominant market share is declining due to the new market entrants who are aggressive and more dominant in certain marketing channels.
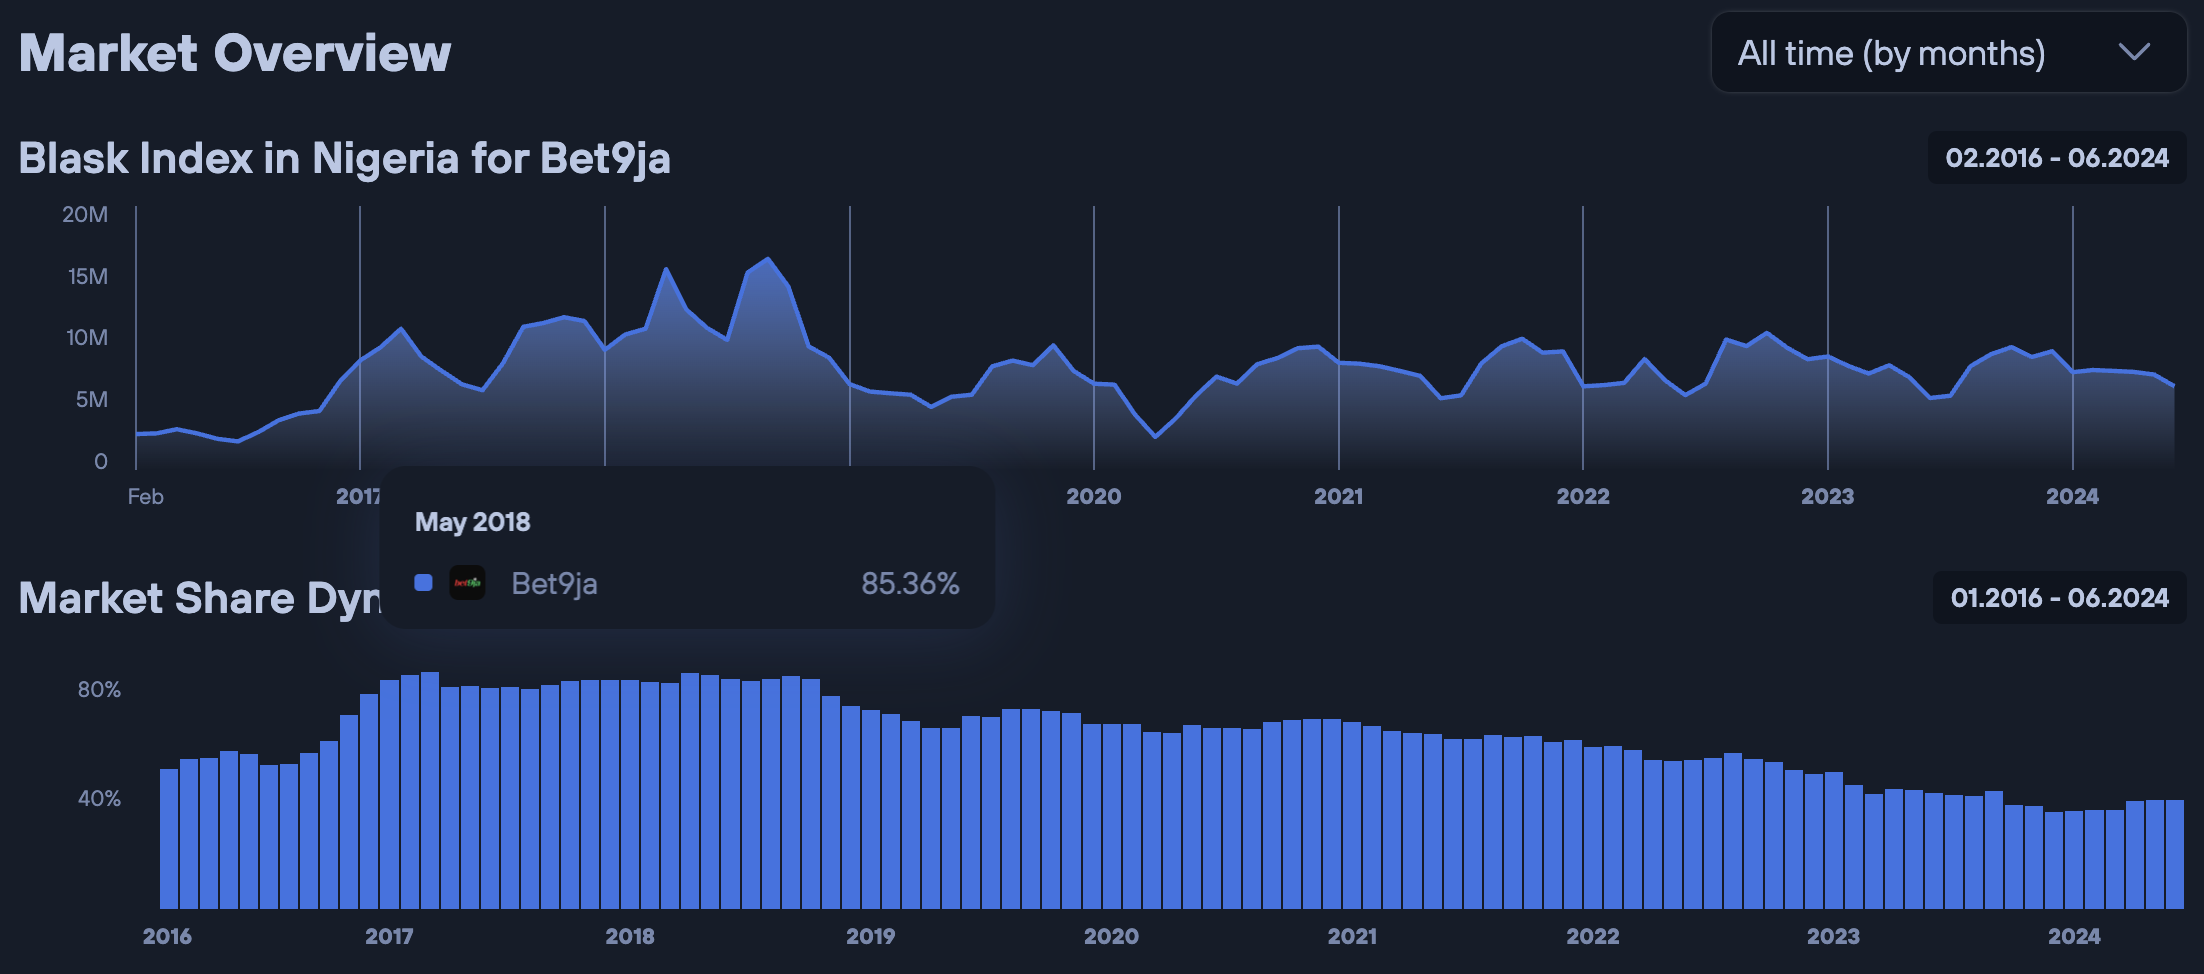
Does it mean that Bet9ja will convert better from Blask Index to FTD because of its dominant market share? Nope. The market is stable, and they’ve probably acquired a lot of new players. Plus, their database is huge. It means in this specific market (Nigeria) the conversion from Blask Index to FTD, the parameters in our formula and their weight based on the Brand Size, will be less than in the other market below:
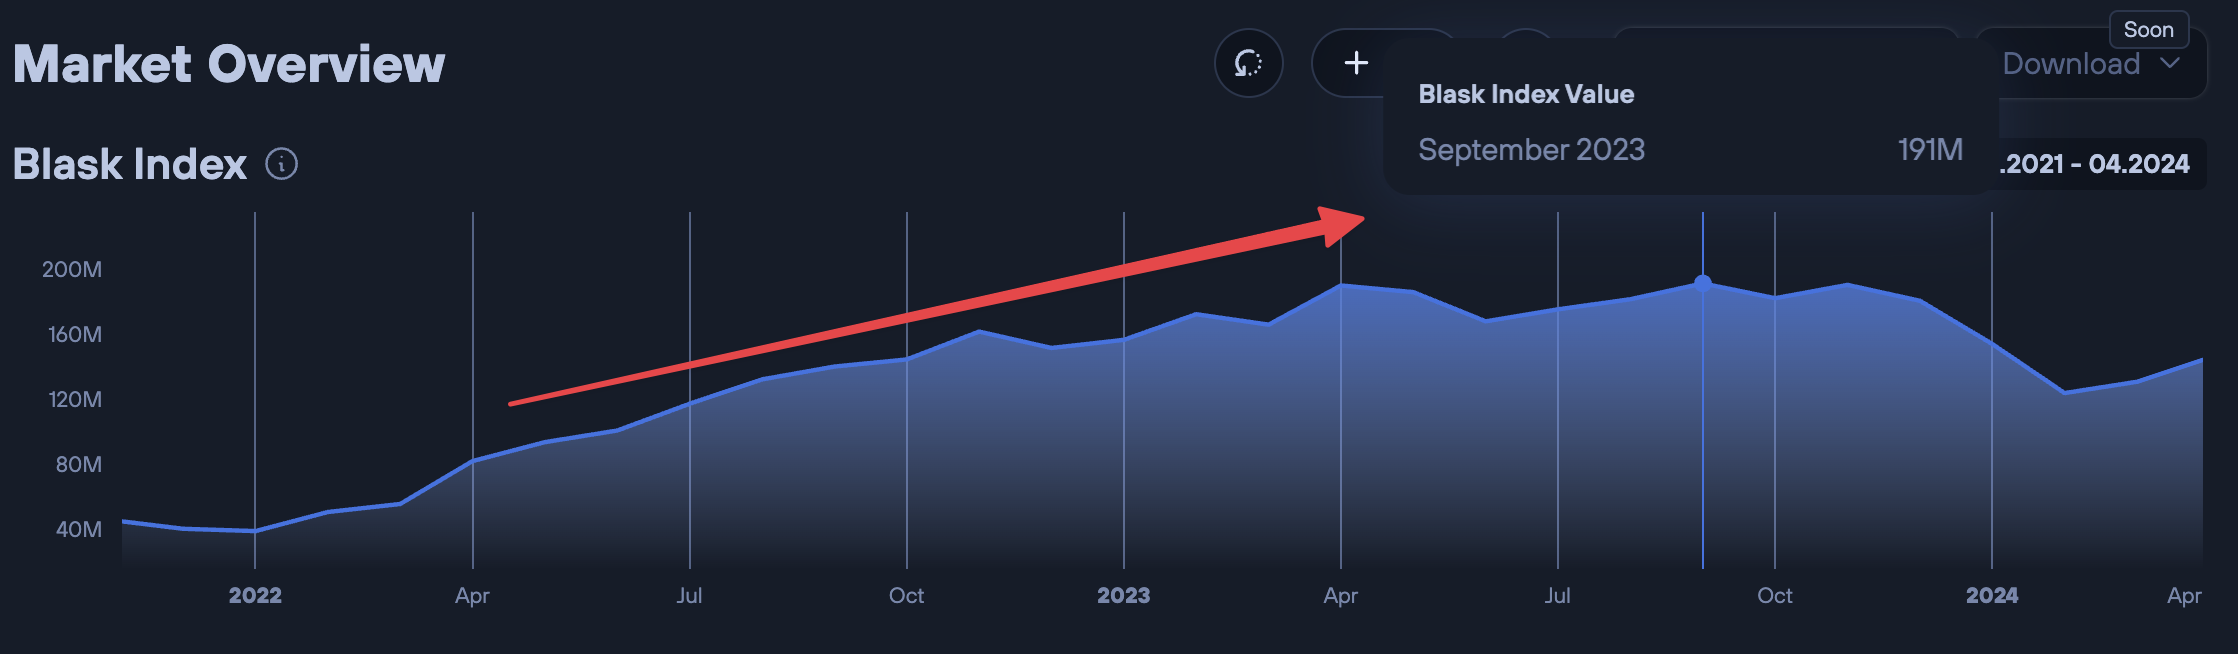
The dominant brand is converting like crazy due to the market’s growth. We take all sorts of calculations like this into consideration with the help of our AI model.
Problem Gambler Market Status (PGMS): This is a Blask AI calculation based on industry data and insights. A metric closely tied to the regulatory issues in the market. Market nature, demographics state, and economics of the countries also.
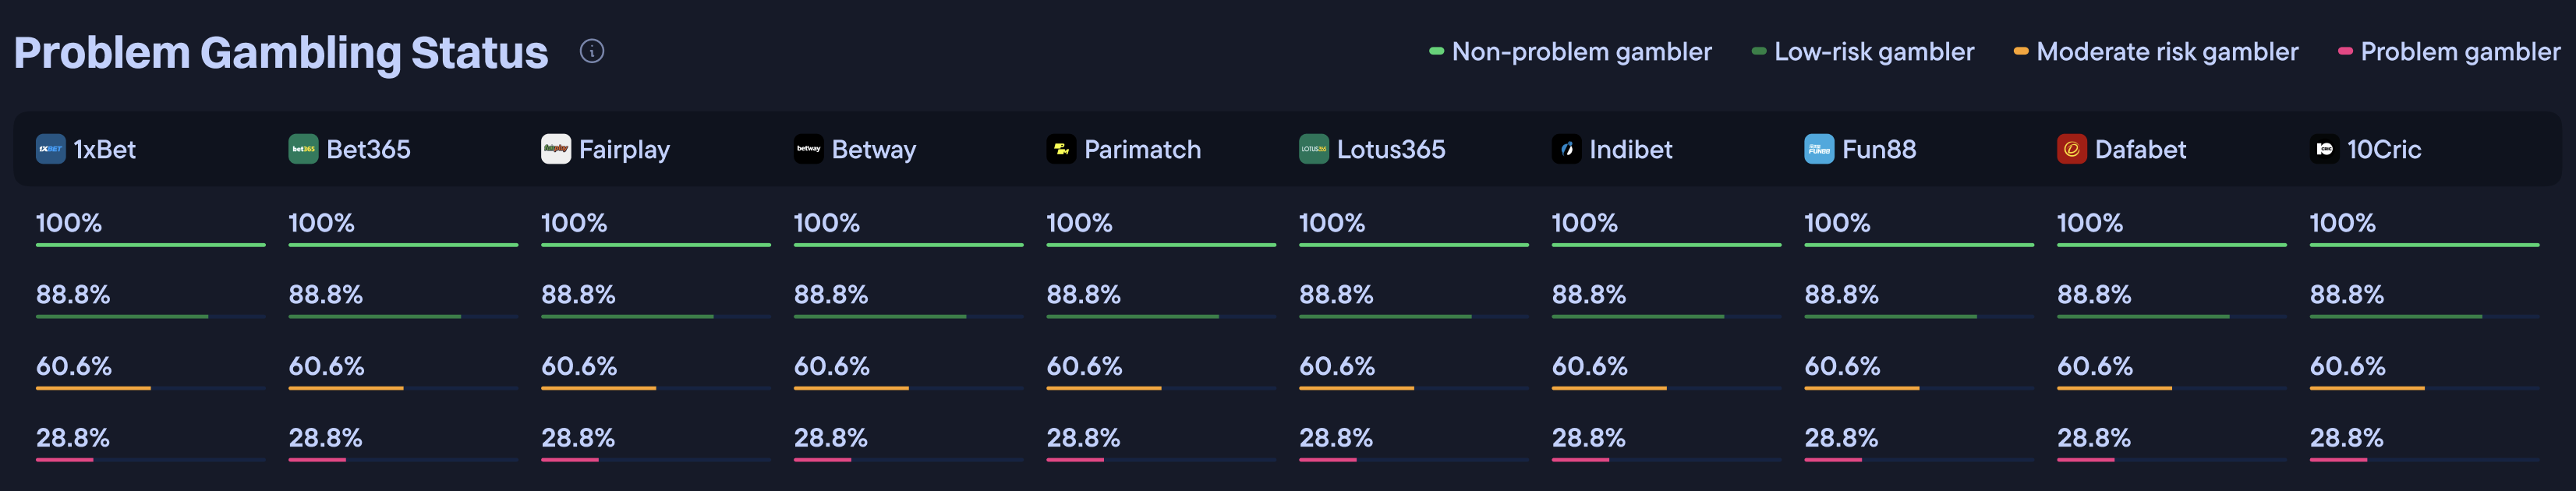
It’s also one of my personal favourite metrics. It’s very important for our industry. Right now, it’s at a very early stage, but we have plans to go very deep for this one specifically. It will be fully driven by AI + third-party data from our partners.
Seasonal Trends (ST): Another Blask AI calculation based on Blask Index. It’s closely tied to PPP, a metric explained below because if the market is heavily dependent on sports, the “off-season” will hit hard and decrease the conversion. It also includes holidays seasons, and many other fancy inputs.
One of the biggest examples (India):
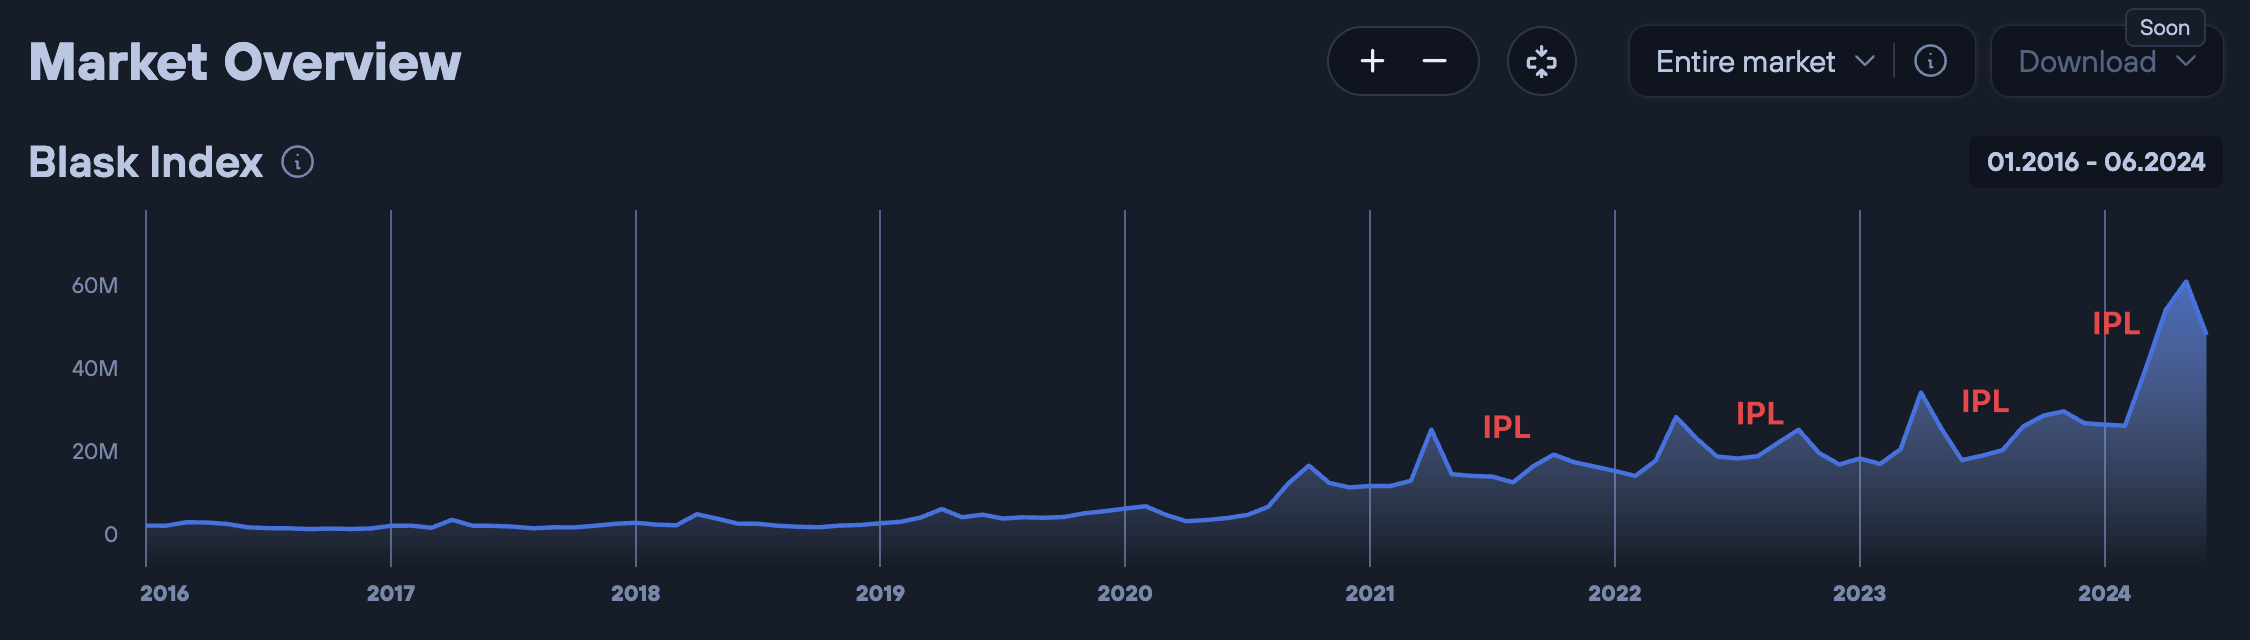
The Indian Premier League is literally one of the world’s largest sports events in terms of its influence on sports bettors’ behaviour. You can clearly see massive spikes and user stickiness afterwards. I love the spike in 2024—you can read why this happened in my essay here.
Brand Loyalty (BL): Blask AI calculation based on AI BHT - Brand Health Tracking is a very complicated set of research we are running, driven by AI and previous surveys. Sometimes, people can be loyal to a brand before becoming a customer. Yes, this is a facet of human nature, driven by the advertising, creatives, and narrative a brand is publishing. You can read more in my essay about the codification here.
In short, this metric is used differently for the 8P and 6P calculations. In this instance, it affects conversion, but in 6P, it impacts retention, ARPU, and stickiness.
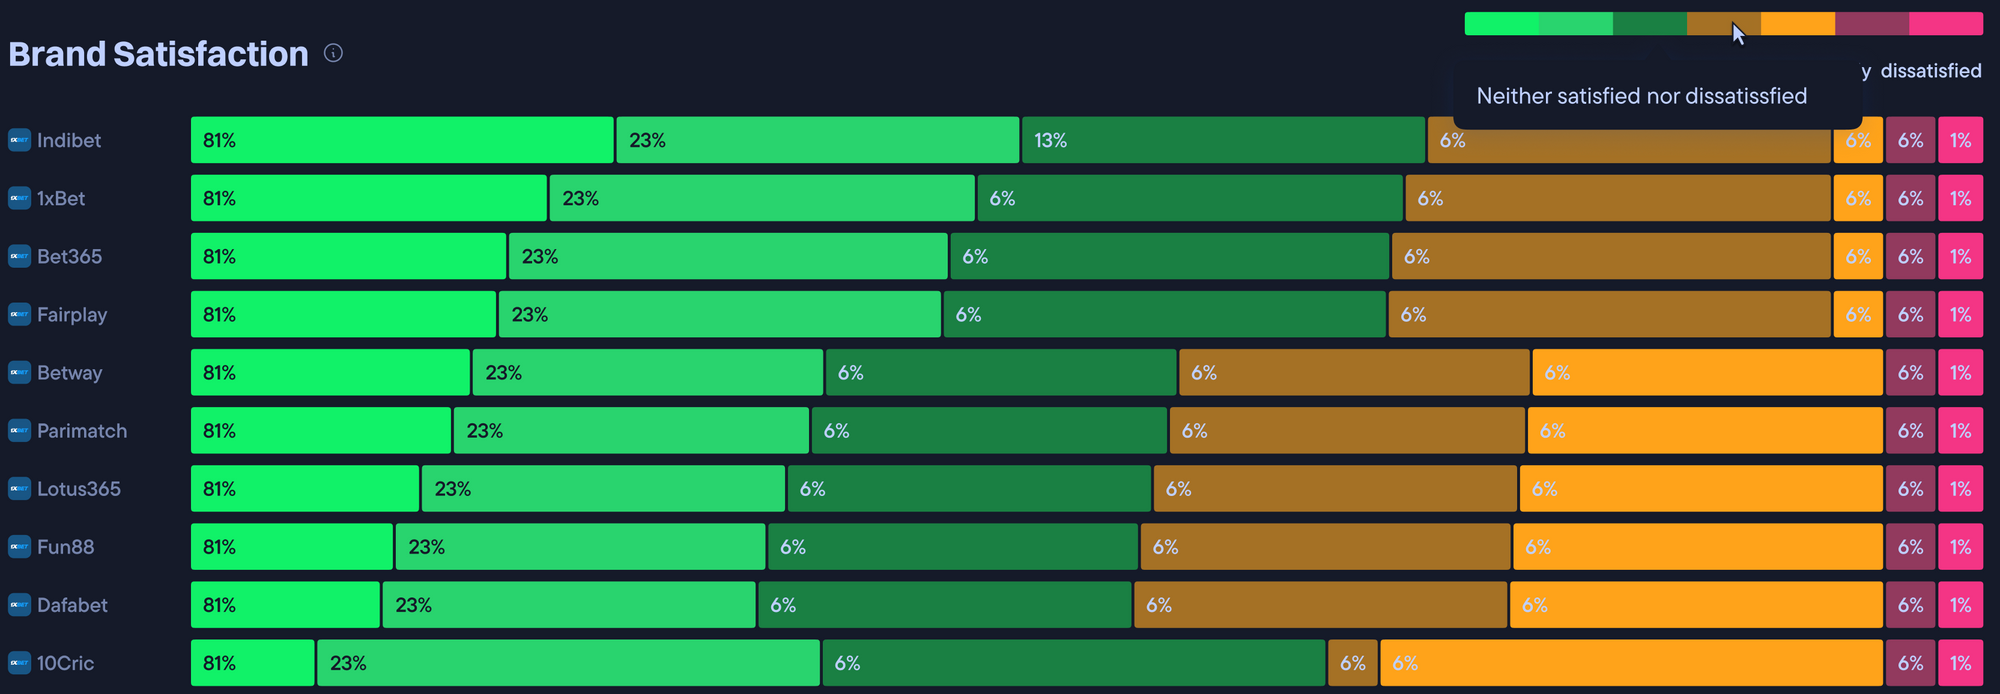
An example dashboard of a Brand Satisfaction metric which is one of the metrics we use to create a combined “Brand Loyalty” metric.
Monthly Cohort Retention (MCR): A Blask AI calculation based on 3rd party data. We use a lot of data from 3rd party sources and partners to estimate average cohorts in the market. M0→M1…all the way up to M11, which creates a full 1 year cohort. It is also used in a deeper manner with the eGGR calculation. We need to understand the churn of other brands to influence the Blask Index to eFTD calculation. If the market is churning heavily in general, we will see more eFTD on average.
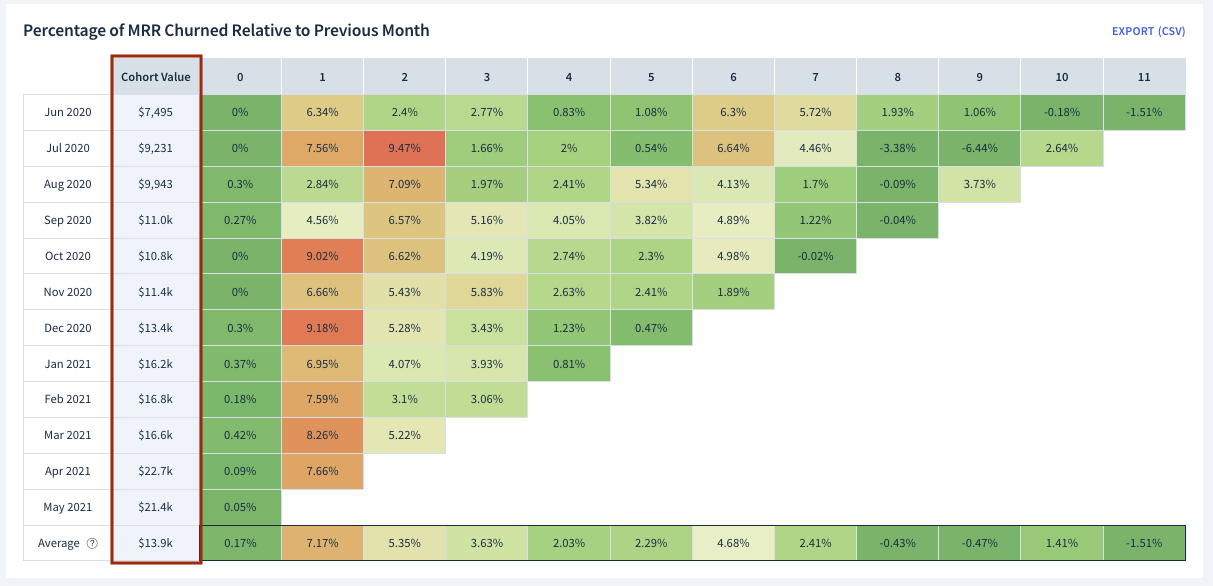
This is a great cohort visualization example taken from here.
Regulatory Environment (RE): A Blask AI calculation based on industry data and insights. In today’s world, full of crypto brands, and regulatory struggles, this one has a lot of weight and decision-making power.
We divide (virtually) our logic into many segments:
- Regulated markets with no offshore. E.G: Angola.
- Regulated markets with heavy offshore. E.G: Germany.
- Unregulated markets. E.G: India (probably. It’s still not in the 5th category yet, but please correct me if I’m wrong)
- Unregulated markets close to regulation. E.G: Brazil.
- Markets where gambling is restricted. E.G: Bangladesh.
Taking most of the other 7P’s into consideration we explore multiple weights and then:
Marketing Mix Diversity (MMD): A Blask AI calculation based on 3rd party data, which is a huge upcoming feature in the product itself. The nature of the traffic affects the conversion ration. If the traffic has high intent, it will convert better. Mostly organic / PPC - right? Facebook/in-app - not. Also the same with churn, and retention MMD affects this metric also.
It is a work in progress, because it is a very complex feature and calculation because of the nature of iGaming traffic and user behaviour.
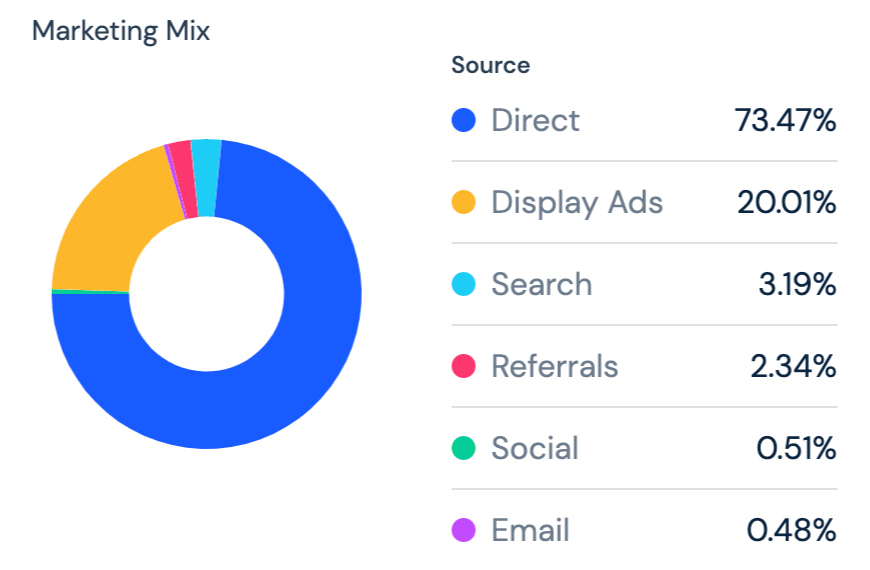
Example marketing mix realisation from SimilarWeb.
Products Per Person (PPP): A Blask AI calculation based on 3rd party data, and very closely tied to the Seasonal Trends metric, as the more able an operator's product mix can cater to diverse player preferences, the better they will convert. As a result, ARPU and eGGR will become much better. An example is if the market has a big chunk of eSports preferences amongst the audience or crash games are one of the market's driving influences.
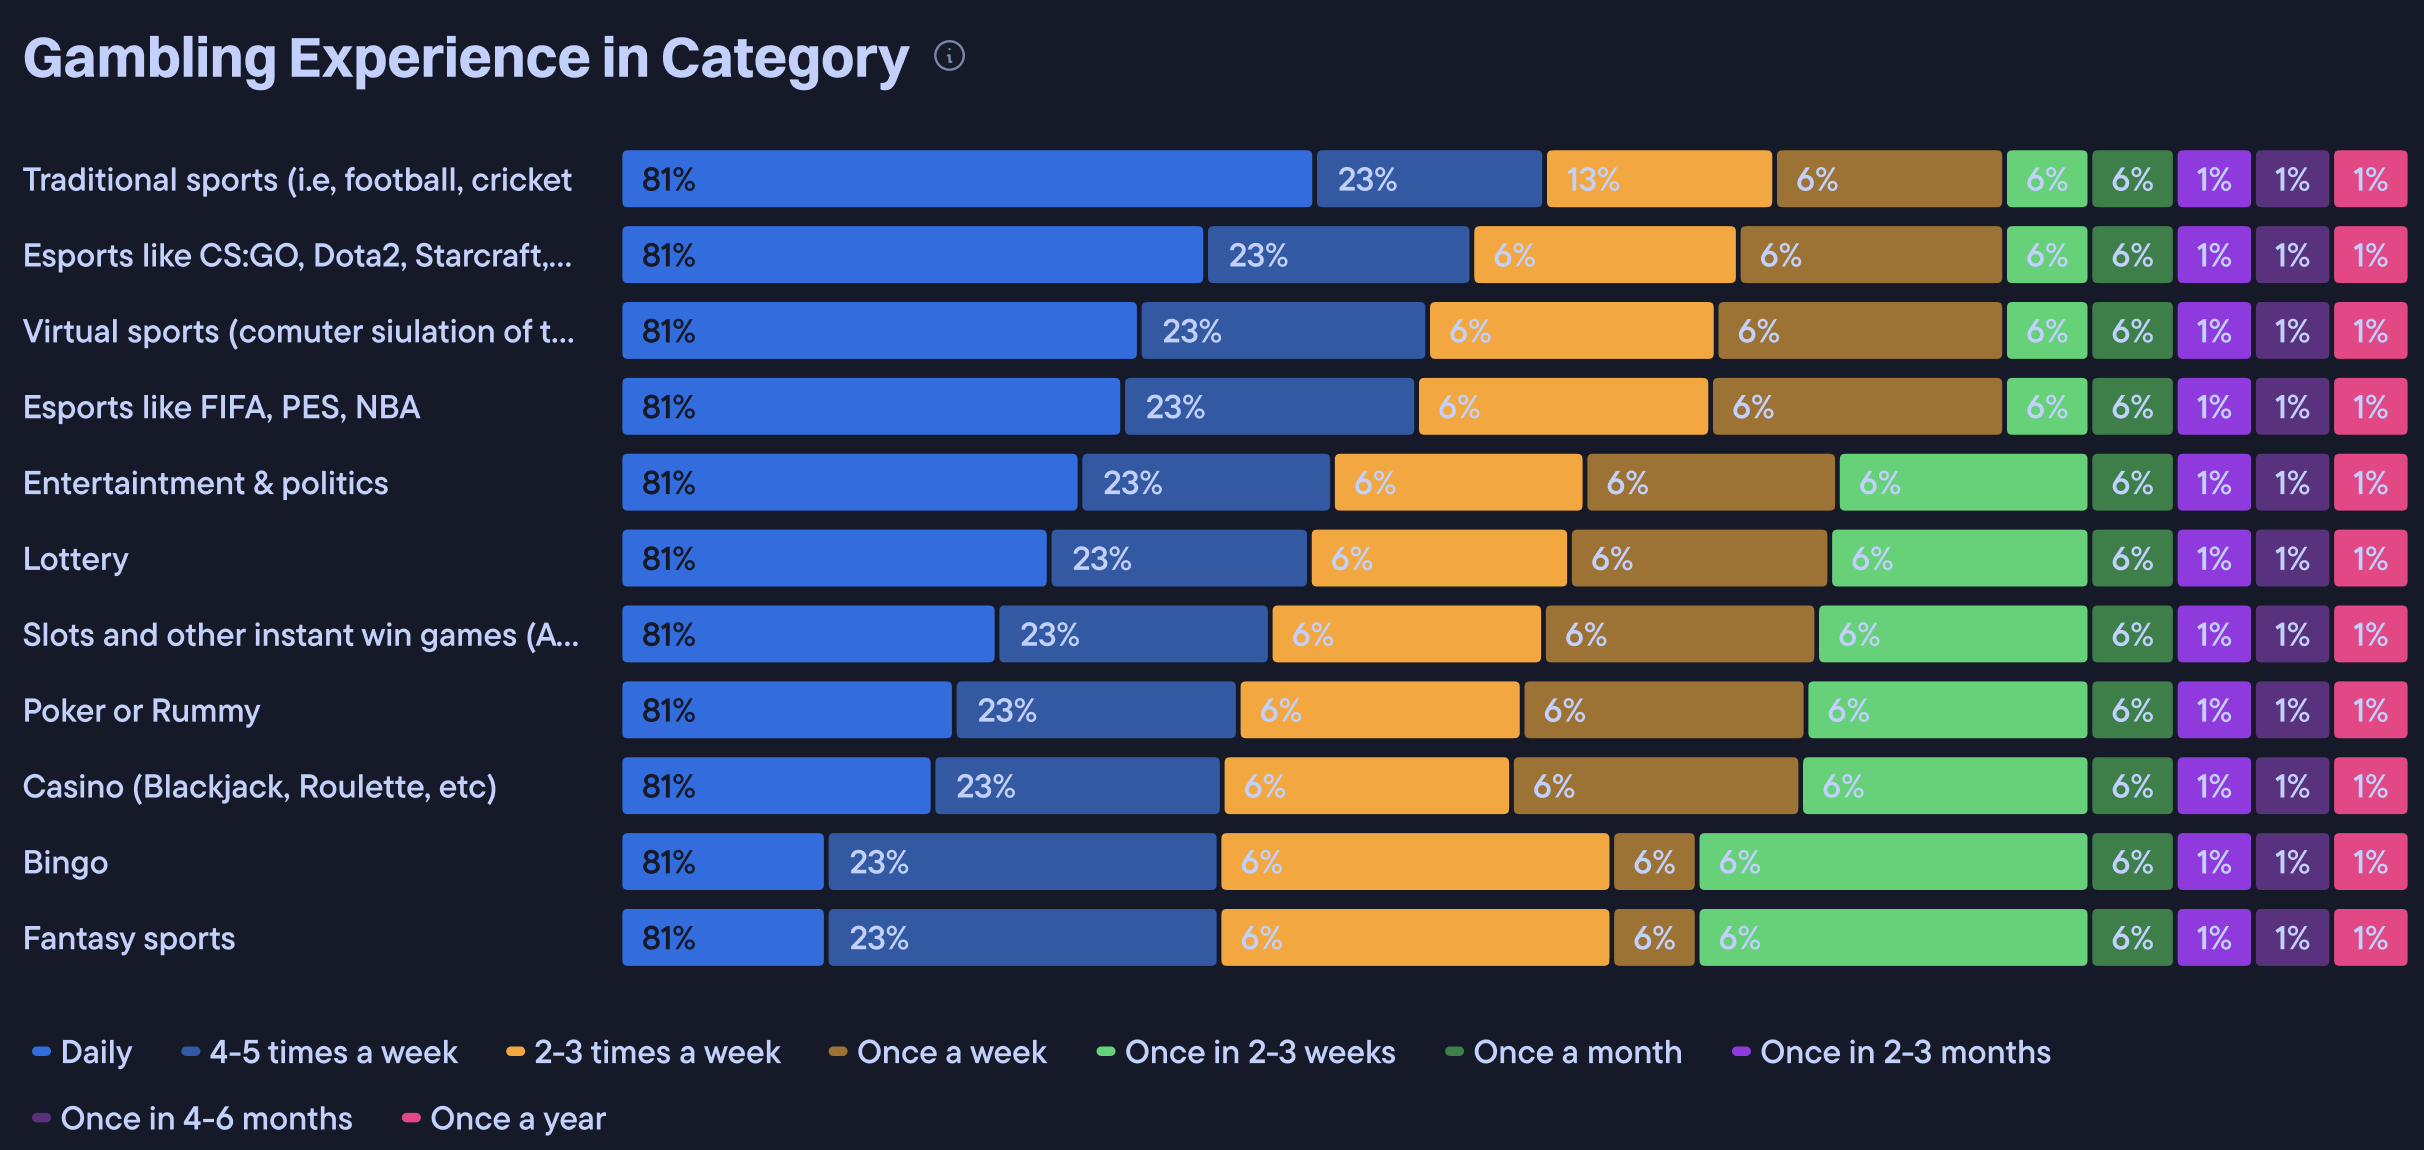
Here’s an example of a customer profile dashboard with user preferences.
Average Revenue Per User (ARPU): The Blask AI calculation based on third-party data is, I’d say, one of the most important metrics to close the Blask Index to FTD chapter.
We will introduce factors such as the average number of brands the user is playing with and the share of the wallet amongst brands in our calculations later.
So why is it only 6P for GGR and why is it calculated differently?
And Dmitry, why do you guys have the same metrics used twice in two different places?
I will explain that part. If you look at some of the metrics and the context they are used within, you’ll understand that the same metric on the Index → eFTD and eFTD → eGGR stage can have numerous meanings.
Giving you a few examples below:
Regulatory Environment (RE): On the eFTD level it can affect regulated operator conversions during tough regulatory changes, and on the eGGR level increase ARPU of the offshore operators.
Marketing Mix Diversity (MMD): This will affect the conversion ratio on the eFTD level, and cohorts, retention, ARPU on the eGGR level.
And so on. The AI model knows more than I do (that’s scary) will (hopefully soon) optimise on the go.
And as I said earlier, the data will become more precise, and come from more sources as we progress. So, this may eventually become 222P and increase our confidence interval up to 95%+ (I hope!).
That’s a wrap.
Writing this, I felt like Steve Jobs. Not because of his beautiful presentation skills but of the innovative mindset he brought with him every time he went on stage.
As I said multiple times, this is our first attempt to estimate the market and its expected numbers more precisely using our in-house Blask AI. It is a very early 0.1 version, but it’s a good start.
We are always open to feedback, so please share it!
Unlock your iGaming potential with Blask!
Blask empowers you to make data-driven decisions, optimize marketing strategies, and drive significant GGR increases by providing unparalleled clarity about the iGaming market and your performance.
Curious about our precision?
Discover our article "What is Blask?" and how Blask's cutting-edge technology is transforming iGaming analytics.
Ready to experience Blask in action?
- Sign up for free demo access and explore real data on the TOP-5 brands per country: Get a firsthand look at Blask's capabilities.
- Request a personalized demo with full access to data tailored to your niche and objectives. Fill out the form at blask.com to help us prepare use cases specific to your needs.
Need assistance?
Our support team is always here to help. Click the chat icon in the bottom right corner of your screen to connect with us instantly and get the answers you need.