Blask is built to answer a simple question fast: where is iGaming demand moving next? Now we’re adding the missing layer: why it moved.
Today we’re releasing Market Explanation: a new feature that turns a visible shift in Blask Index into a clear, structured narrative backed by real-world events and sources.
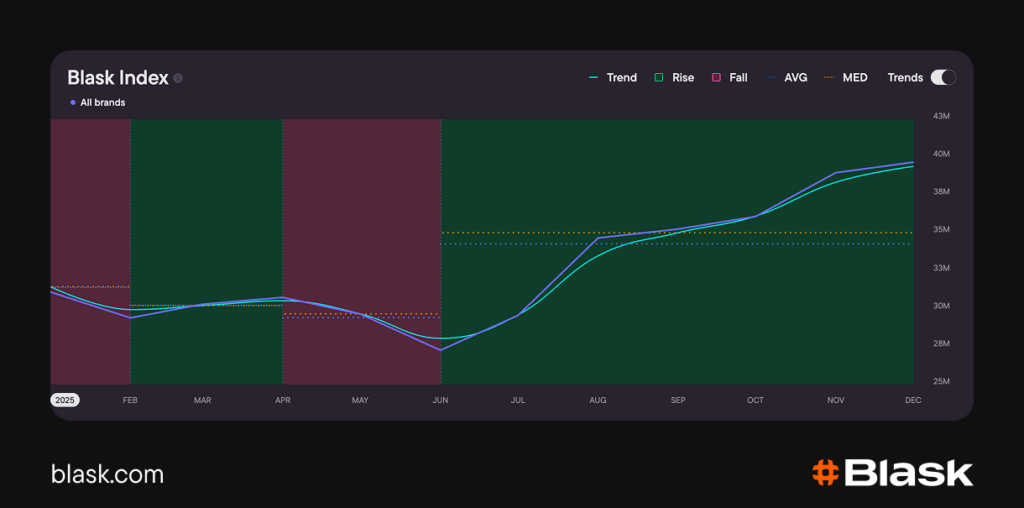
Blask Index is a real-time, dynamic metric that tracks iGaming market volume and brand share, updated hourly, powered by analysis of search query data.
What Market Explanation does
When Blask detects a market cycle — rise, fall, or stagnation — Market Explanation generates a concise breakdown of what likely drove that move. That way teams can make decisions without spending hours collecting context.
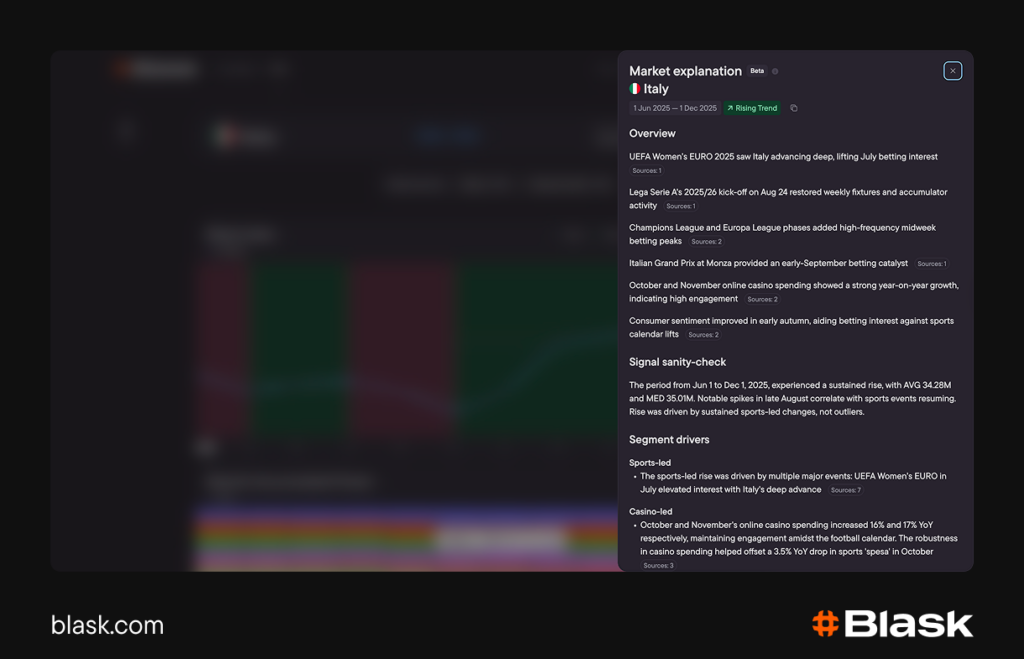
You’ll see:
- Overview — the short “what happened” summary
- Drivers — the main factors behind the move
- Events — key moments during the cycle window
- Sources — links to publicly available references used for the explanation
How to use it (in 2 clicks)
- Open a market and scroll to Blask Index chart.
- Click on the chart (any point inside the trend window).
A Market Explanation panel will open with the full breakdown.
Market Explanation is currently available in markets where the trend period lasts longer than 1 month. If you don’t see the panel yet, it usually means the detected cycle window is shorter than two months in that market. Data is updated once a month.
Why it matters for iGaming teams
Market moves are easy to spot. Explaining them is the hard part.
🚀 Discover: How Market Explanation works
Market Explanation helps you:
- Validate whether a spike is event-driven or structural
- Understand if a decline is regulatory / seasonal / competitive
- Align marketing, acquisition, and expansion decisions around a shared “why”
Beta notes
This is a Beta release. Explanations will keep improving as we expand coverage, sharpen event detection, and refine how drivers are prioritized.
Try it inside Blask, and let us know what you’d like to see next.