Blask’s new Seasonality widget adds a time dimension to country-level insights, so you understand when activity happens, not just where.
What you get
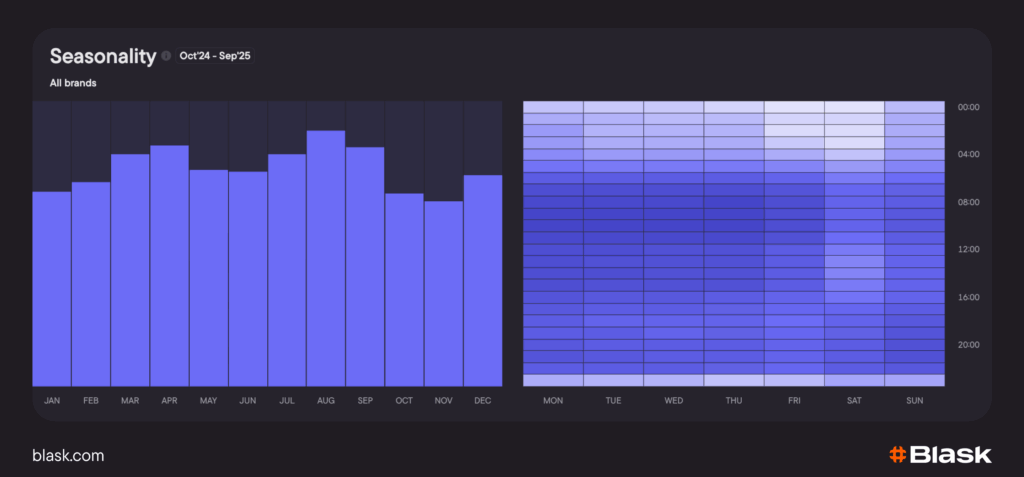
Month ranking is on the left. We aggregate Blask Index over the selected period and rank months to show each country’s strongest and weakest periods in the last 12 months. Day & Hour heatmap on the right, showing relative engagement by weekday and hour (UTC). The scale adapts to your window: 1-month, 3-months, 1-year, all-time, and custom. Hours are unlocked in select markets where signal quality is high.
🔍 Explore: Quick tour – the Countries view in Blask Games
With this feature, you can now explore how engagement patterns shift across months, weekdays, days of the week, and hours (in select countries).
✍️ Why it matters
Use seasonality to time activations, promos, launches, and to sanity-check market behavior before you spend. It’s a simple, visual way to align campaigns with how a country actually lives online.
Real-world seasonality examples
🇩🇪Germany
Notice the weekday late-night peaks (around 03:00 – 05:00 local). Think shift-work schedules, late TV and sports from the Americas, and disciplined daytime routines that push entertainment to the night.
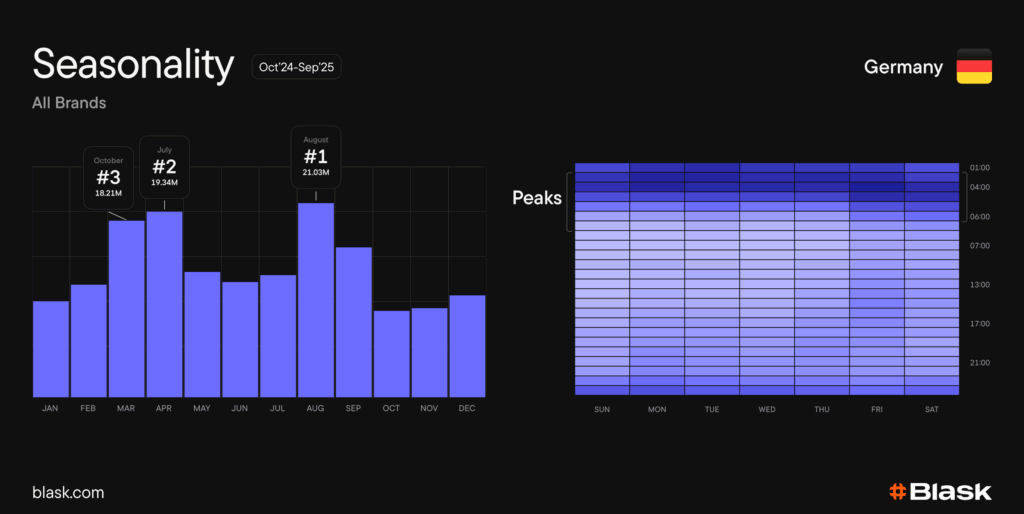
‼️ The heat map dynamically adjusts to dark mode on blask.com. When dark mode is disabled, higher activity is shown in darker shades; when enabled, in lighter ones.
🇹🇭Thailand
A classic night-owl economy: heat moves screen time into late evening and night; hospitality and tourism shifts are big, plus periodic spikes around paydays and national lottery draw dates on 1st and 16th that ripple through broader interest.
These are not rules; they are cultural rhythms you can see and use.
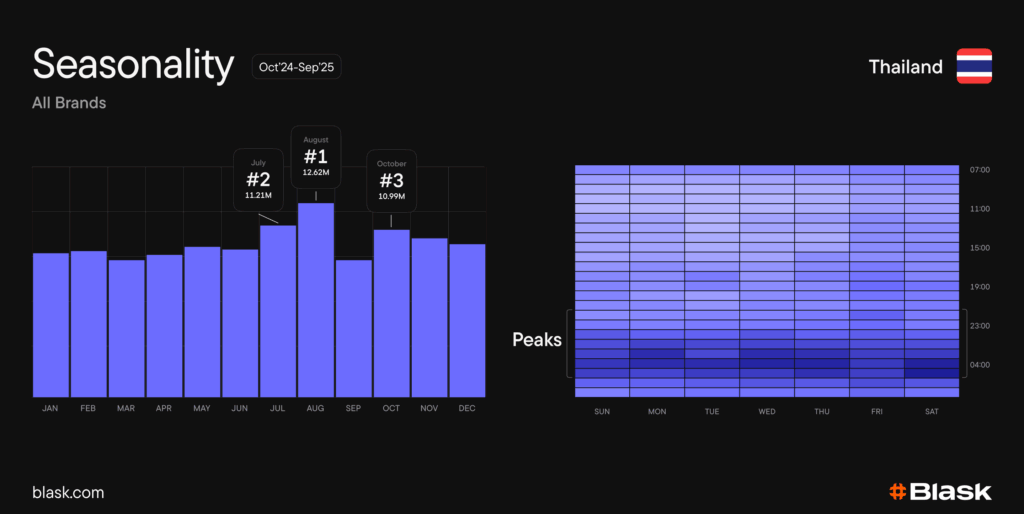
‼️ The heat map dynamically adjusts to dark mode on blask.com. When dark mode is disabled, higher activity is shown in darker shades; when enabled, in lighter ones.
💡 Pro tip
Take a screenshot of the Seasonality widget for a country, drop it into your favorite reasoning LLM: Claude, Gemini, or ChatGPT – and ask: “Explain these peaks and dips with local context and cite sources”. You’ll get a fast, source-backed hypothesis pack for first-pass market understanding. It’s a great way to turn a visual into actionable context in minutes
Part of Blask Index Trends
Seasonality ships as a core piece of the Blask Index Trends release and pairs perfectly with rise and fall segments, baselines, and country overlays, providing both the shape of demand and its timing.
“We built Seasonality so teams stop guessing when a market breathes. Open a country, glance at the bars and heatmap, and you instantly know the right week – even the right hour, to move! It’s the fastest way to make timing a competitive advantage.”
– Max Tesla, CEO & Co-Founder @ Blask