Fastest-growing iGaming markets since 2023
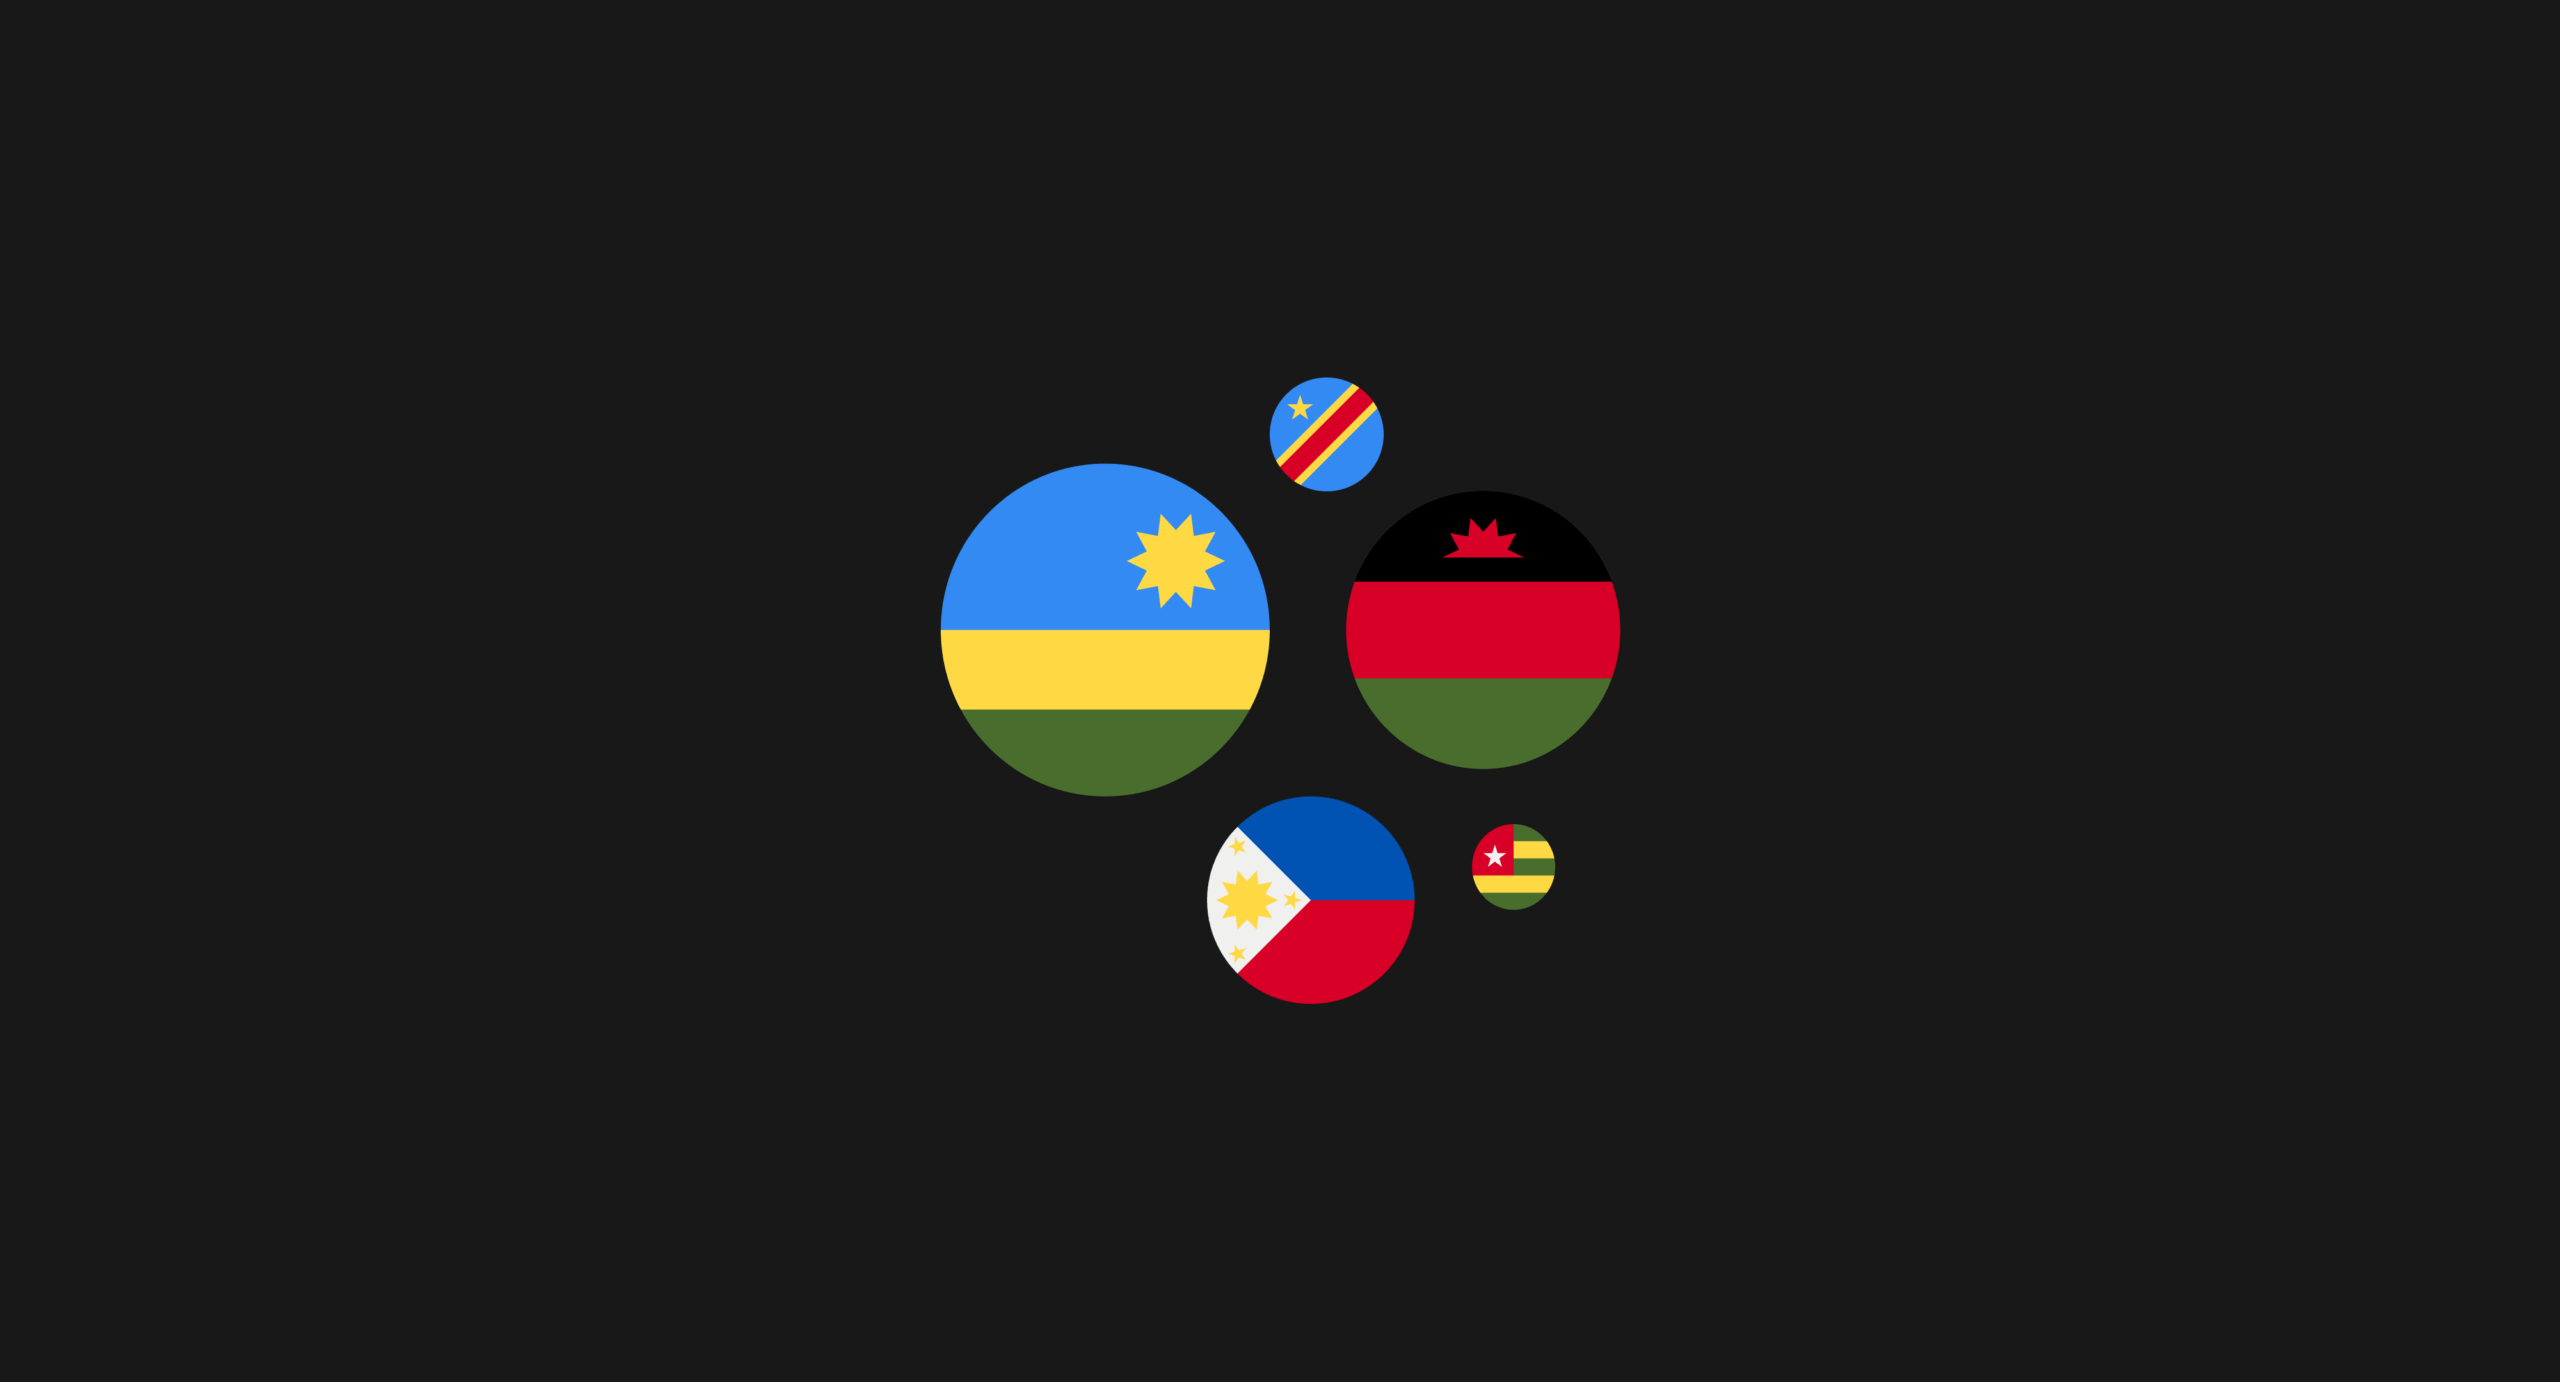
Blask demand data from January–April 2023 to the same months of 2026 shows five markets that multiplied three- to sixteen-fold. In the twelve months since, the Philippines and the DRC kept climbing, Malawi flattened and Rwanda halved.
 byFëdor AnaninPublished

Fast growth in one year is easy to find. A market can double off a low base, take a place in a ranking, and stall. The harder question is which markets kept compounding after the first spike, and which of them are still compounding today.
Blask has tracked iGaming demand across more than 120 countries since 2023. Comparing January–April 2023 with January–April 2026 removes seasonal distortion and isolates structural growth. Adding the twelve months to October 2026 shows which of those trajectories survived the year.
What Blask measures
Blask Index is an AI-enhanced demand signal built from search activity across iGaming brands. It measures player interest before it converts to bets or revenue, which makes it a leading indicator of where commercial opportunity is building. The Index methodology explains the inputs.
For commercial sizing, Blask calculates Acquisition Power Score (APS) and Competitive Earning Baseline (CEB). APS estimates how many new customers a market should be attracting at current demand; CEB estimates the revenue available under current competitive conditions. APS and CEB are modeled estimates, not reported operator figures.
Both are shown as min–avg–max ranges. Acquisition and revenue depend on season, campaign timing and competitive intensity. The range shows the realistic floor and ceiling; the average is the most likely outcome under current conditions.
Three years of demand: the same-window comparison
The table compares Blask Index for January–April in 2023 and in 2026, adds the active brand count in each market, and sets the twelve months to October 2026 beside them.
| Market | Jan–Apr 2023 | Jan–Apr 2026 | Growth 2023–26 | Jan–Oct 2026 vs 2025 | Active brands |
|---|---|---|---|---|---|
| Philippines | 33.18M | 551.62M | +1,563% | +164.2% | 172 → 346 |
| DRC | 28.49M | 114.79M | +303% | +29.3% | 26 → 37 |
| Malawi | 11.32M | 41.86M | +270% | −0.4% | 21 → 34 |
| Rwanda | 6.12M | 21.07M | +245% | −48.5% | 17 → 23 |
| Togo | 0.28M | 0.82M | +199% | +14.9% | 17 → 23 |
Three years of growth no longer implies another three. Two of these markets are still adding demand, one has stopped moving, and one has lost half of it. The gap between the fourth column and the fifth is what separates a compounding market from a finished trend.
The twelve months that split the cohort
Across all countries with more than 100M of Blask Index over the ten months, the fastest demand growth in January–October 2026 against the same months of 2025 came from the Philippines at +164.2%, Venezuela at +89.7%, Argentina at +40.2%, South Africa at +39.3%, Indonesia at +37.5% and Nigeria at +36.4%. The cohort markets fall below that threshold and tell the other half of the story: Malawi moved from 95.62M to 95.27M, Rwanda from 76.03M to 39.14M.
Venezuela, Argentina and Cameroon are new names in a growth table, and the size beside each rate matters as much as the rate itself. First, the five markets from the 2023 cohort, one by one.
Philippines: the market the 2024 ranking called a spike
The Philippines is the strongest compounding case in the dataset and the one the earlier version of this ranking dismissed as a one-year spike. January–April demand rose from 33.18M in 2023 to 551.62M in 2026, a sixteen-fold increase, and the twelve months to October 2026 added another 164.2%.
The growth is broad rather than concentrated. PTGaming leads at 336.96M for January–October 2026, up 458.7% year on year; Casino Plus follows at 272.93M, up 788.2%; Bingo Plus at 249.89M, up 306.1%. ArionPlay, GameZone, Arena Plus, NUSTAR and OkBet each grew more than 250%. The active brand count rose from 172 to 346, the widest field in this analysis.
Commercial sizing follows the demand. The market supports 8.1M average potential new customers a month (5.57M–15.69M range) and $351M average CEB ($224.8M–$729.7M range) across January–April 2026.
Reported revenue moved the other way. PAGCOR recorded a 23.4% fall in revenue for January–September 2026, with electronic gaming down 37.2% to PHP27.63B. SCCG wrote in October 2026 that the central bank had required payment providers to remove direct links between e-wallets and online gambling platforms. Demand kept climbing while one of the country's main payment rails closed. The Philippine story for 2026 is demand that has not been given a way to convert.
The DRC: still compounding
The DRC is the only market in the cohort that grew in both windows: 28.49M to 114.79M in the three-year comparison and +29.3% in the twelve months to October 2026, with active brands up from 26 to 37.
The growth now leans on one operator. betPawa's demand reached 154.45M between January and October 2026, up 159.7%, and accounts for about half the market. NgeNge fell 23.6% and Winner Bet 38.2% over the same period. Mobile money remains the mechanism: M-Pesa, Airtel Money and Orange Money handle most betting transactions, as iGaming AFRIKA found.
Commercial sizing: 3.31M average APS (2.46M–5.86M) and $12.66M average CEB ($9.45M–$22.29M) monthly in January–April 2026. A large population, mobile-first payments, an early-stage regulator and a narrowing base of brands: that combination makes the DRC the highest-ceiling market in this cohort, and the one that needs the most due diligence before entry.
Malawi: how compounding turns into a plateau
Malawi's three-year figure still reads well: 11.32M to 41.86M, up 270%, with brands from 21 to 34. The twelve months to October tell the other half of the story: 95.62M became 95.27M, a decline of 0.4%.
Brand-level data explains it. betPawa, the market leader, grew 2.5%. Betway fell 20.1% to 21.70M. Premier Bet added 6.8%. The field expanded from 21 brands in early 2023 to 34 in early 2026 while total demand stayed flat, so every brand's share of that demand is smaller than it was a year ago.
Regulation pushed costs up in the same period. The Gaming and Lotteries Authority of Malawi restricted betting advertising on broadcasters, and MISA Malawi facilitated talks between stations and the authority over the terms in March 2026. A market that formalises while demand plateaus adds compliance cost without adding players.
Rwanda: what one brand's exit does to a market
Rwanda led the 2024 ranking with 146% growth. The three-year window still shows 6.12M to 21.07M. Then the demand left: 76.03M over January–October 2025 became 39.14M over the same months of 2026, down 48.5%.
One brand accounts for nearly all of it. betPawa held 68.36M of Rwanda's 76.03M over January–October 2025, about 90% of the market. Its demand fell month by month through the first half of 2026 and stops appearing in the data after June. Winner (AFR) grew 438.9% and Gorilla Games 721.6% over the same period, and the market still halved.
Regulation moved at the same time. The Rwanda Development Board took over gambling oversight in 2024 and paused licensing until August 2025, as KT Press documented. It then raised tax on operators' gross gaming revenue from 13% to 40% and withholding on net winnings from 15% to 25% from September 2025, as allAfrica reported. Enforcement removed more than 7,000 unlicensed slot machines in 2025.
The concentration was visible a year earlier. Over January–October 2025 the next-largest brand in Rwanda held 4.2% of demand. A market's growth rate says nothing about how many brands produce that growth, which is the measurement lesson Rwanda delivers.
Why percentage growth alone misleads
Togo grew 199% across the three-year window, from 0.28M to 0.82M, and another 14.9% in the twelve months to October. It generates 12.5K average APS (6.5K–30.6K) and $0.38M average CEB ($0.20M–$0.93M) monthly. The rate is genuine; the market is seven times smaller than Malawi's and roughly nine hundred times smaller than the Philippines'.
The 2026 leaderboard repeats the point. Venezuela grew 89.7% and holds $123M of CEB across January–October 2026. Turkey grew 23% and holds $9.7B. A rate without the size beside it does not tell an operator where to send money.
The Philippines is the rare case of both: the highest rate in the dataset and the second-largest CEB on the leaderboard. That is what compounding at scale looks like.
What operators should track in growing markets
Growth markets move through stages. Demand rises before commercial infrastructure catches up, and the signals that matter change with the stage.
| What to track | Why it matters |
|---|---|
| Blask Index trend | Is demand still growing, or has it plateaued? |
| Active brand count | Is competition expanding alongside demand? |
| BAP distribution | Is demand spreading across brands, or locked into one? |
| APS and CEB ranges | Is the market commercially meaningful at current scale? |
| Regulatory status | Is the market becoming more structured, or stagnating? |
The Philippines and the DRC show positive signals across most of these dimensions now. Brand counts are expanding, APS and CEB sit at levels that justify commercial attention, and demand has not reverted. Malawi passes on size and fails on trajectory. Rwanda fails on trajectory, and its active brand count slipped from 25 to 24 over the last twelve months.
Conclusion: track growth while it is still moving
Annual rankings create entry points and go stale within months. The 2024 edition named Rwanda the market to watch; Rwanda has since lost half its demand. It placed the Philippines next to one-year spikes; the Philippines has grown sixteen-fold in three years and doubled its brand count.
The pattern that survives a year has three parts: demand rising, brands multiplying, and a payment rail that works. The Philippines holds the first two and is under pressure on the third. The DRC holds all three. Venezuela, Argentina, South Africa, Indonesia and Nigeria are the markets to watch in the 2026 cohort, with the caveat that most are still small.
Operators waiting for the next year-end report will find these markets more competitive than they are today.
Check the leadersBook a Blask demo now
Don’t wait a whole year for our next digest featuring the top 5 countries; instead, track all iGaming trends daily, or even hourly, by yourself.