How does Blask calculate the data?
Powered by a sophisticated blend of algorithms and extensive data sources, Blask stands as more than just a mere analytical tool; it acts as your compass in the complex terrain of the online gambling & betting market. In the following sections, we'll detail how Blask systematically transforms raw data from multiple sources, converting it into actionable insights for your strategic benefit.
Blask implements the idea of the Share of Search metric.
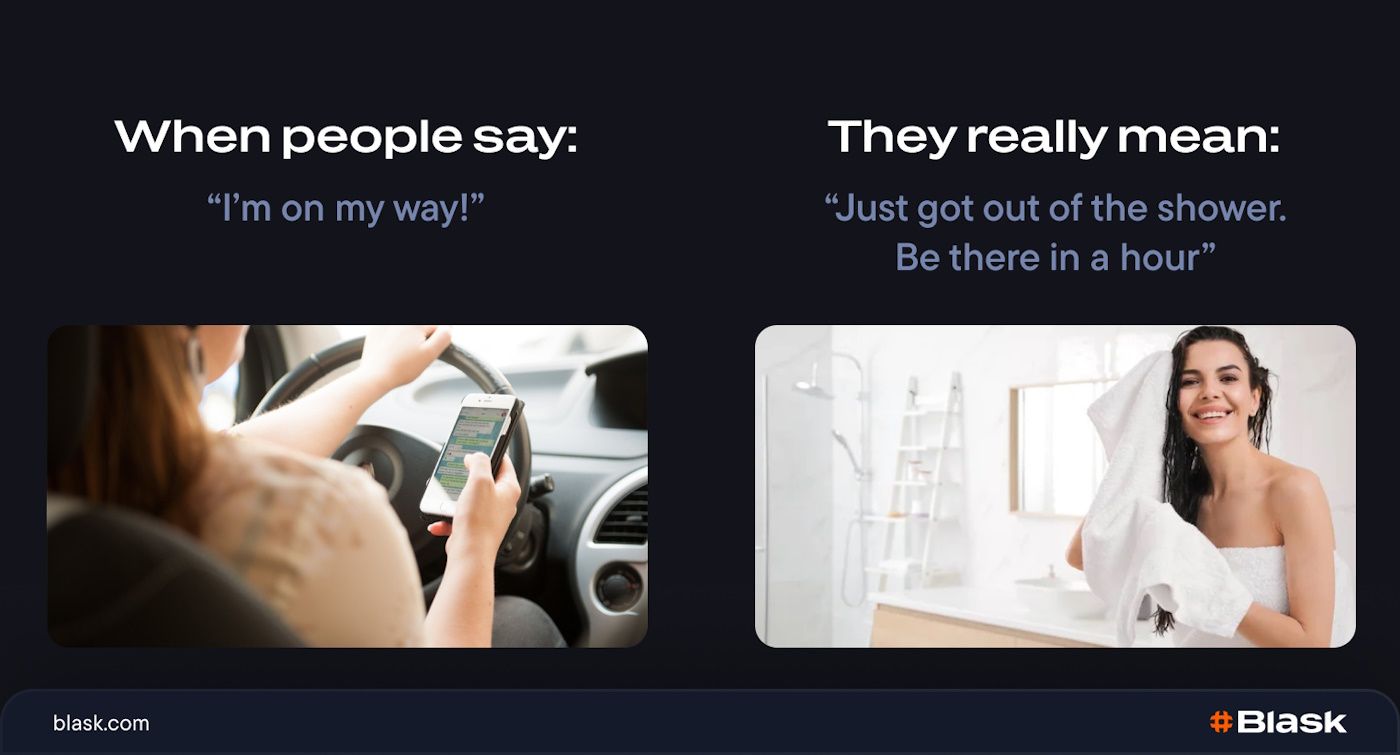
Historically, marketers have often relied on surveys to understand consumer preferences and motivations. While surveys are invaluable tools in capturing direct feedback, it's worth noting that there can occasionally be variations between what people say and their actual behaviors. Complementing survey data with other metrics is needed to view market trends comprehensively.
Our approach to eliminating uncertainties is inspired by Les Binet and James Hankins’ research on the new Share of Search metric. This metric boils down to a simple conclusion — the share of internet searches for a brand or product matches that brand or product's market share with an astonishing up to 95% accuracy rate. This method has already found validation in numerous fields: energy, cars, smartphones, restaurants and hotels, food and beverages. Additionally, Blask confirmed this pattern in the iGaming market as well.
Volume of Search ≈ Market Share
This value is close to 100%, but not equal, as people search online with one of two purposes: either to generally explore the market to see what brands and offerings exist, or to make a final evaluation and decision.
At the same time, the players who are choosing a brand today and exploring the market are the very people who will soon be searching for specific brands and becoming customers. Therefore, Share of Search can be trusted, adjusted for exploration and evaluation mindsets.
However, data can be affected by external events. For example, when Volkswagen had a scandal related to emissions, there was a significant increase in online searches. Surprisingly, though, the company's market share went down. So, the Share of Search idea demonstrates that search volume offers invaluable insights, but it must be complemented with other factors to form the whole picture. This observation revealed a robust correlation, but the complexity of real-world markets means this cannot be taken at face value.
Blask overcomes the shortcomings of the Share of Search metric.
Blask focuses only on the right keywords and selects them carefully to display metrics only with the right sentiment. For example, "brand_name betting" is the maximum targeted query, while "brand_name payout problems" or "brand_name scam" are not taken into account so as not to distort the market volume and market share calculations in case of any brand problems. This rigorous testing and refinement ensures our Blask Index provides the most contextualized, nuanced, and holistic insights into the complex gambling ecosystem.
Additionally, Blask harnesses the predictive power of the Share of Search metric. Les Binet and James Hankins showed that search volume is a leading indicator, similar to stock market indices foreshadowing price changes. In both cases, indicator fluctuations reliably precede corresponding shifts in the market. Leading indicators detect emerging trends based on early signals and momentum changes. For example, an uptick in searches for a brand suggests its market share is likely to increase. By tracking these leading indicators and search trends in real time, Blask identifies emerging trends and momentum shifts before they fully materialize, providing an invaluable early warning system for the industry.
While search share may predict market share at a macro level, our specialized approach extracts deeper intelligence tailored to the needs of individual iGaming brands. By synthesizing search data with real-time industry trends, competitive moves, player behaviors, and other influential factors, we transform raw statistics into actionable metrics for strategic decision-making.
Blask harnesses search data and additional insights.
Search data is compelling because it captures real-time user behavior and interest. As users search for brands, products, or information related to gambling, we can immediately gauge the market's pulse and identify emerging patterns or shifts. This real-time feedback is invaluable for businesses looking to capitalize on timely opportunities or adjust their strategies based on the latest market trends.
Our primary sources of information are Google Keyword Planner and Google Trends. These tools provide a panoramic view of the market, allowing our algorithms to find the volume in absolute terms over any given period. At an early stage, we selected only these two data sources as the most reliable. In the future, Blask will add more data points for even more accurate calculations.
Beyond raw search data, we will integrate additional factors, such as industry trends, events, and noteworthy happenings within the iGaming sphere. This approach ensures that our users receive a holistic view, allowing for data-driven decision-making.
We derive insights into user interest and market shifts by measuring the number of search queries associated with gambling resources. Examining brand-specific questions lets us pinpoint each brand's market share, providing a clear snapshot of the industry's competitive landscape.
At Blask, we’re not just analyzing data but transforming and disrupting the entire iGaming industry. Our innovative approach introduces new ways to interpret data, giving businesses the insights they need to make strategic and tactical decisions. By revolutionizing how data is viewed and utilized, Blask is paving the way for a more dynamic and competitive landscape in online gambling and betting.
— Max Tesla, CEO Blask
Why not directly access Google's data?
Think of Google's tools as a Swiss knife — versatile for many challenges but sometimes lacking specificity. For the nuanced world of the iGaming sector, Blask stands out as that perfect tool, crafted uniquely for this niche.
- Google Keyword Planner's shortcomings
The tool only displays the average search volume for a month, lacking the ability to provide weekly, daily, or hourly granularity. Additionally, it limits trend tracking to quarterly and yearly increments, diminishing the immediacy and accuracy of the insights. With Blask, you can look at search data by the hour or over any period you choose for the most up-to-date and detailed view. - Limitations of Google Trends' scaling
Google Trends, while insightful, presents data on a 0 to 100 scale, detaching insights from tangible real-world numbers. This scale lacks clarity on exact values, making it less actionable for businesses needing precise data. Although Google Trends might be a viable option when no alternatives exist, the good news is that Blask provides a more refined and complete solution. - Google Trends semantic sensitivity
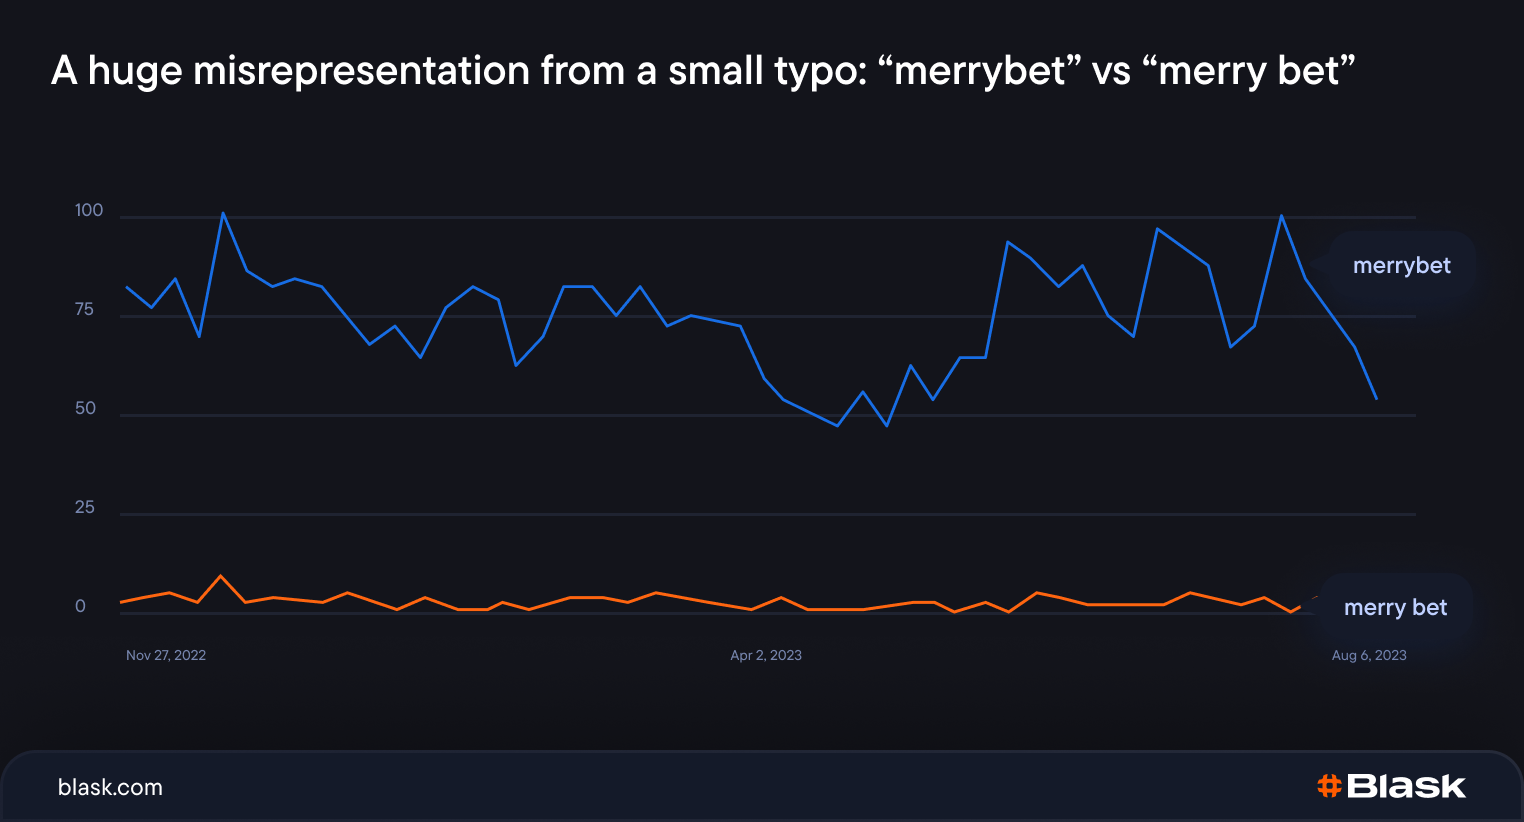
The output of Google Trends is highly dependent on the chosen keywords, which can lead to ambiguous interpretations. Sometimes, people just make typos. Rather than relying on isolated keywords, Blask utilizes semantic topics around brands to include misspellings, colloquial variations, synonyms, and more. Most brands only parse searches for their official or most commonly used name. While this allows brands to track overall interest and trends, it does not capture the full scope of relevant search volume. For example, variations like typos, abbreviated names, and related keywords are all missed.
- Google Trends’ restriction on query comparisons
Users can compare up to only five queries simultaneously. Instead of getting a complete picture, brands can only see how they relate to their closest competitors. This narrow view can leave brands unsure about what to do, leading them to spend a lot on independent studies or buy existing ones. Such investments might be out of reach for emerging brands or those planning to enter the market. It means they might make decisions without having all the necessary information. On the other hand, Blask offers a more inclusive approach, comparing all brands simultaneously and providing a fuller, more actionable view of the market landscape. - Google Trends’ restriction on query comparisons
Users can compare up to only five queries simultaneously. Instead of getting a complete picture, brands can only see how they relate to their closest competitors. This narrow view can leave brands unsure about what to do, leading them to spend a lot on independent studies or buy existing ones. Such investments might be out of reach for emerging brands or those planning to enter the market. It means they might make decisions without having all the necessary information. On the other hand, Blask offers a more inclusive approach, comparing all brands simultaneously and providing a fuller, more actionable view of the market landscape. - A notable inconsistency in data presentation in Google Trends
When observing statistics for the same keyword over an identical time frame, you may notice disparities in the results on different days. This is due to Google Trends' methodology of analyzing not the entire volume of searches but a random sample of it. While this approach can provide a broad overview of search behaviors, it inevitably leads to inconsistencies. Such variances can be troubling, as users accessing the platform tomorrow might encounter slightly altered data for the same parameters they checked today.
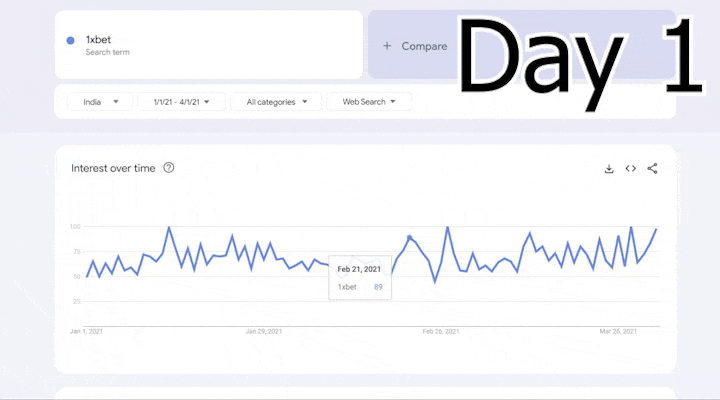
Here’s our experiment! Two Google Trends screenshots for the same brand, country, and timeframe, taken just one day apart, and we already have a noticeable inconsistency! Common sense suggests that the data should be the same — after all, we are looking at statistics for the past period, and the past cannot be changed....
In reality, the numbers for “1xbet” for February 21, 2021, differ by as much as 11 points: 89 versus 78.
This inconsistency isn't a hidden flaw; it's a well-documented issue, which you can delve into further here and here.
Recognizing this challenge, we at Blask take an extra measure. We collect the data for the same periods multiple times and integrate the results. This approach ensures that we offer the most relevant, consistent, and accurate information, minimizing the inherent variability of the source.
-
Limited insights for emerging brands
Google Trends often provides limited insights for new or small brands due to their typically low search volumes — this can lead to erratic and unreliable results that change with each query. Blask collects data for all the brands no matter their size — correct representation of the iGaming market is our priority. -
Limited depth of metrics
Google provides raw search data, which might give a broad overview, but it doesn't capture the subtle shifts, player behaviors, or any other influences unique to this industry. To truly thrive in the gambling domain, businesses need insights beyond mere numbers and an understanding of the stories and patterns behind them.
Blask bridges the gaps present in other platforms. While Google provides foundational data, our solution stands out by enhancing this information with additional metrics. Our algorithm, developed through years of work and testing, provides data with precise figures. This approach, based on a deep understanding of the iGaming landscape and technical superiority, allows stakeholders to receive contextually rich and comprehensive insights with tangible figures, whether annually or hourly, facilitating more informed decisions.
Blask’s core metrics.
We established Blask to offer you a bird's eye view of the iGaming industry. To achieve this comprehensive objective, which we'll delve into in the sections below.
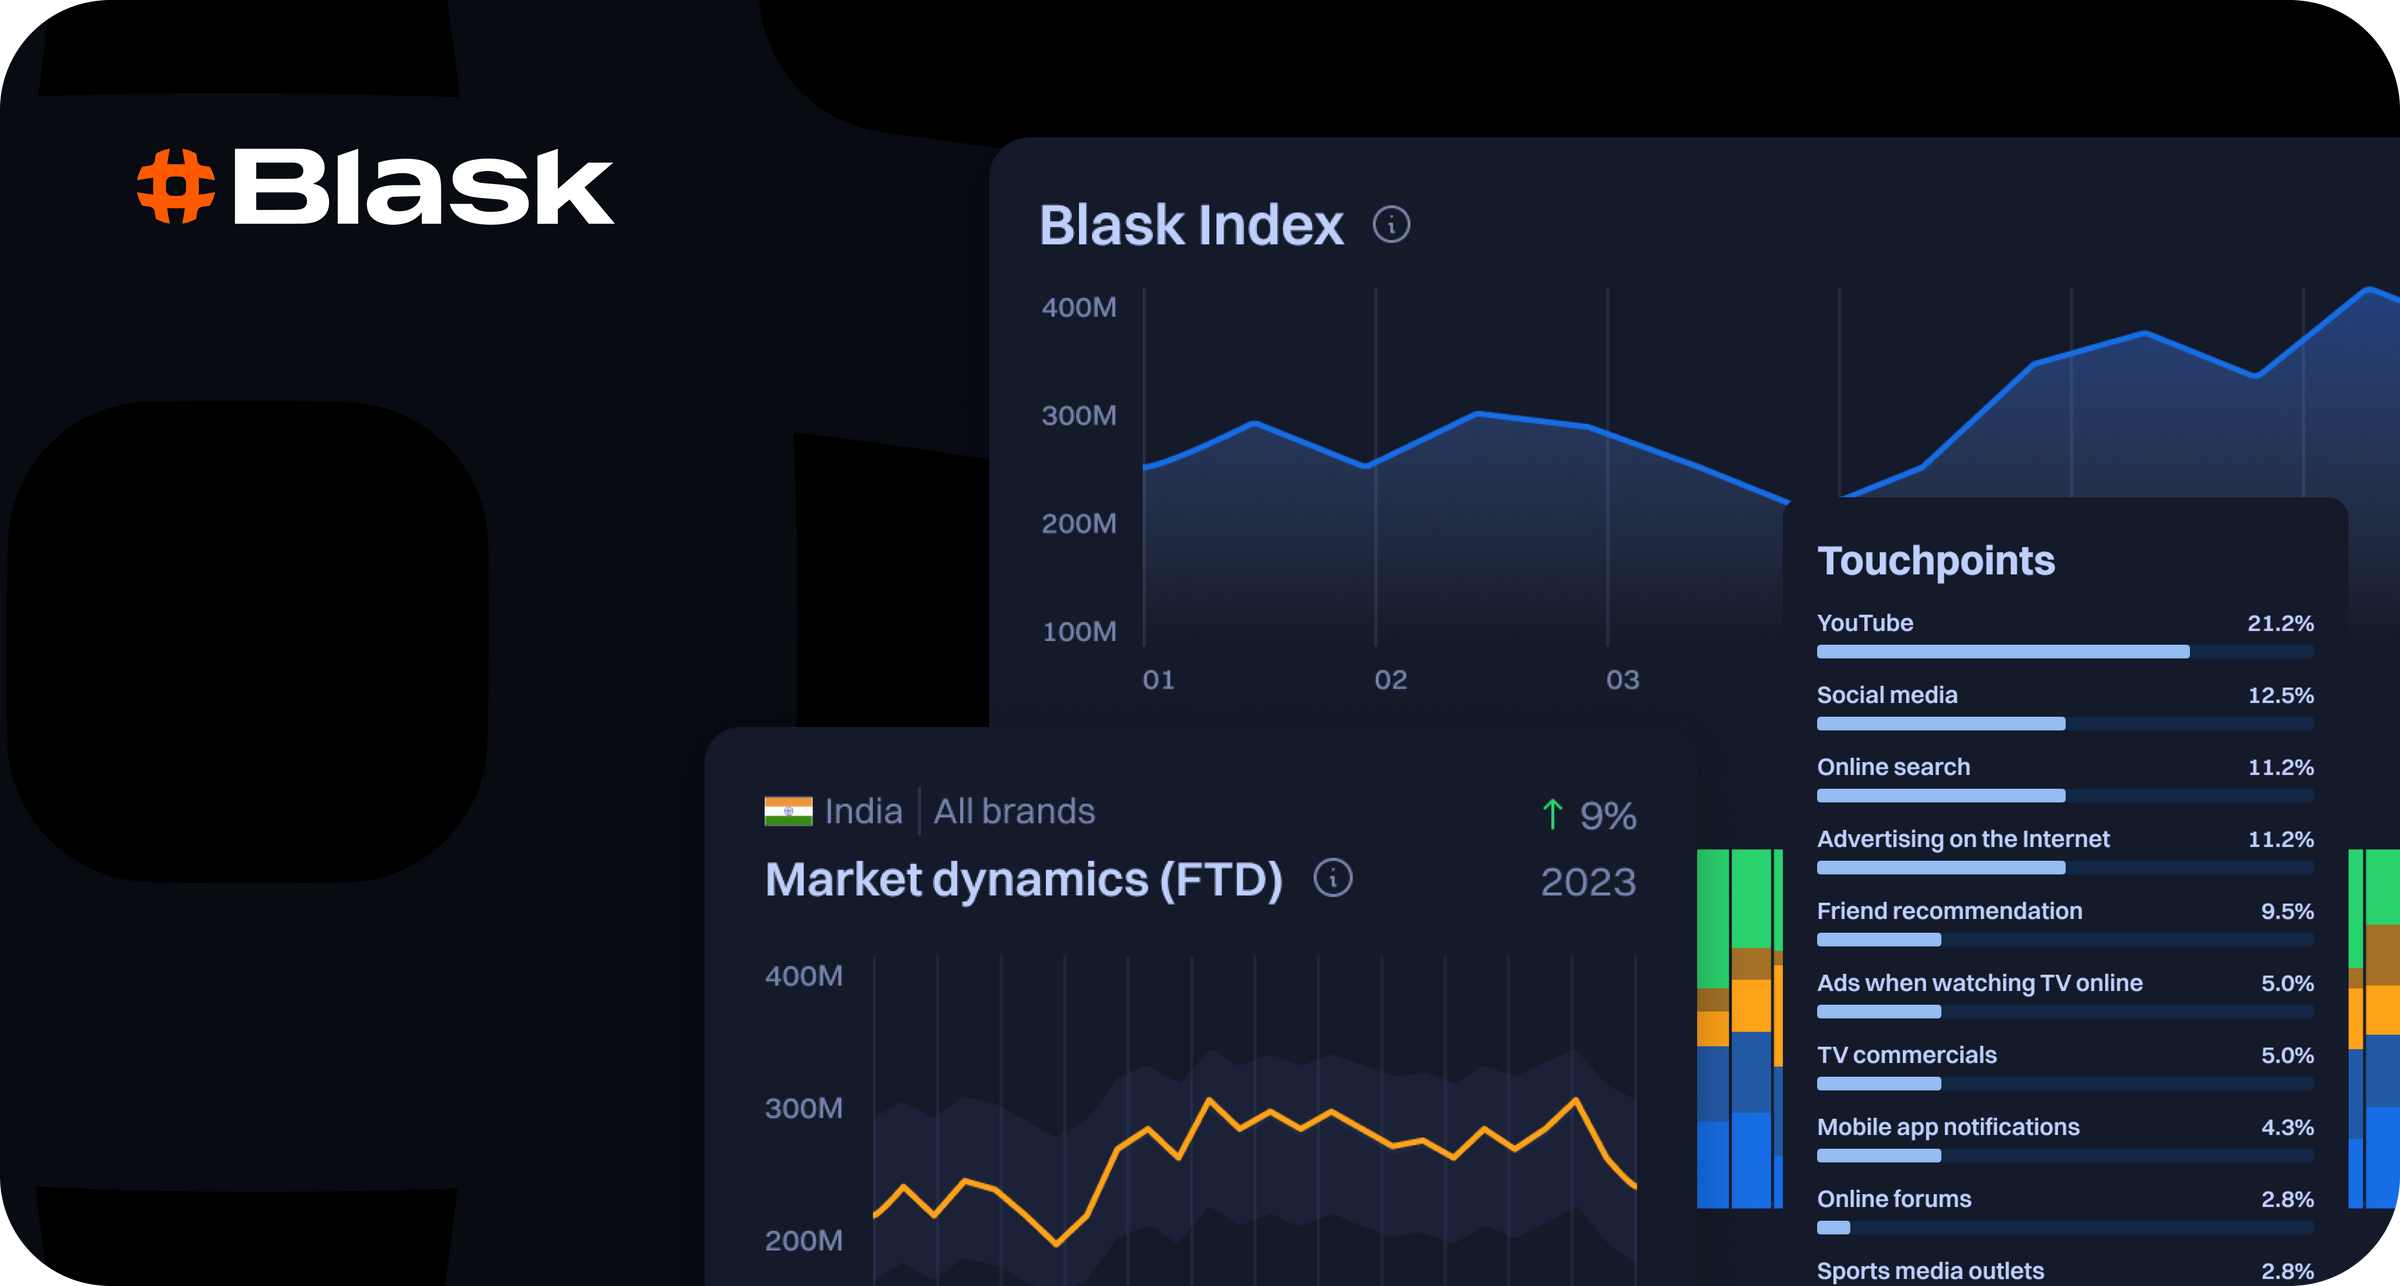
Blask index.
We don’t merely observe the iGaming market – we quantify it.
The Blask Index, our own and main metric, inspired by Les Binet's theory and built on data aggregated from various sources, gives a clear view of the iGaming market size in various countries and represents how much of this market is held by each brand.
It's not just a one-time snapshot; it tracks changes, showing if the market grows or shrinks and how brands' shares change over any desired time frame.
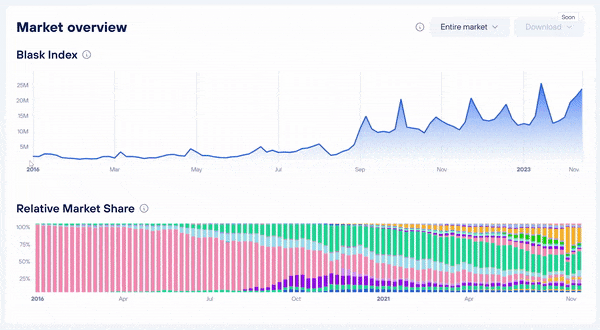
We calculate a unique Blask Index for every country to offer localized market analysis. Similar to stock indices like Japan's NIKKEI and Germany's DAX, it numerically represents the size and competitiveness of each country's iGaming landscape.
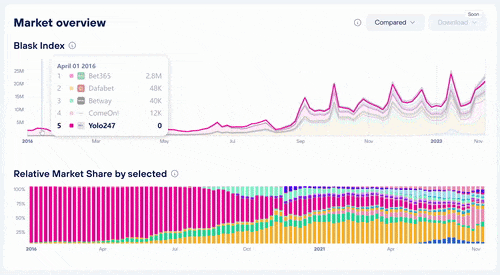
Blask Index is also available for brands and can be used to compare one brand to another and to track its market share fluctuations.
The Blask Index empowers iGaming operators, affiliates, journalists, and researchers to observe a brand's position closely, compare it to competitors, and evaluate the full scope of the market in specific countries. And the cherry on top! You can compare the volume of the same brand in different countries and also the volume of the iGaming market in those countries.
First-Time Deposits (FTD).
With the First-Time Deposits (FTD) metric, Blask determines the average market conversion rate and projects the expected number of new deposits.
The FTD metric is built by integrating a blend of real-time search data, historical conversion patterns, and industry trends. Blask operates the AI model to count this metric and offer a reliable number of expected conversions.
Blask calculates the number of first-time deposits for both countries and individual brands.
If your brand’s results are below the average FTD indicator, it might mean you need to improve your marketing. In other words, if you're not meeting the mark, there's room to do better. If you're matching our numbers, that's good — you're on track. But if you're doing even better than our numbers, that's fantastic; you're leading the market.
Year-over-Year and Month-over-Month.
In addition to the Blask Index and FTD, we've integrated the Year-over-Year (YoY) and Month-over-Month (MoM) metrics to track temporal changes in the gambling industry.
- Year-over-Year (YoY): A metric used to compare data from the current year against the previous year. It's calculated using the formula YoY = ((Year1 - Year2) / Year2) * 100. By comparing these two annual data sets, YoY provides insights into the year-long growth or decline of a particular metric or business aspect.
- Month-over-Month (MoM): This metric uses the same formula but with months instead of years and provides a more immediate snapshot. MoM insights are invaluable for businesses adapting quickly and recognizing fresh market opportunities or sudden challenges.
Blask interprets the YoY and MoM metrics as data comparisons between equivalent periods, specifically comparing today's date with the same date a year or a month ago, respectively.
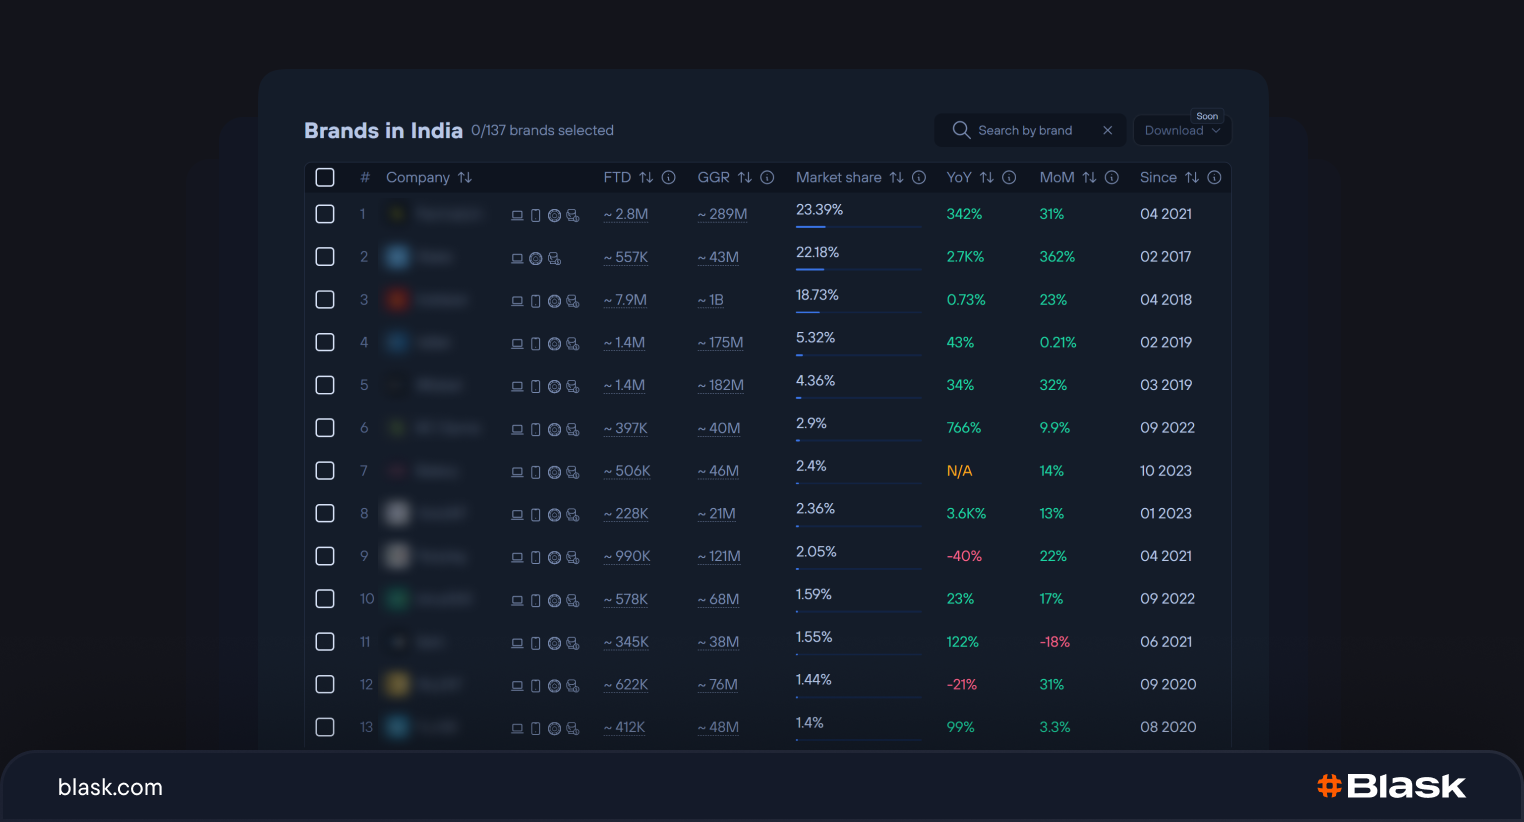
By grasping the overall market share and its fluctuations over months and years, you gain a deeper insight into your brand's evolving position and direction in the industry.
Making the most of the data: practical steps.
Track with precision.
Monitor your market share and the whole market volume over the entire duration of your brand's presence in a specific country, thereby assessing your stability and position in the competitive landscape. With Blask, you can get insights as frequently as every hour, giving you an edge in real-time decision-making.
Spot the trends and market cycles.
Utilizing Blask's data, you can identify market fluctuations and emerging trends and is to understand the underlying factors driving these changes. By analyzing patterns over time and contrasting them with industry events, you gain a deeper insight into consumer behaviors and preferences to determine market cycles. With this knowledge, you can proactively adapt your brand & marketing strategy, ensuring you remain ahead of the curve and capitalize on market dynamics.
Analyze market evolution.
Dive deep into the intricacies of the iGaming industry with Blask. Observing the current landscape, reflecting on comprehensive historical data, and analyzing patterns and shifts, you understand the market's dynamics. Use these insights to craft forward-thinking strategies and anticipate the future trajectory of the gambling industry, ensuring your brand stays relevant and competitive.
Study successful competitors.
When you notice a competitor excelling during a particular period, examining their marketing moves, outreach channels, and promotional tactics is crucial.
Valuable lessons can be learned by understanding what resonates with the target audience and what drives engagement. Integrating these insights into your approach sharpens your marketing & brand initiatives. It helps preemptively counter potential challenges, ensuring your brand remains agile and adaptive in the ever-evolving gambling landscape.
Collaborate or lead.
Team up with top brands in the market, benefiting from their reputation and success, or become a top player yourself. In any case, use Blask's data to make intelligent plans. Whether you work with others or aim for the top spot, having the correct information ensures you make the best decisions.
By understanding and acting on these insights, businesses can optimize their strategies and stay ahead of the curve.
As the CEO of Blask, I am proud to lead a team that combines technical prowess with visionary insights to revolutionize how we analyze market volume data in the iGaming industry. Our commitment to precision, innovation, and actionable intelligence empowers businesses to stay ahead of the curve and make informed decisions in the dynamic landscape of online gambling and betting.
— Max Tesla, CEO
Informed decisions drive success.
At its core, Blask leverages predictive search volume data, combines it with real-time industry metrics, and runs specialized algorithms to quantify market share through the Blask Index. It is inspired by Les Binet and James Honkins’ research showing search volume correlation with market share.
Additional metrics such as Performance Spectrum, YoY, and MoM comparisons reveal variations and growth patterns over time. Blask transforms raw statistics into contextualized, actionable intelligence by synthesizing indicators from multiple sources.
Blask enhanced search data with competitive intelligence on marketing campaigns and events that may impact metrics. This holistic approach offers a more comprehensive and nuanced view of the complex gambling ecosystem.
Blask data is available at unmatched granularity, from hourly to indefinite periods, for accurate real-time insights superior to Google's tools. Blask Index is a leading indicator for forecasting market changes and spotting emerging trends.
Blask is not just about presenting data; it's about giving the correct data in the most meaningful way, allowing businesses to spot minute changes, anticipate market moves, refine their marketing tactics, and make informed decisions about growth and development.
Blask is committed to giving you a comprehensive view of the market and supporting your growth every step of the way.
Unlock your iGaming potential with Blask!
Blask empowers you to make data-driven decisions, optimize marketing strategies, and drive significant GGR increases by providing unparalleled clarity about the iGaming market and your performance.
Curious about our precision? Discover our article "What is Blask?" and how Blask's cutting-edge technology is transforming iGaming analytics.
Ready to experience Blask in action?
- Sign up for free demo access and explore real data on the TOP-5 brands per country: Get a firsthand look at Blask's capabilities.
- Request a personalized demo with full access to data tailored to your niche and objectives. Fill out the form at blask.com to help us prepare use cases specific to your needs.
Need assistance?
Our support team is always here to help. Click the chat icon in the bottom right corner of your screen to connect with us instantly and get the answers you need.