- Updated:
- Published:
How to track competitors’ brand growth in iGaming
In a market where no one publishes their numbers, brand demand signals catch competitor growth months before it shows up in any report.
Operators don’t share their player acquisition numbers. Revenue data comes out quarterly at best, rarely broken down by market. The UK Gambling Commission publishes operator-level data with a six-month lag. Germany’s regulator, the GGL, released its first quarterly stakes breakdown in 2025 — still without brand-level splits.
That data gap is the same gap your competitors operate in. The brand that overtakes you next year probably won’t announce it. The question is whether you see it coming.
Demand-side signals close that gap. Here’s how to use them.
What brand growth looks like before the revenue data arrives
Before a player deposits, they search. They type a brand name, compare offers, check reviews. That search activity is the earliest signal of a brand gaining ground — and it happens weeks or months before it converts to registrations or revenue.
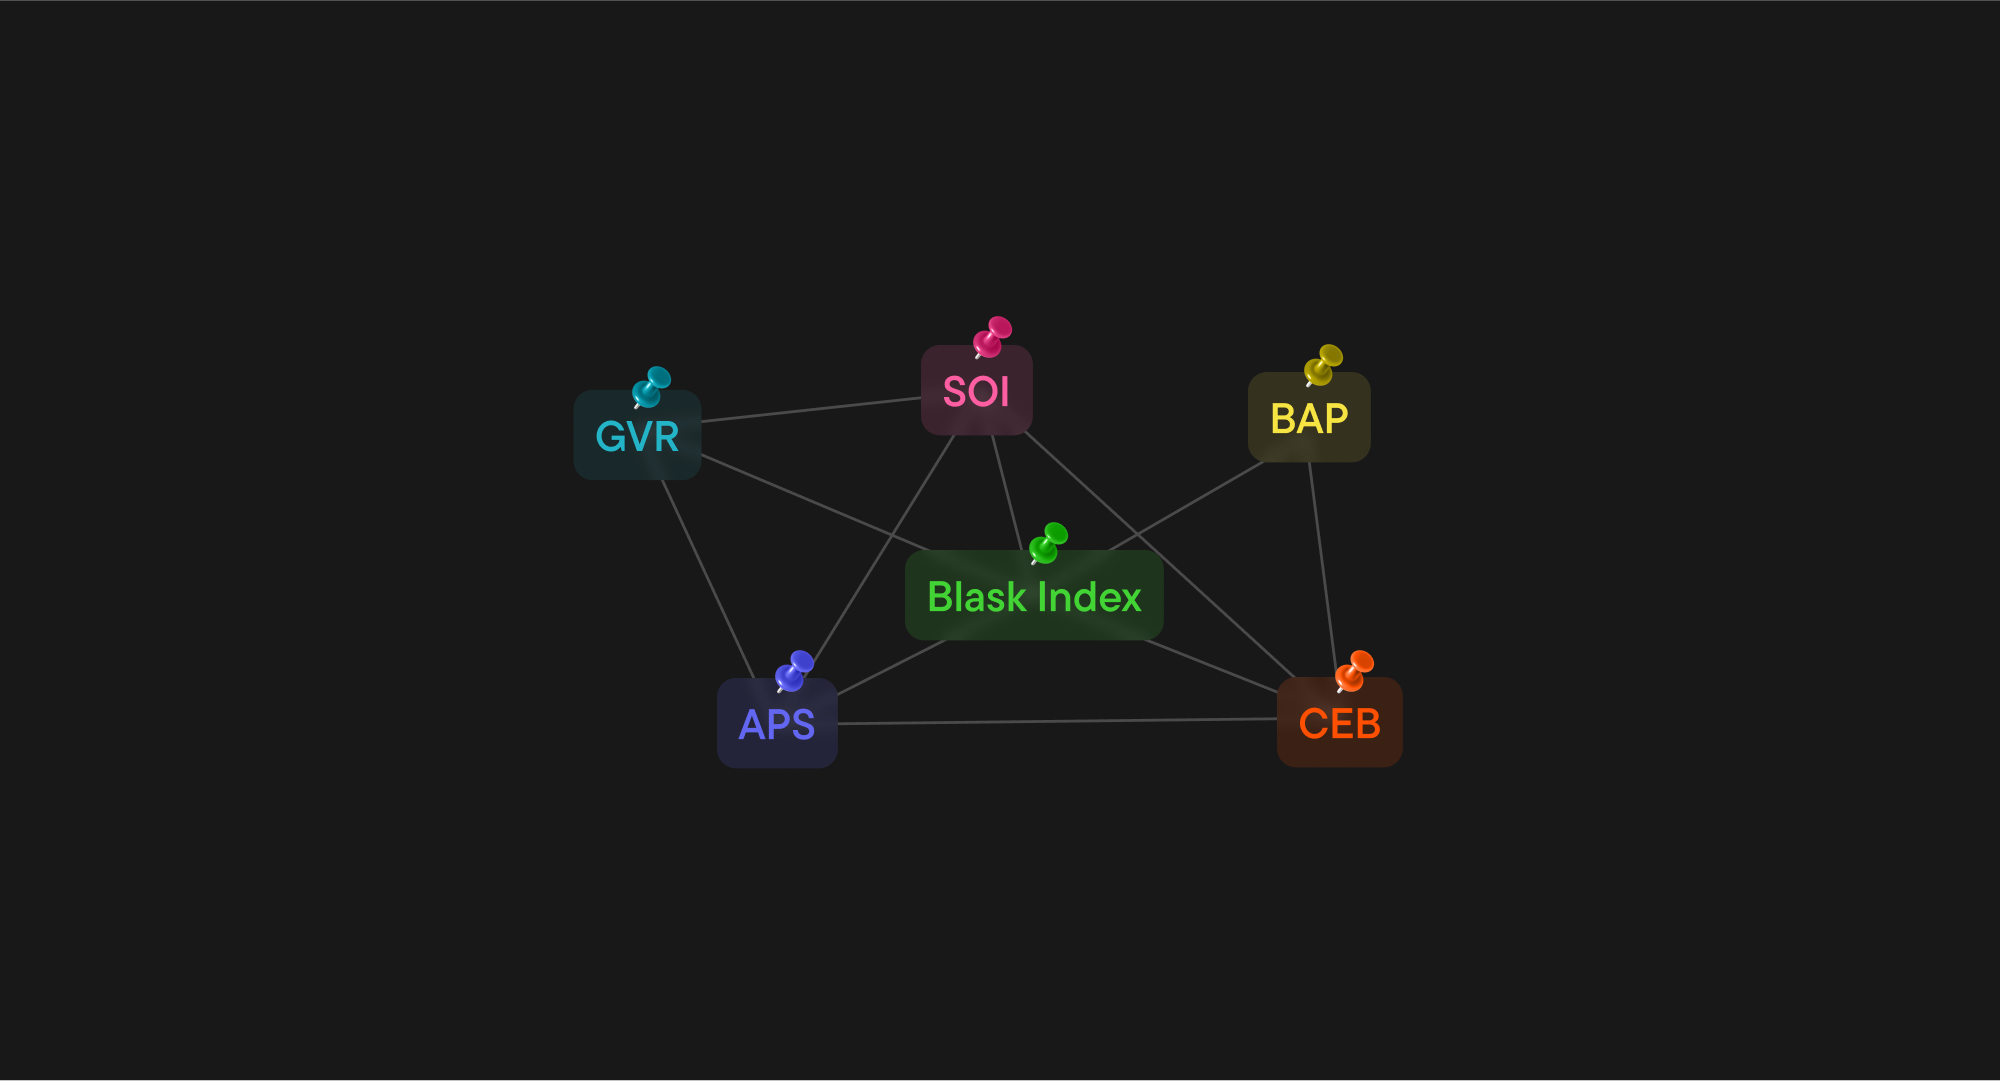
Blask Index is a leading indicator of brand growth. It captures player intent at the moment of search — before acquisition, before deposit, before any internal metric would register the change.
This is what makes tracking competitors’ brand growth in iGaming possible without access to their internal data. You’re reading the demand signal, not waiting for the outcome.
Step 1: Focus on the brands at your level, not the leaders
Tracking the market leader is useful as context. It doesn’t tell you who’s threatening your position.
In most iGaming markets, the top brand holds 10–20% of total demand. A brand at 0.5% and a brand at 15% are not competing for the same players. They have different budgets, different channels, different player demographics. Watching the 15% brand won’t warn you about the brand two positions behind you that’s been growing 30% for six months.
Brand Accumulated Power (BAP) is how Blask defines competitive proximity. It’s each brand’s percentage share of total market demand — normalized across all active brands, so a shift in one is a shift away from another. When a brand’s BAP grows, someone else’s shrinks.
How to find your competitive tier:
Blask’s country pages rank all active brands by BAP. Locate your brand, then identify the three brands above and two below. That’s the tier where growth changes affect you directly. Blask also surfaces the four nearest competitors automatically on any brand’s profile page, calculated from the most recent month.
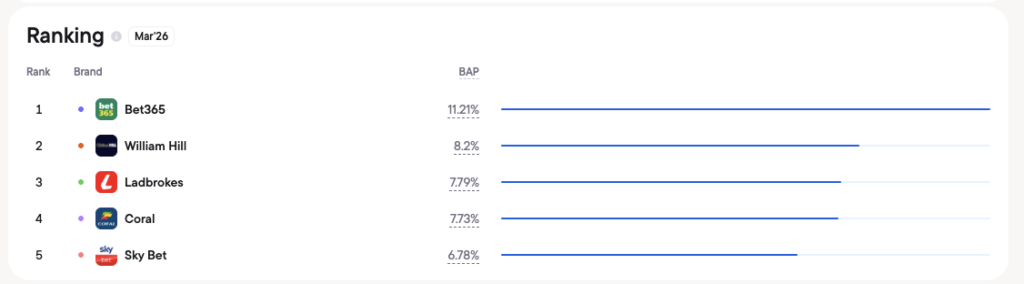
UK data from 2025 shows why this matters. Bet365 led the market at rank 1. William Hill held rank 2 but fell 12.63% year-over-year. The brands that absorbed that lost demand weren’t the ones watching William Hill — they were the brands ranked 3–5 who were positioned to pick it up: Ladbrokes grew 21.88% and Paddy Power grew 17.72%.
Step 2: Read the three signals of competitor brand growth
Once you have your competitive tier, three metrics show which brands are growing and at what speed. Together, they make share of search as a leading indicator especially useful in iGaming, because they show movement before it becomes visible in revenue.
YoY Blask Index change
Year-over-year is the cleanest measure of durable brand growth in iGaming. It strips out seasonal patterns and shows whether a brand’s demand has increased, stalled, or reversed over twelve months — not just had a good month.
Two thresholds that warrant action: above 20% YoY means the brand is growing meaningfully faster than market rate. Above 10 BAP percentage points gained in a year means the competitive dynamics in your tier are being rewritten.
BAP shift
BAP change is the positional measure. A brand can grow its Blask Index in absolute terms while losing BAP — meaning the market grew faster than they did. That’s a different story than gaining share. Watch both, and distinguish between them.
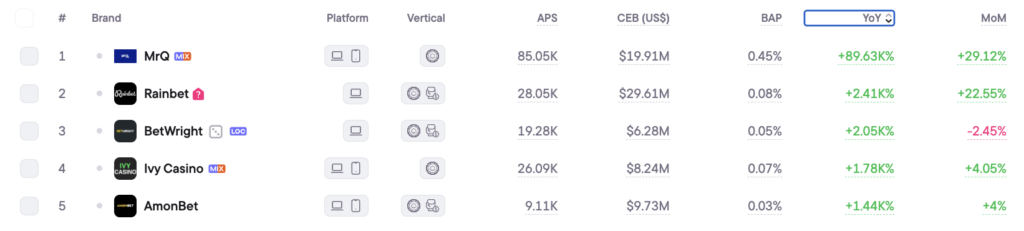
APS growth
Acquisition Power Score (APS) estimates how many new customers a brand’s current market position should deliver. Blask calculates it as a min–avg–max range, because player acquisition varies with competitive intensity, campaign activity, and season.
A rising APS is a direct signal that a competitor is building acquisition capacity in your market. It quantifies the growth: not “they seem to be growing” but “they added an estimated 200K new customers this year.”
Step 3: Read the UK market data
The UK, for example, had 335 active brands in 2025 with a combined Blask Index of 586.7M and total market CEB — Blask’s revenue estimate built from demand and competitive positioning, not operator financials — of $11.5B ($8.4B–$20.9B range). This kind of iGaming brand market share data is what makes it possible to see not just who leads, but where the next competitive shift is forming.
The interesting growth stories were below rank 3.
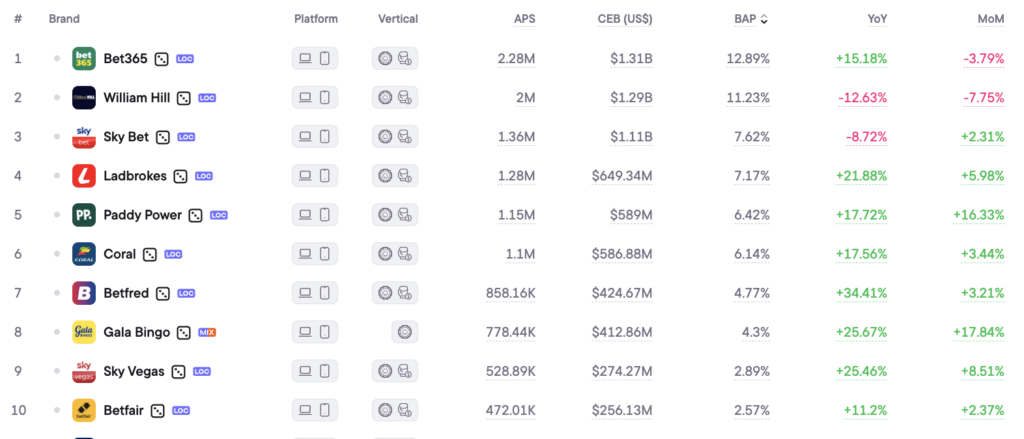
Betfred grew 34.41% year-over-year — the highest rate among the UK’s established top 10. Ranked 7th, it added a third to its demand capacity in one year. APS reached 858K average (644K–1.5M range). For any brand ranked 6th or 8th, that’s their acquisition pool narrowing.
Gala Bingo grew 25.67% and Sky Vegas grew 25.46% — both outpacing the headline brands in growth rate. Neither was a new entrant. Both found growth in a market most operators were treating as mature.
This is what tracking competitors’ brand growth in iGaming looks like in practice. The official UKGC operator data for this same period won’t be available until mid-2026. Blask Index tracked it as it happened.
Step 4: Read the Germany 2025 data — the challenger pattern
Germany’s market ran 348 active brands in 2025, with a Blask Index of 196.4M and market CEB of $2.5B ($1.6B–$5.3B range). The growth dynamics were sharper than the UK — regulatory clarity from the GGL opened the licensed market to challengers that weren’t present two years prior.
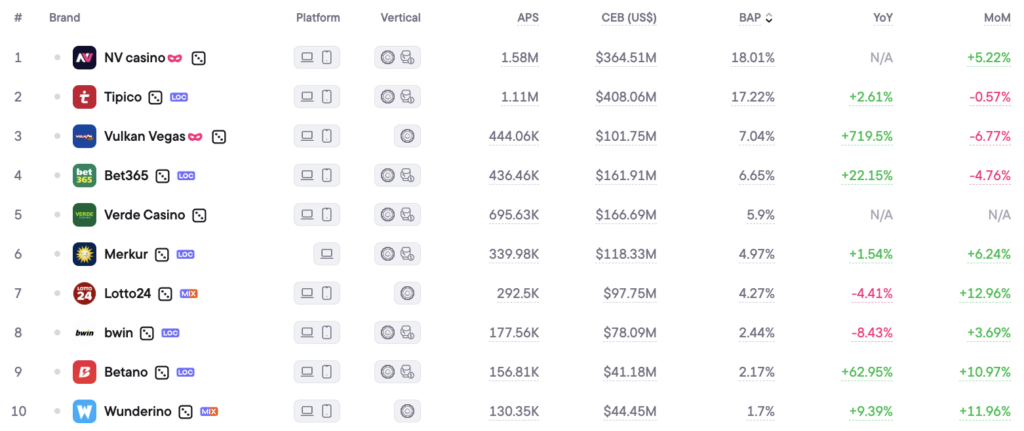
Vulkan Vegas: +719.54% YoY Blask Index. In 2024, APS averaged 77K new customers annually (39K–193K range) and CEB sat at $38M ($19M–$95M). In 2025, APS reached 444K (222K–1.1M range) and CEB grew to $102M ($51M–$254M). Nearly 6x growth in acquisition capacity in twelve months.
In January 2024, this brand sat outside the German top five. By end of 2025, it held rank 4. Every brand that had ranked near it in 2024 faced a materially different competitive environment — one that was visible in Blask Index throughout the year, long before any regulatory filing confirmed it.
Betano grew 62.95% YoY, with APS averaging 157K (118K–274K range) and CEB at $41.2M ($30.9M–$72.1M). A brand building its European footprint methodically, with Germany confirming the strategy is working.
This is the challenger pattern: a brand outside your top five, no legacy retail presence, growing entirely through digital demand. The signal appears in BAP and YoY Blask Index data months before anyone would label them a competitor.
Step 5: Build a tracking system, not a one-time check
Tracking competitors’ brand growth in iGaming only works as a consistent practice, not a quarterly report you run when something already feels wrong.
A practical system:
- Monthly. Pull Blask Index for your competitive tier. Flag any brand with MoM growth more than 5 points above the market average.
- Quarterly. Review APS and CEB for your tier. Check YoY changes. Add any brand outside your tier that crossed 20% YoY growth to your watchlist.
- Triggered. When a competitor launches a campaign, signs a sponsorship, or enters a new product category, check their Blask Index and APS within 30 days. You’ll be able to measure whether the move actually shifted demand or just generated coverage.
For new entrants — brands with APS growth above 100% and no prior-year baseline — watch the trajectory. Player acquisition costs across iGaming are rising, and a new brand absorbing those costs while scaling is signaling both strategy and funding runway.
The point of all of this
Demand signals are early. Revenue data is late. By the time a competitor’s growth shows up in a quarterly release, you’ve already ceded market position.
An effective iGaming brand benchmarking practice starts there: with the ability to read demand before revenue confirms it. Tracking competitors’ brand growth in iGaming means reading the demand signal — BAP, APS, YoY Blask Index — before the outcome is confirmed. The UK and Germany data from 2025 shows what that looks like: brands growing 25–720% in demand terms while the official data lagged twelve months behind. The growth curves were visible the whole time.