
- Updated:
- Published:
Player segments follow behaviour, value and lifecycle

Player segmentation in iGaming groups people who already have an account. The groups run on how they play, what the relationship is worth, and where they are in it. Country segmentation groups markets. The two cuts answer different questions.
Behaviour, value and lifecycle
Behaviour is what the player does: product, stake size, session length, recency. Value is what the relationship returns over a window, which is lifetime value once the cohort is old enough to measure. Lifecycle is the stage — new, active, dormant. CRM is the system that holds those three labels and the offers attached to them.
A VIP tier is a value label on a player. Country of the account can sit inside the same record as a field. It is still a person-level cut: one account, one country code, one set of labels.
Country is a different cut
Country segmentation asks where the demand is, and how large the revenue baseline is. In July 2026 Blask’s Competitive Earning Baseline averaged $1.08B in Brazil ($798M–$1.91B), $989M in the UK ($707M–$1.83B) and $240M in Germany ($153M–$501M). Those figures size the market. The player inside it is a separate record.
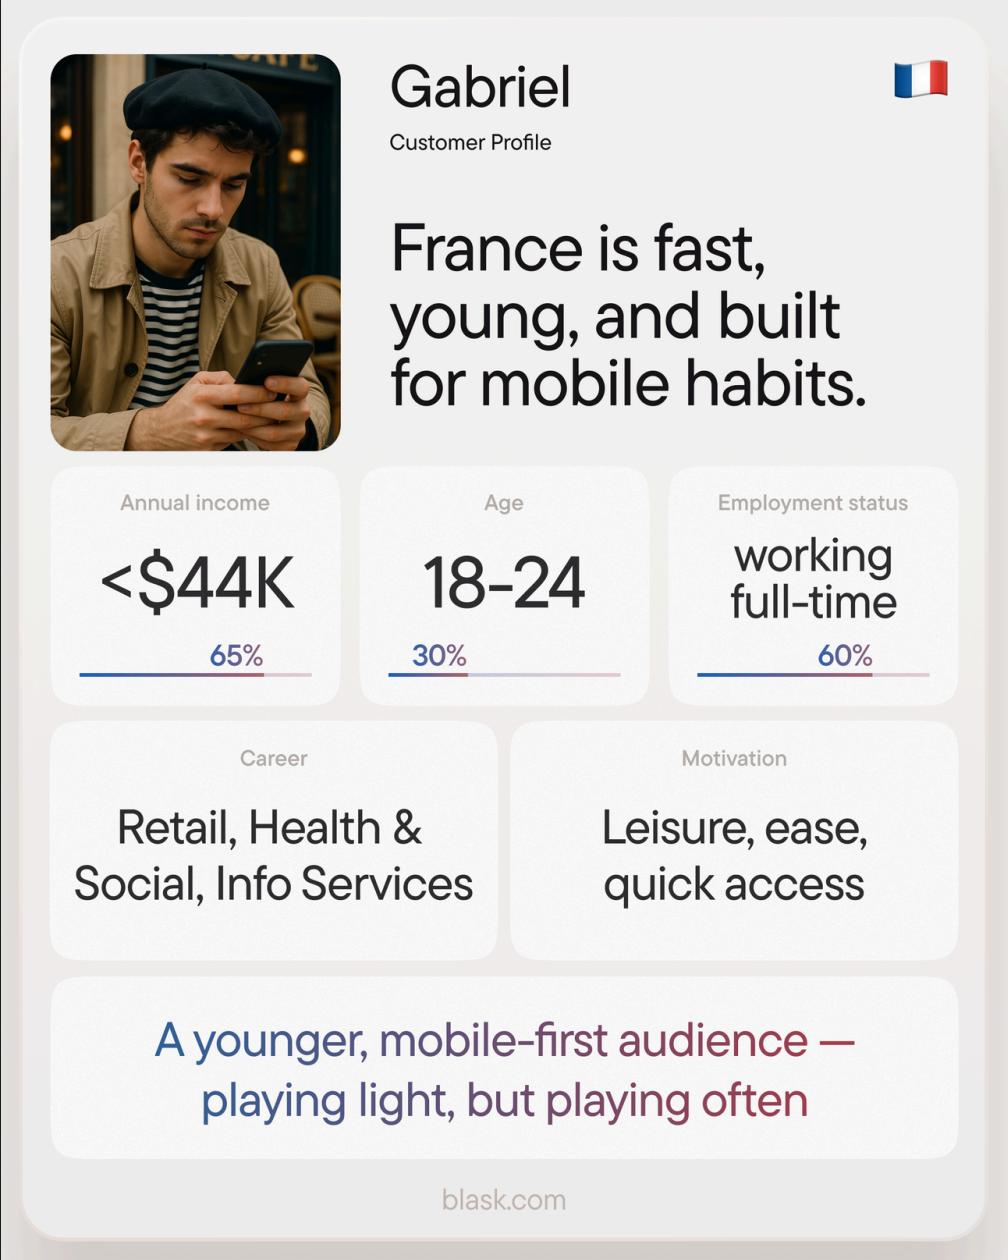
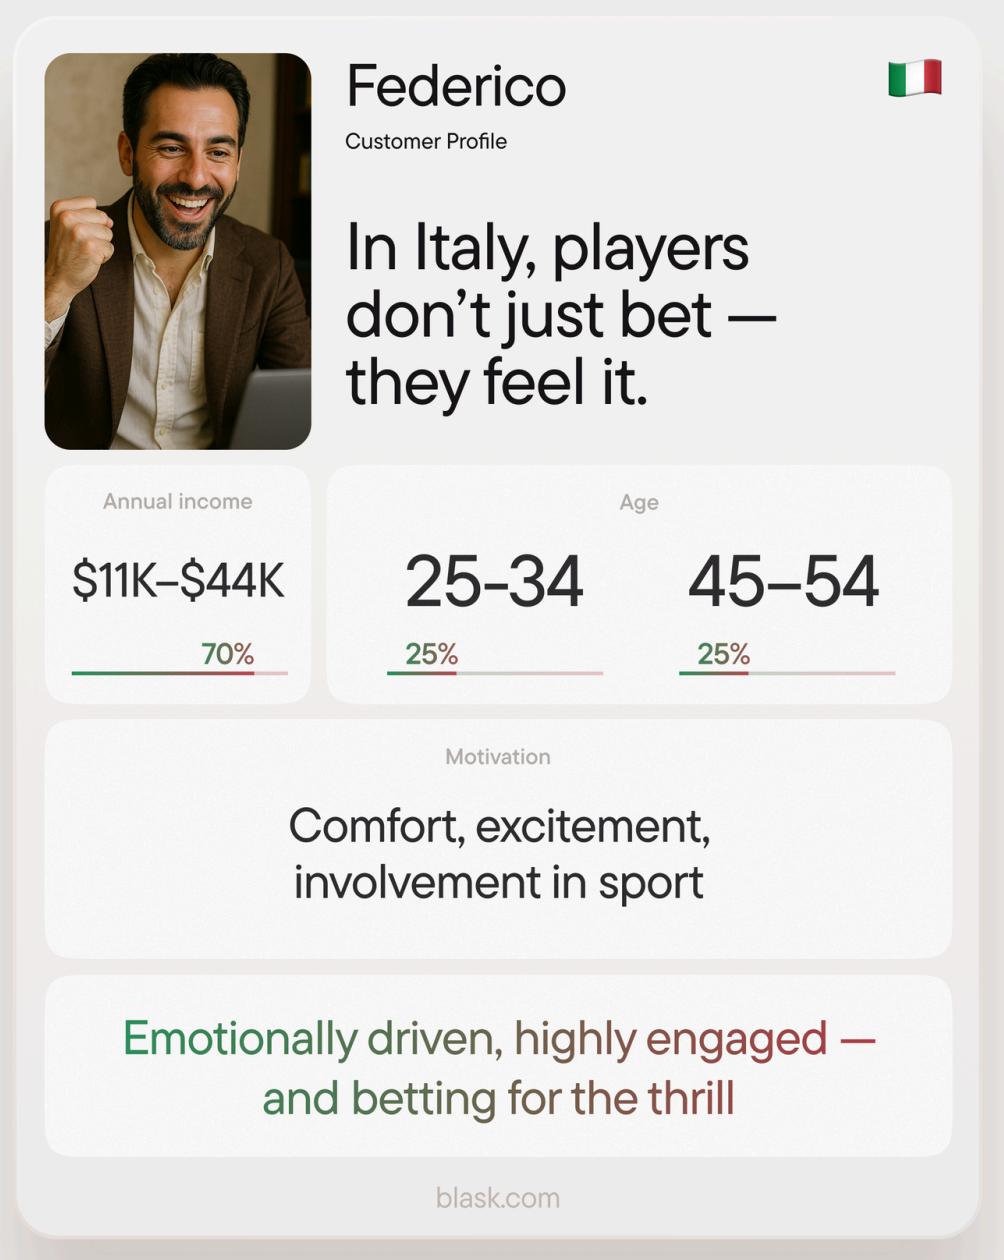
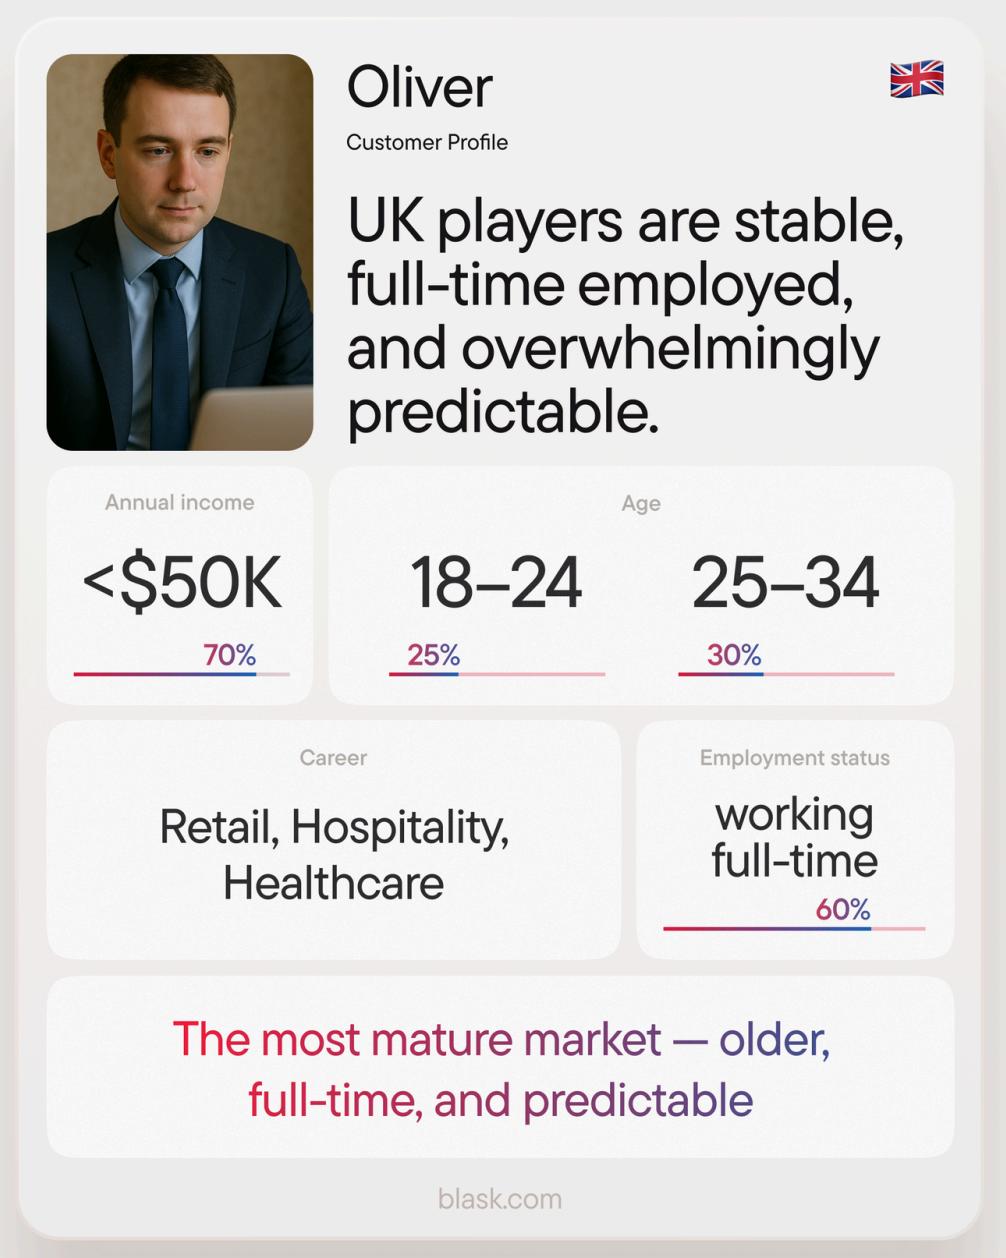
| Market snapshot | What the data say | Why it matters for segmentation |
|---|---|---|
| France | A mobile-first, lower-ticket crowd that plays often but small. | Colour the lobby with crash/instant games, cap entry stakes and push lightning-fast KYC flows. |
| Italy | Emotion-driven bettors who chase the thrill. | Schedule boosters around live Serie A and roll out in-play combos; lean on storytelling creatives. |
| UK | The most mature, routine-led market. | Promote safer-gaming tools, loyalty tiers and accumulation specials for payday cycles. |
Latin America shows why a regional average fails even after the country is chosen. Argentina’s profile is sports-led, with casino framed as earning money. Mexico’s core is younger, with a stronger live-casino share. Venezuela’s stated job is passing time. The country profiles are the data. Behaviour, value and lifecycle are the CRM vocabulary laid on top.
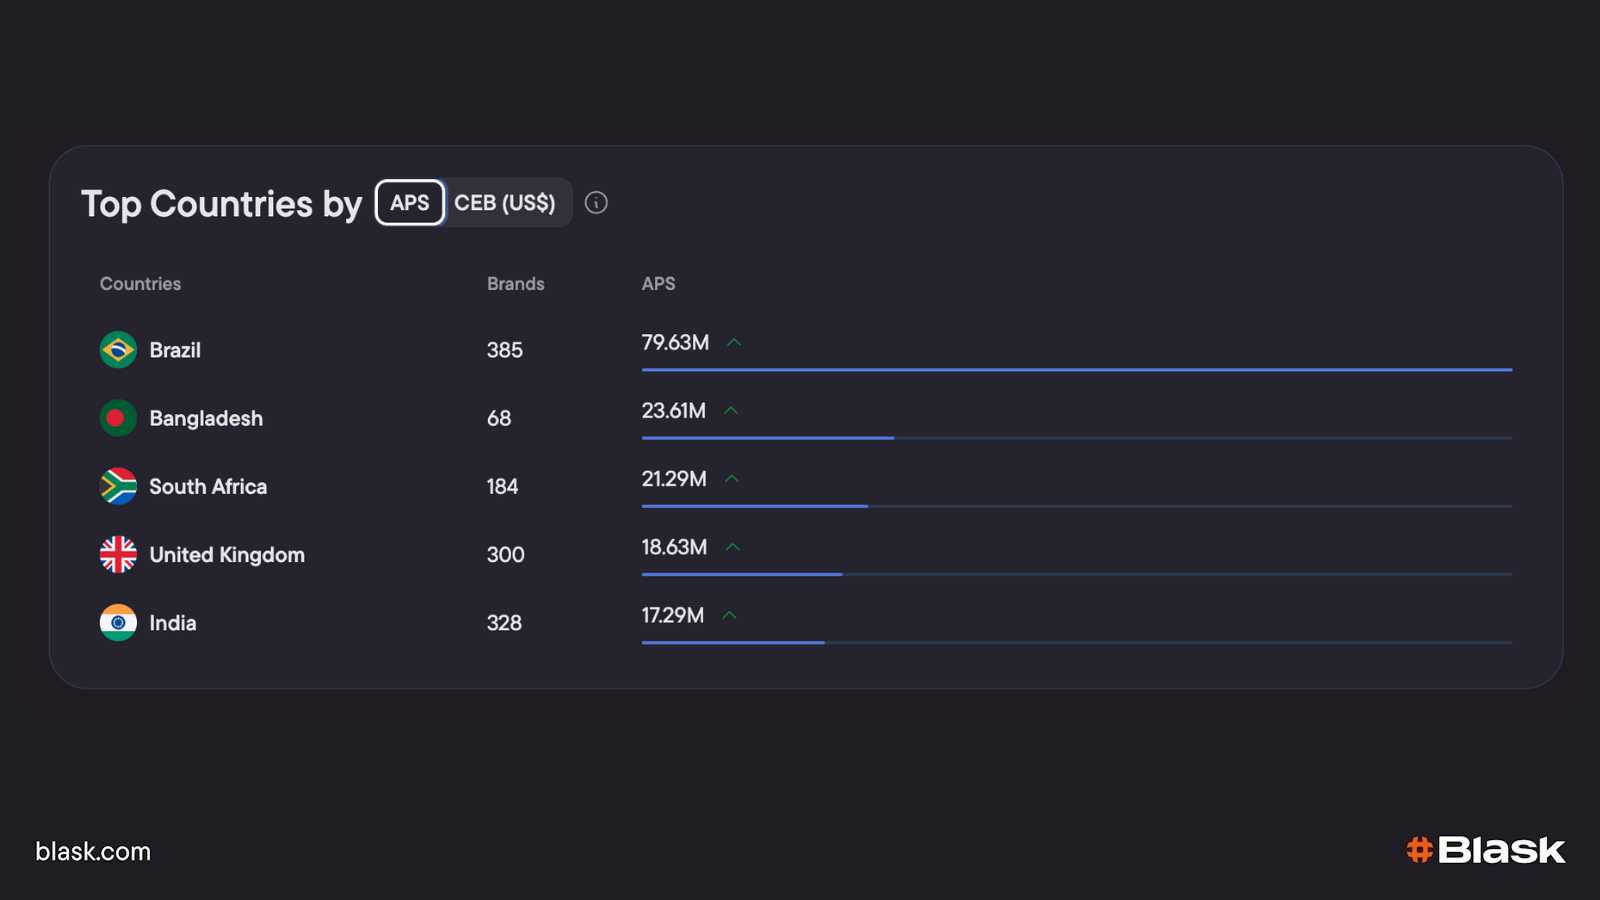
APS for All countries
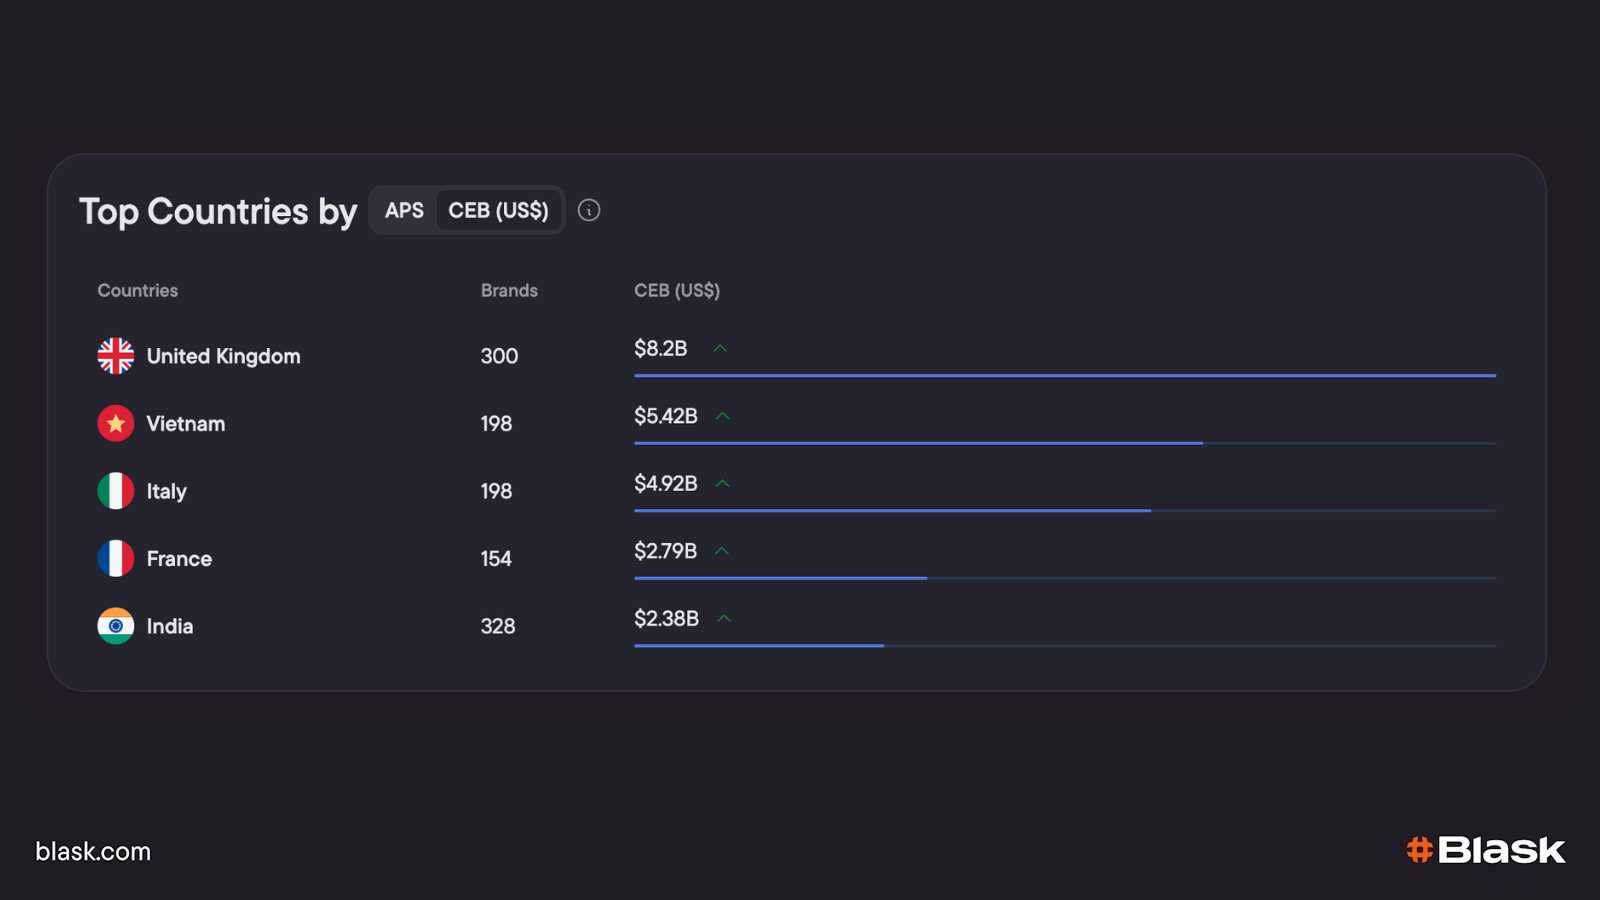
CEB for All countries
| Signal pattern | What it means | Strategic move |
|---|---|---|
| High APS, modest CEB (e.g., 🇮🇳 India ~ 17M APS, $2.4B CEB) | Mass-market, low-stake culture — players are plentiful but budgets are thin. | Push micro-bets, UPI/PayTM rails, cricket or crash games; scale via volume not VIP. |
| Mid APS, high CEB (e.g., 🇫🇷 France ~ 4M APS, $4.9B CEB) | Fewer sign-ups, but heavy average wallets. | Front-load KYC flow for high-value onboarding, roll out VIP tiers and retention clubs early. |
| Both APS & CEB high (e.g., 🇧🇷 Brazil ~ 79M APS, $8.2B CEB) | Land-grab phase and healthy spend per head — the sweet-spot growth market. | Split budget 50/50 between acquisition bursts around football magnets and stickiness features that lock in spend. |
All-Metrics country card – what every number actually tells you.
Blask’s All-Metrics toggle swaps the plain flag view for a full market dossier built from four panels.
Here’s what each block means in practice and how operators use the figures to size-up risk, runway and marketing tone before spending a cent.


| Panel | Key fields | Why it matters for an iGaming roll-out |
|---|---|---|
| Law | • Gambling status (Reg / Unreg) • Betting status (Reg / Unreg) | Two blue “Reg” badges mean licences exist and payment rails are bank-friendly; at least one red “Unreg” warns you’ll be working through grey-market processors and should pad CPA targets to cover higher churn. |
| People | • Population (absolute size) • Annual growth rate (demographic tail-wind or head-wind) • Age structure (% 0-14 / 15-64 / 65+) • Median age (total, male, female) | Population × growth rate sets the upper ceiling on long-term FTD supply. Age mix hints at product skew: a 25-year median (India) favours mobile slots and esports; a 47-year median (Germany) leans toward sportsbook and lotteries. |
| Society | • Internet-user count and penetration • Literacy rates • Top languages • Urbanisation | High penetration plus >95 % literacy means digital onboarding and longform KYC copy won’t scare users away. A single dominant language cuts localisation cost; a fragmented list (e.g., Nigeria) pushes you toward pictogram UX and multi-language CRM. |
| Economy | • Real GDP (size) and three-year trend • Real-GDP growth (momentum) • GDP per-capita | GDP growth tracks disposable-income tailwinds; stagnant or negative growth (currently Spain) tells you to discount CEB projections and tighten bonus ratios. GDP per-capita anchors realistic ARPU: <$5 k suggests micro-betting; >$50 k supports VIP tables and high-limit markets. |
Trigger offers at the exact hour — and seat in the lobby.
Hourly Blask Index + BAP
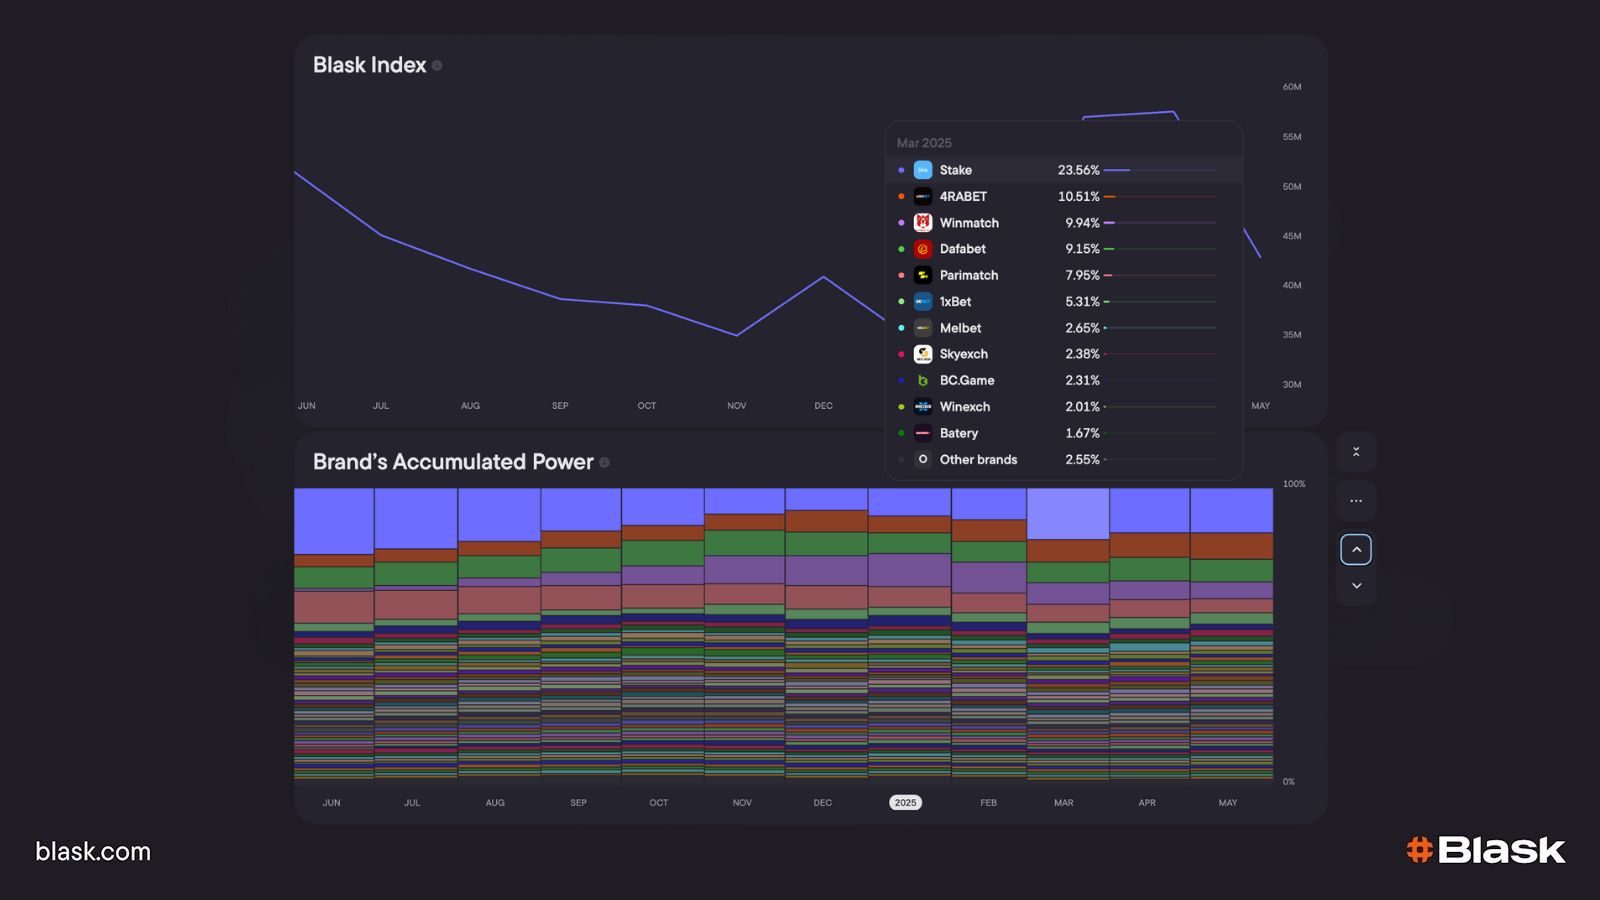
Blask pushes a fresh Index data-point for every country and brand every 60 minutes; BAP layers that pulse with visibility weightings so you can see, in real time, whether attention is compounding or stalling.
📖 Read more: BAP is all you need
How operators use it
Hourly snapshots of the Blask Index show exactly when traffic crests.
On May 31 2025 the curve for the UK crested at 01:00 BST (00:00 UTC); Germany hit its high at 02:00 CEST; France followed a few minutes later, also around 02:00 CEST.
Those peaks appear every night, so time your push-messages or promo drops for the 15-minute slice that tops yesterday’s line and you ride today’s wave.
💡 How to act: schedule push notifications, influencer reels or bonus codes inside the 15-minute window that led yesterday’s curve; watch today’s BAP bar tick up in the next refresh.
Game Visibility Rank (GVR)
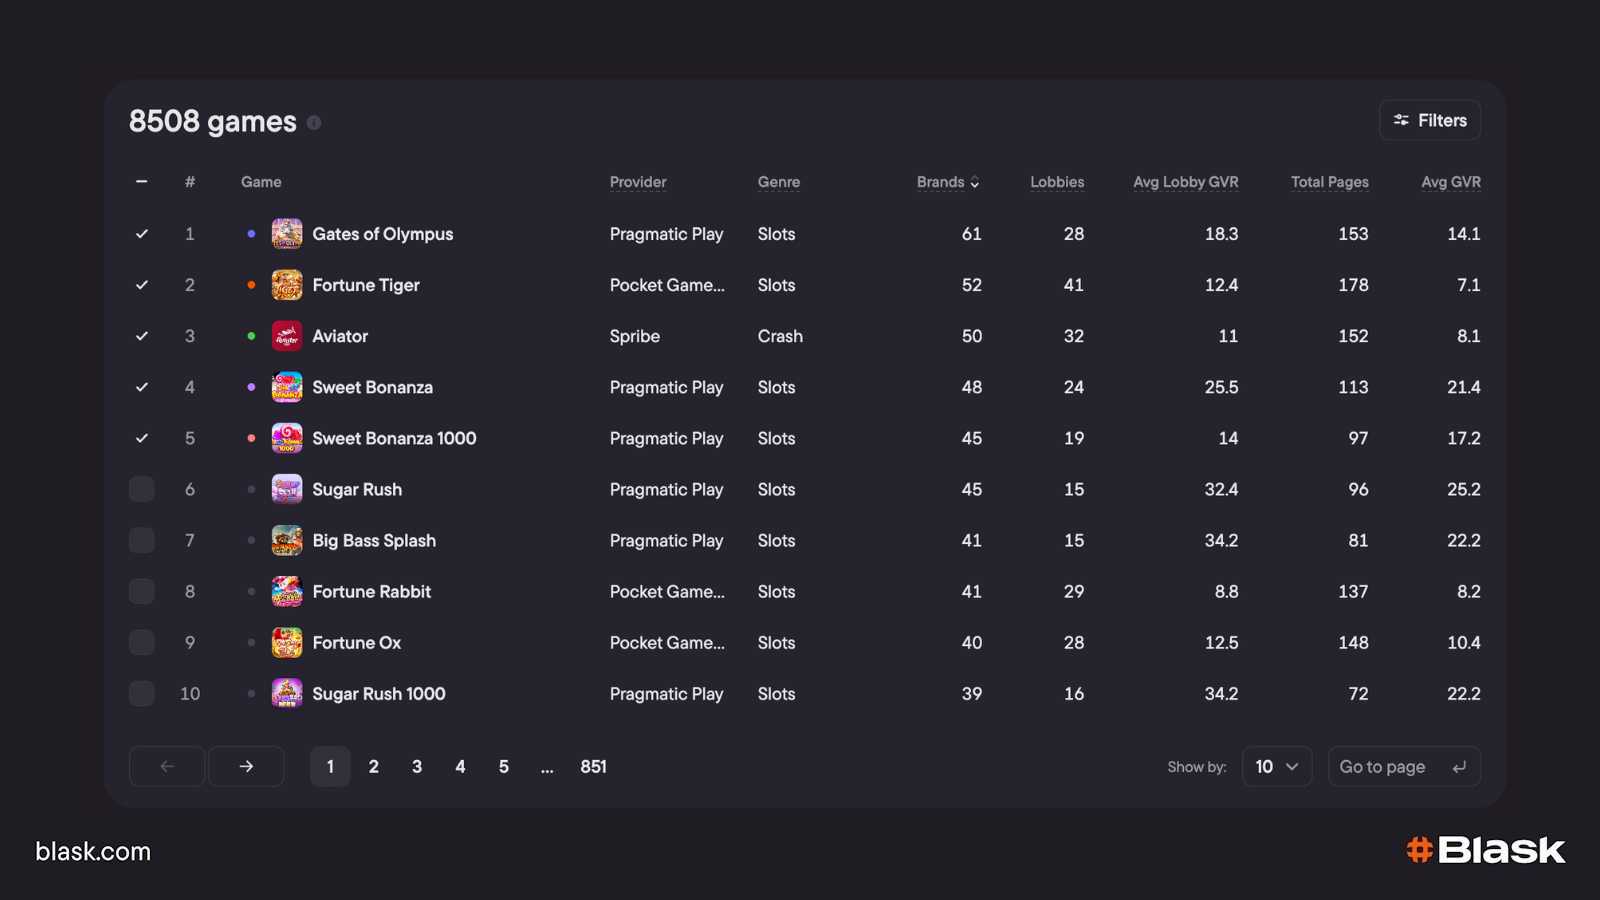
Blask’s CV pipeline screenshots every lobby each night, recognises >10 000 game logos, numbers the first 100 tiles left-to-right, top-to-bottom, and outputs a single figure: GVR.
📖 Read more: Inside Blask’s lobby-position engine
A promo only counts if the game is sitting in seats 1-10 when the push lands; anything buried beyond row two misses 95% of clicks.
Quick checks
- Monday morning: did the weekend banner move the title from seat 23 to seat 4?
- Sort GVR by provider: if a premium studio has zero games in the top-20, you’ve got leverage for the next rev-share call.
Together, hourly Index + BAP tell you when to fire, and GVR tells you where to point the blast.
Cluster players the AI way.
Combine raw telemetry (bet type, device, recency, frequency) with Customer Profile fields and feed them into a gradient-boost clusterer:
| Cohort | Key signal mix | Best-in-class tactic |
|---|---|---|
| Flash-Odds Fanatics | Mobile, sports-first, push-responsive | 15-min flash boosts on hourly Index peak |
| Multi-Product Explorers | 3+ vertical clicks in 48 h | “Try-3-games” bundle |
| Crypto High-Tempo | USDT, crash games, INR deposit | Stake’s “Early-Six-You-Win” promo |
Watch BAP bars climb while the promo is live.
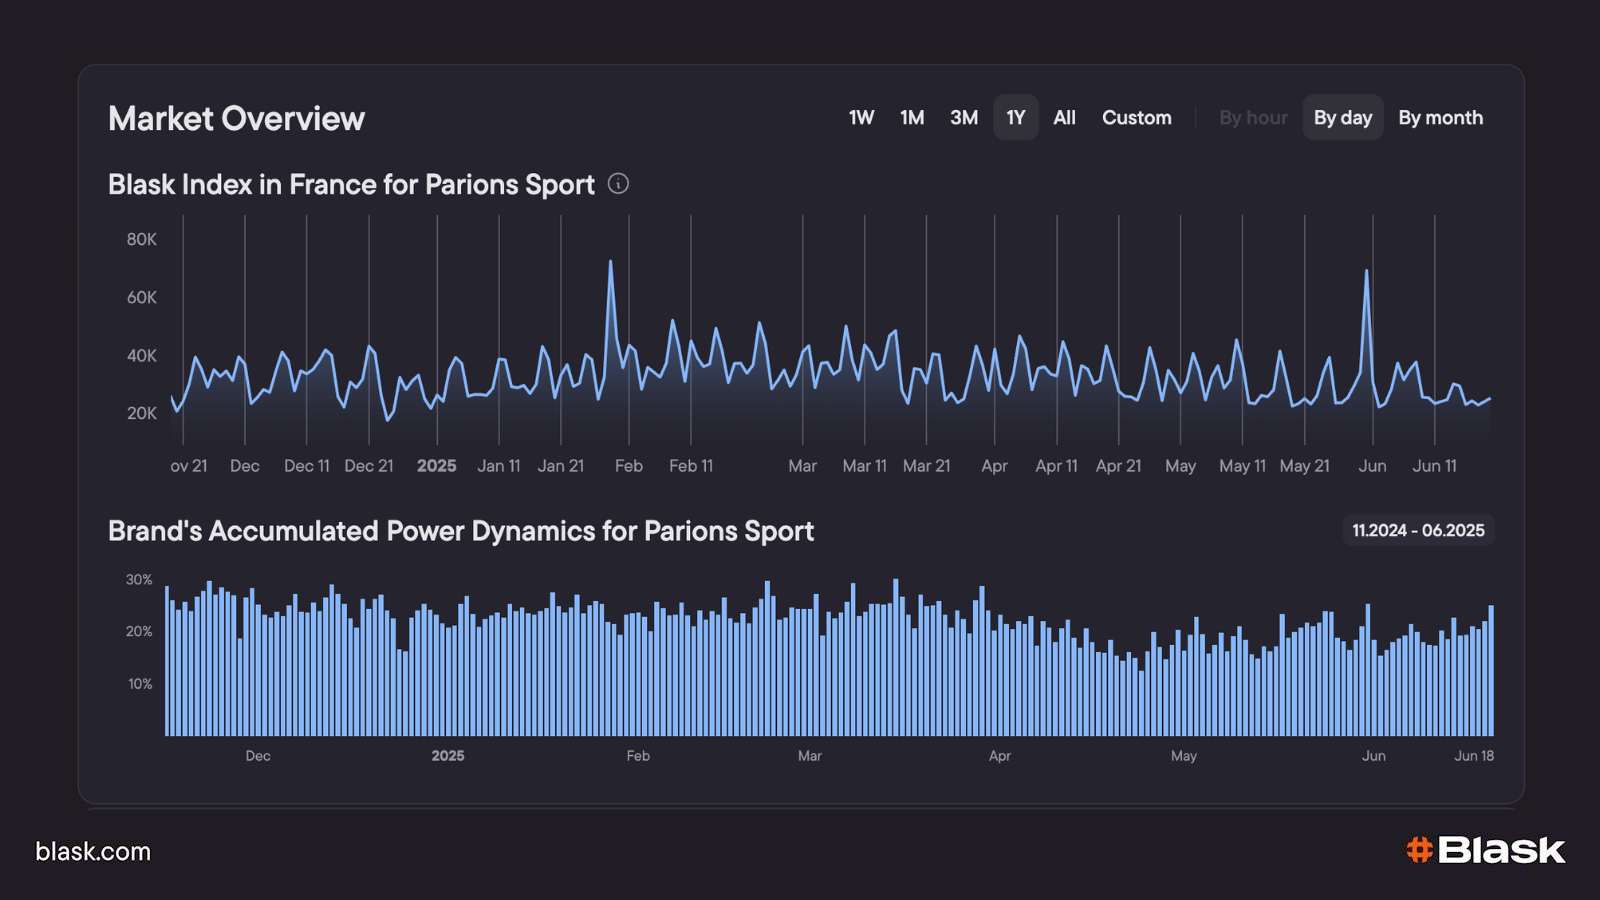
Blask’s Brand’s Accumulated Power panel updates every hour, so you can treat it like a heart-rate monitor for a running campaign.
| What to look for | Why it matters | Immediate actions |
|---|---|---|
| Your bar doesn’t rize after two hourly refreshes | The push isn’t compounding attention; you’re merely matching background noise. | 1️⃣ Switch the bannered game to a top-10 lobby seat (check GVR). 2️⃣ Sweeten the odds/bonus. 3️⃣ Retarget the segment that opened but didn’t play. |
| Your bar climbs but the slope flattens before the event ends | Early interest, then drop-off—message frequency or creative fatigue. | 1️⃣ Rotate a fresh creative. 2️⃣ Release a second-leg incentive (e.g., “win again and get a 20 % boost”). |
| Your bar punches above | Promo is genuinely viral—let it run. | 1️⃣ Clone to adjacent cohorts. 2️⃣ Raise stake limits only once risk tooling confirms exposure. |
Because feedback is hourly, you correct course before burning an entire match day’s media spend.
Grade the sprint with APS & CEB.
Blask drops two benchmark gauges on the 10-th of every month, covering the previous calendar month:
| Metric | What it predicts | You compare against | If you’re in the red ⬇︎ | Typical fixes |
|---|---|---|---|---|
| APS (Acquisition Power Score) | New customers range the market said you could capture. | Internal FTD ledger. | Funnel is leaking – you attracted clicks but lost sign-ups. | ▶️ Trim KYC steps ▶️ Clarify welcome-bonus rules ▶️ Localise payment rails |
| CEB (Competitive Earning Baseline) | USD GGR corridor a brand with your BAP & APS should reach. | Actual GGR in BI / finance stack. | Monetisation gap – players arrived but didn’t generate expected value. | ▶️ Sharpen cross-sell journeys ▶️ Boost retention/loyalty triggers ▶️ Introduce higher-margin verticals |
Bottom line
Behaviour, value and lifecycle describe a player. Competitive Earning Baseline describes a country. July 2026 puts Brazil at $1.08B, the UK at $989M and Germany at $240M on that second cut.