- Updated:
- Published:
Blask Index
What is Blask Index in iGaming
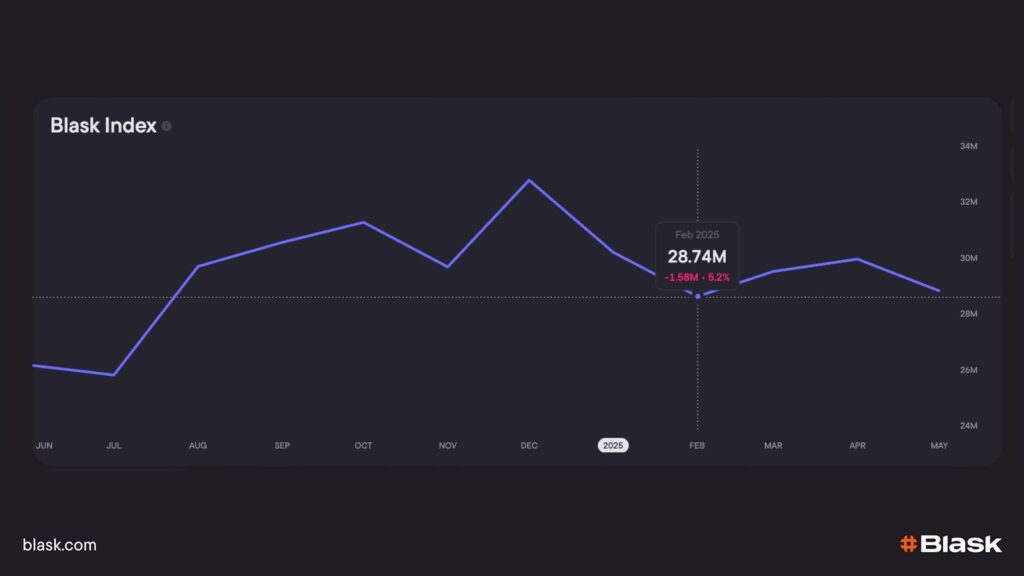
Blask Index is a real-time, dynamic metric that tracks iGaming market volume and brand share — updated hourly, powered by analysis of search query data
Think of it as the Nasdaq or Dow Jones of the iGaming world: a continuously refreshed pulse reflecting player interest and competitive positioning.
This near-instant market intelligence transforms static reports into actionable insights, letting operators, providers, affiliates, and investors gauge trends as they unfold, instead of reacting weeks or months later.
🔍 Read more: What is Blask Index.
Brand Discovery: mapping the iGaming landscape
Every journey begins with knowing the territory — and for Blask, this means identifying every brand in the market, big or small. We don’t rely on manual lists or guesswork.
Instead, our system starts with a comprehensive sweep: mining search keywords like “online casino” (in every local language) to find candidate sites. These sites then pass through advanced filters:
- An AI-powered computer-vision layer scans homepage screenshots for visual cues — game thumbnails, chip stacks, live‑dealer icons — flagging genuine iGaming brands with over 90 % confidence.
- A language model analyzes site text to weed out affiliates or reviews.
- Finally, human reviewers validate and refine the list, ensuring every real operator is included.
In Brazil alone, that means mapping over 386 active brands, and updating continuously.
🔍 Explore: How does Blask search for new iGaming brands?
Calculating Blask Index
Once brands are discovered, Blask measures how much player interest they command.
Every hour, the platform pulls anonymised search query data for each brand. But it goes further — it filters out irrelevant or negative keywords (“scam”, “bonus issues”, etc.) and rebases the cleaned keyword volumes across the country’s total search pool.
This produces the Blask Index: a real-time, Nasdaq-style gauge of brand demand and market share, with up to 95% correlation with actual market performance .
Brand-level indices roll up into a country-level Blask Index, showing whether a market is expanding or contracting — and which brands are gaining ground. This data is updated hourly, making Blask Index the definitive real-time barometer for player interest
Blask Index granularity
Blask Index is computed hourly for individual brands (operators), giving you a real-time pulse of their popularity. Summing across all operators produces the country-level Blask Index, a direct indicator of market growth or decline. You can instantly see whether a market is heating up or cooling down.
For individual games, we currently calculate Blask Index on a monthly basis, capturing longer-term trends. We’re actively expanding toward daily — and eventually hourly — granularity to deliver even sharper insights.
Blask Index Trends: see the signal behind the noise
Blask Index is unmatched at capturing real-time market interest. But during major events, launches, and promo cycles, short-term spikes and dips can make graphs noisy — and that noise can hide the underlying direction.
Many users told us they want a fast, high-level read:
Is this market growing, stagnating, or declining right now?
What Blask Trends is
Blask Trends is a new view inside the Blask Index widget that suppresses extremes and smooths volatility to reveal the clean market trend.
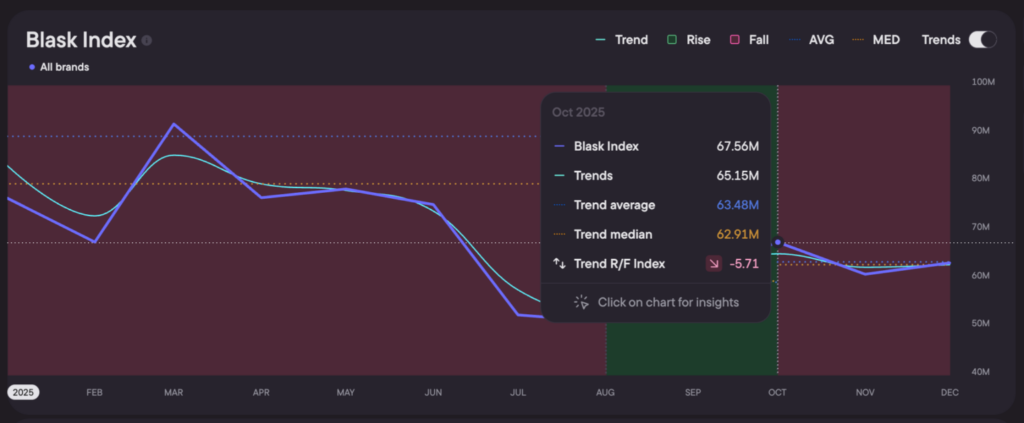
On top of the smoothed line, Blask classifies the current regime into one of three states:
- Growth
- Stagnation
- Decline
You can toggle the Trends overlay and set it as the default view. Tooltips help you navigate the updated interface.
What’s more: Trends can show AVG and MED values for the selected period—so you always have a stable reference for “normal.”
📚 Learn more: Macro-Dynamics: how to measure movement, beyond noise
Market Explanation: the “why” behind every trend shift
Blask Index quantifies what is happening in a market. Blask Trends reveals which direction it is heading. Market Explanation answers the harder question: why.
Launched in January 2026, Market Explanation is an AI-powered analytical layer built directly into the Blask Index chart. Click any point on the trend line, and the system returns a structured, source-cited explanation of the forces behind the current trend segment — growth, stagnation, or decline — in seconds.
How Market Explanation works
- Trend detection. Blask identifies each trend segment from the Blask Index data — its direction, duration, mean and median values — and marks the period to be explained.
- Automated research. The AI conducts a structured investigation across six driver categories: the sports calendar, regulatory changes, payment infrastructure shifts, operator activity, macroeconomic conditions, and seasonality.
- Evidence synthesis. Only high-impact, verifiable events survive the filter. Each claim is tied to a numbered, linked source. No speculation. No unattributed generalisations.
- Structured output. The result is delivered as a formatted analytical brief containing an overview, the key drivers, notable events in the period, and a complete source list.
Explanations regenerate automatically four times daily and update whenever underlying trend segments shift — ensuring that conclusions remain aligned with the freshest data.
What you see inside
Click the Blask Index chart within the Trends window, and Market Explanation surfaces:
- Overview — a concise diagnostic of what drove the trend.
- Drivers of growth or decline — categorised by type: sports, regulation, payments, operators, macro factors, seasonality.
- Key events — specific policy changes, tournament dates, operator launches, or economic milestones that shaped the period.
- Sources — numbered citations linking directly to original reporting.
The output reads like an analyst brief, not an automated summary. Every data point traces back to evidence.
Why this matters
- Instant clarity: read market direction without being misled by one-off spikes (finals weekend, headline sponsorships, bonus surges).
- Better timing: pair the trend with time-of-week / time-of-day patterns to decide when to launch, pause, or rotate campaigns.
- Operational focus: concentrate spend where the state = Growth, stay alert in Stagnation, and protect unit economics in Decline.
Real-world use cases
1. Optimize promo timing around IPL
During IPL match days, Blask Index in India spikes dramatically with yearly peak activity now reaching over 3 million points, up from ~437k in 2019.
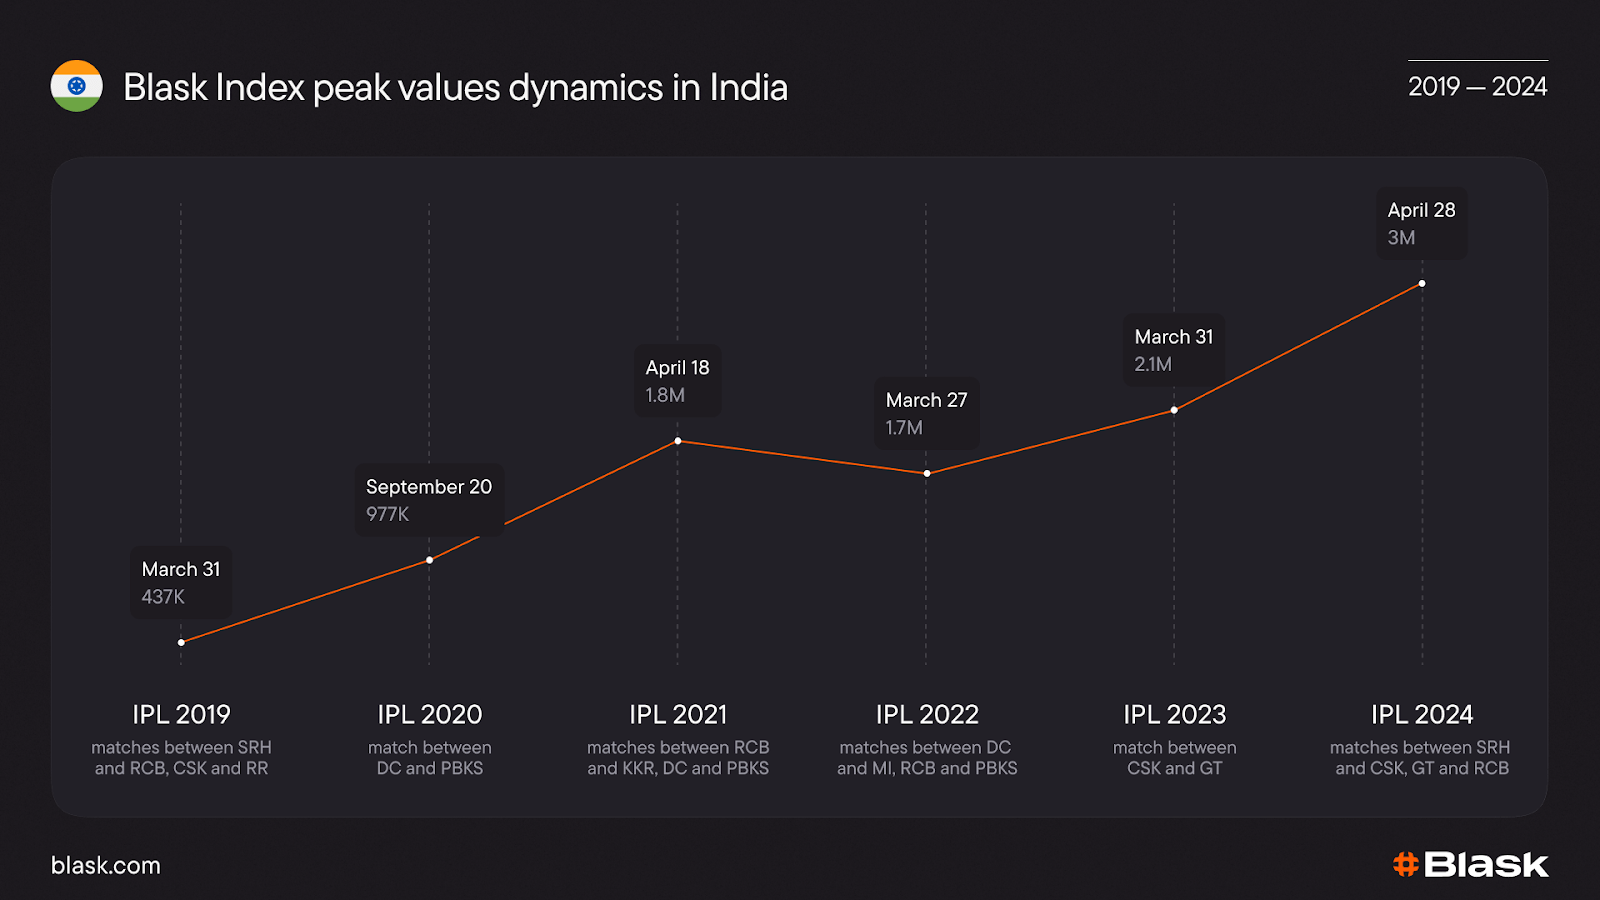
Operators can schedule promotions to overlap midseason matches — typically driving the biggest engagement — not just opening days.
2. Spot competitor pushes in real time
When Stake launched INR deposits ahead of IPL 2024, its Index surged from ~1 million in February to over 10 million by April, solidifying market leadership.
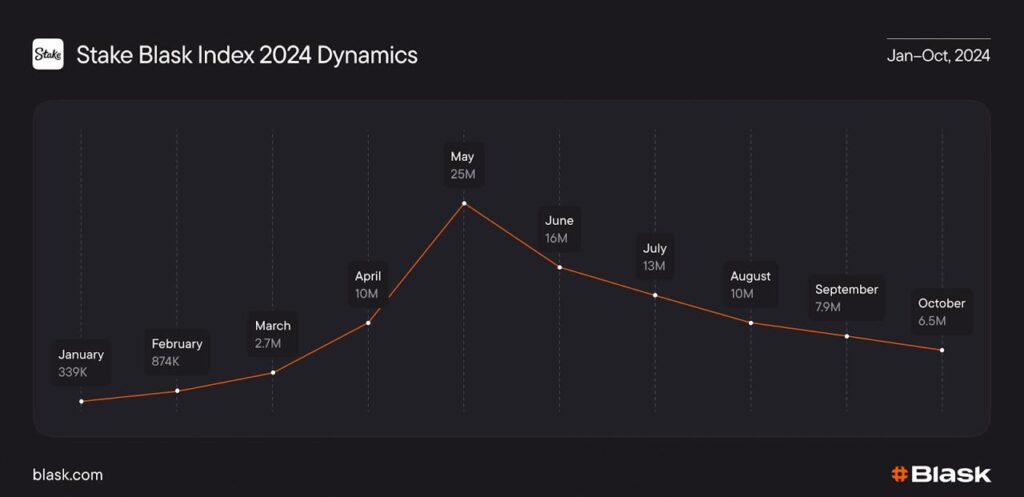
With hourly Blask Index per brand, you can now detect such momentum boosts as they unfold and respond immediately.
3. Choose peak engagement hours
Different markets show distinct daily rhythms.
Hourly data lets you identify exact hours of highest player interest — critical for timing live events, push notifications, or acquisition campaigns.
4. Uncover growing markets
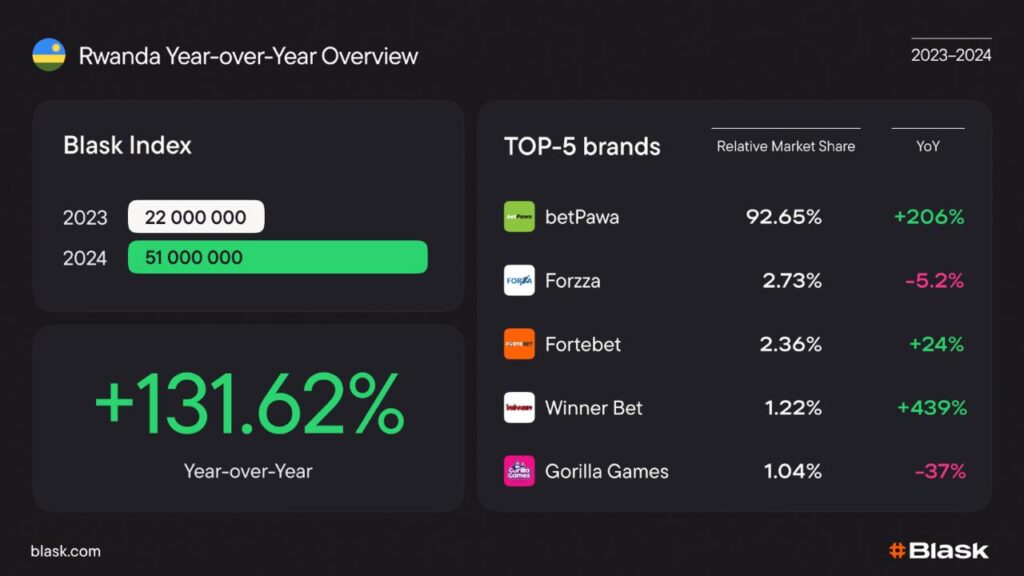
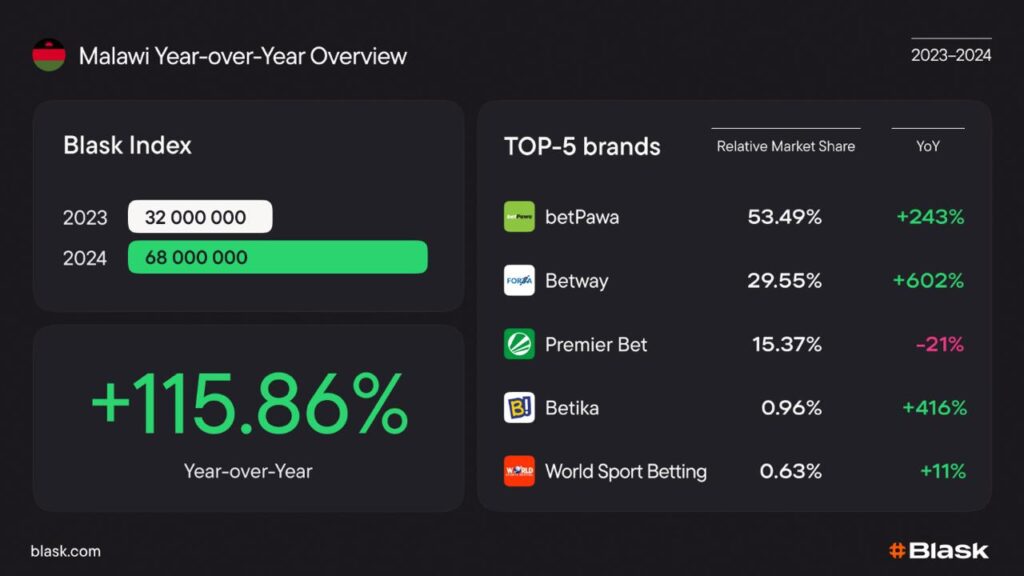
Country-level Blask Index trends show where markets are expanding. For instance, rising Blask Index signals new geographic opportunities worth investing in.
From Blask Index to Brand Benchmarks
Blask Index lays the foundation; the next tier of metrics builds upon it to map brand strength and growth potential:
- Brand’s Accumulated Power (BAP) is derived directly from Blask Index. It converts search-based brand share into a single percentage—measuring real-time audience reach and engagement.
- Acquisition Power Score (APS) uses BAP plus historical trends to estimate a brand’s ability to attract new customers. Think of it as your benchmark for effective market entry.
- Competitive Earning Baseline (CEB) combines BAP, APS, and market context to suggest realistic revenue potential in each country — allowing brands to set goals rooted in actual market dynamics.
Together, these metrics turn raw interest data into strategic standards.
🔍 Deep dive: Ushering in APS & CEB for a new era of brand performance
Blask Index says how big the market is and where interest flows; BAP shows who owns that attention; APS reveals how effectively they convert it; and CEB predicts how much revenue that attention could generate.
Conclusion
In today’s fast-moving iGaming landscape, real-time, hourly insights like those provided by Blask Index are no longer optional — they’re essential. With minute-by-minute tracking and layered brand benchmarks, Blask enables you to:
- Spot emerging trends before the noise settles
- Benchmark performance with powerful brand-grade metrics
- Make strategic decisions backed by timely, actionable data
Whether you’re refining acquisition timing, dialing in creative campaigns, or optimizing coverage in expanding markets, Blask gives you the precision edge.