SiGMA’s latest analysis cuts through that complexity with a single headline figure: African regulated iGaming operators now account for 85% of Africa’s total iGaming revenue. Blask provided the market intelligence data behind that finding.
The number is significant not because it is large, but because of what it measures. Revenue concentration in licensed operators is not a product of legislation alone. It reflects whether players search for, find, and consistently use regulated brands — a behavioral signal that Blask tracks in real time across 100+ markets.
The data behind the headline
Across Africa’s regulated markets, Blask’s channelisation benchmarks show the same pattern that the SiGMA analysis captures at the continental level: when enforcement works, licensed operators command the majority of player attention and revenue potential — not as a matter of policy, but as a measurable market outcome.
Nigeria offers the clearest illustration.
Africa’s largest market by Competitive Earning Baseline — $658.9M, up 61.1% year-over-year — has nine of its ten leading brands operating under local licenses. The top ten collectively hold over 99.9% of BAP (Brand Accumulated Power). What player attention remains outside that group is, by Blask’s measure, negligible.
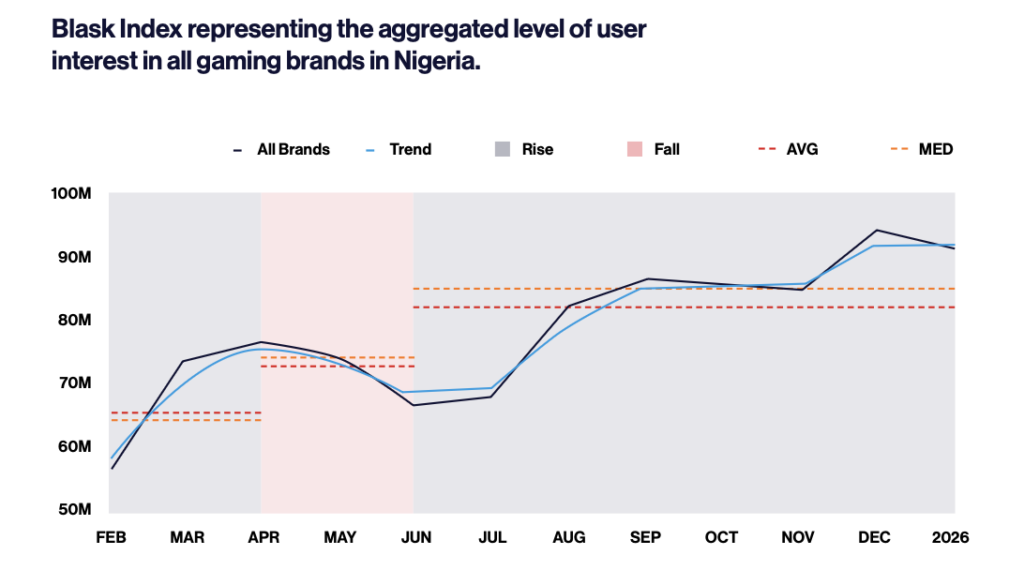
That concentration has a structural explanation. Nigeria underwent a regulatory reset in late 2024, when a Supreme Court ruling transferred gambling oversight from federal to state authorities. Rather than destabilizing the market, the change accelerated formalization. Brands that held local licenses held their positions. Those that didn’t began to lose ground.
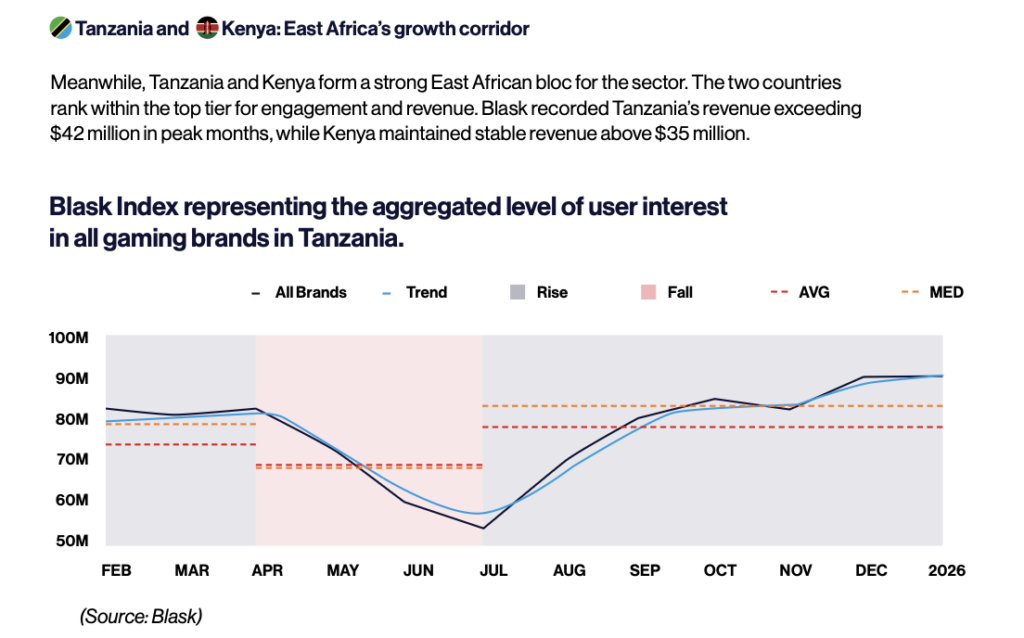
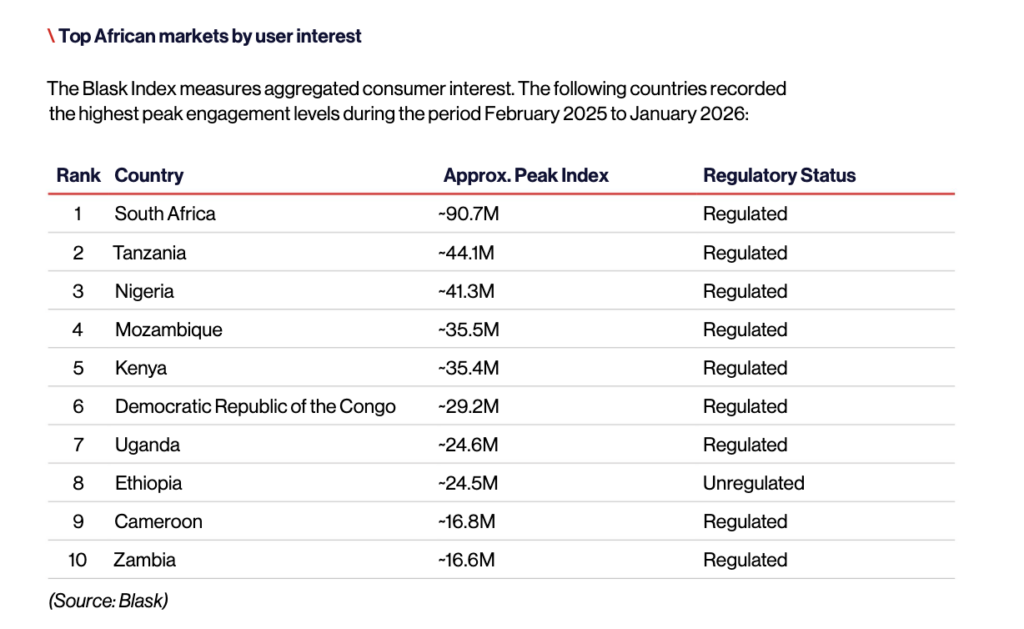
South Africa, Kenya, and Tanzania — Africa’s next-largest markets by Blask Index — show comparable dynamics: local operators dominant, offshore brands marginal, revenue potential concentrated where licensing is real.
Read more: Gambling market overview in Nigeria
Regulation that works — and regulation that doesn’t
The 85% figure is a continental average. The distribution beneath it is not uniform.
Africa’s regulatory landscape divides into three distinct environments. Regulated markets — including South Africa, Nigeria, Tanzania, Kenya, Uganda, Ghana, and more than a dozen others — operate with formal licensing frameworks and active enforcement. Unregulated markets, including parts of North and Central Africa, remain fully open. A third category — mixed markets like Madagascar and Tunisia, where casino and sports betting operate under different rules — adds further complexity.
The gap between these environments is visible in the data. In regulated markets, licensed operators hold dominant BAP shares, acquisition benchmarks are concentrated among compliant brands, and Blask Index growth reflects demand channeled into the legal economy. In unregulated markets, the same volume exists — but it is dispersed, volatile, and carries no channelisation premium.
Regulation, in other words, does not create demand. It shapes where demand goes.
Check the Gambling market overview in South Africa
Africa’s market hierarchy, by Blask benchmarks
Nigeria leads the continent by Competitive Earning Baseline at $658.9M — a figure that reflects not just market size but the depth of player engagement with licensed brands. Tanzania ($450.3M CEB), Kenya ($415.4M CEB), and DR Congo ($344.3M CEB) follow.
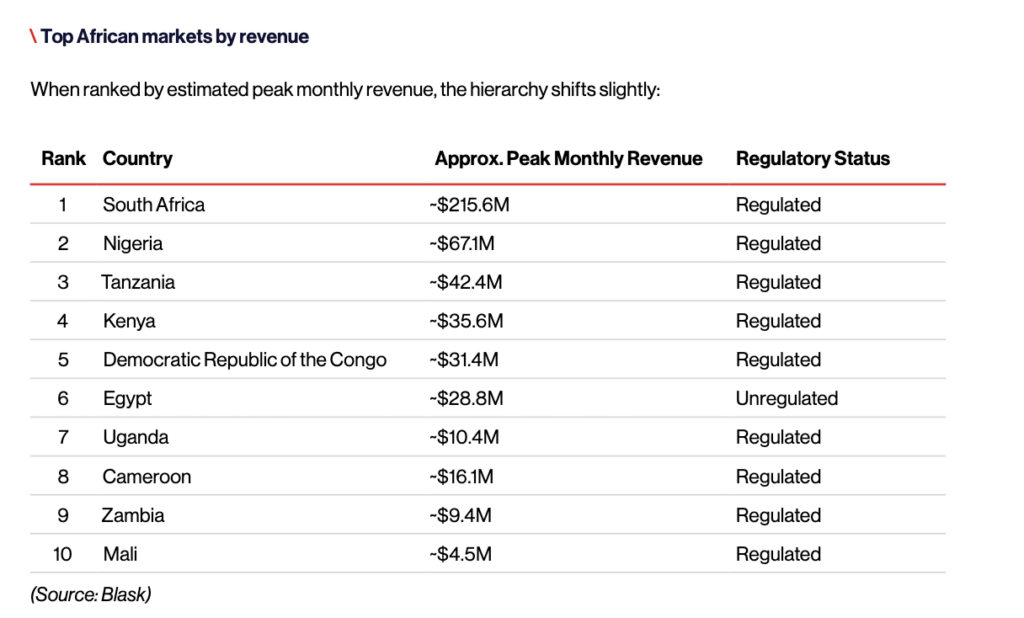
Blask Index figures from early 2025 further illustrate the competitive landscape: South Africa registered the highest absolute demand volume (55M monthly Blask Index hits), followed by Tanzania (39M) and Kenya (29M). Nigeria, at 19M at the time, has since nearly doubled — closing the gap on markets that were historically more developed.
The divergence between South Africa’s Blask Index leadership and Nigeria’s CEB leadership is meaningful. It suggests that Nigeria’s market, while generating the highest revenue potential per brand, remains less saturated in terms of search volume — leaving room for operators who can build brand recognition in a market where the top ten already control virtually everything.
What the Metrics Measure
The Blask data referenced in SiGMA’s analysis draws on three core indicators. Each measures a different dimension of market performance.
CEB — Competitive Earning Baseline
CEB is a market-based revenue benchmark: how much an operator should be earning in a given country, given its brand strength and the competitive context around it. It is not a GGR figure from internal accounting, and it is not a projection from historical averages. It is built on behavioral signals — search interest, brand visibility, competitive anchors — that reflect how much of a market’s revenue potential a brand has the standing to capture.
In practice, CEB answers the question operators ask when entering or sizing a market: what is realistically available, and how much of it are we positioned to take?
BAP — Brand Accumulated Power
BAP measures a brand’s percentage share of total market demand in a given country and period. It is normalized across time, which makes it stable against fluctuations in absolute market size and valid for cross-country comparisons.
In markets where a handful of operators hold near-total BAP — as in Nigeria’s top 10 commanding 99.9% — BAP reveals concentration dynamics that revenue data alone cannot capture. A brand can be generating significant absolute revenue while still losing relative market position. BAP makes that visible before it becomes a strategic problem.
For operators entering Africa
The SiGMA analysis’s 85% figure is, at its core, an argument about where value goes when enforcement functions. It is not an argument that regulation makes markets easy.
Nigeria’s top-ten concentration, South Africa’s competitive density (178 active brands), and Kenya’s 205 tracked operators all point to markets that are regulated and contested at the same time.
Local licenses are necessary but not sufficient. BAP still has to be earned.
What Blask’s data adds to that picture is specificity: not a continental narrative, but a country-by-country read on where demand sits, which brands hold it, and how much of it is available to operators willing to compete for it.
Read the full report: SiGMA Africa Market Report: Regulated markets claim 85% iGaming revenue