- Updated:
- Published:
Competitive Earning Baseline (CEB)
Explore how Competitive Earning Baseline transforms revenue potential measurement — a next-generation metric that evaluates a brand’s realistic revenue expectations through AI-driven analysis of market position, competitive dynamics, and consumer behavior.
The Competitive Earning Baseline (CEB) is a groundbreaking metric designed to provide a realistic projection of the revenue a brand can capture in a given market.
Unlike traditional revenue metrics tied to historical financial data, CEB adopts a future-focused perspective, leveraging AI and external signals to establish a baseline for expected earnings. It combines factors such as Brand Accumulated Power (BAP), Acquisition Power Score (APS), and competitor benchmarks to deliver a transparent and actionable measure of revenue potential.
CEB is measured in USD and is updated monthly.
The Competitive Earning Baseline (CEB) replaces the outdated Estimated Gross Gaming Revenue (eGGR) metric. Unlike eGGR, which focused on backward-looking revenue estimates tied to iGaming-specific contexts, CEB provides a forward-focused, industry-agnostic benchmark for revenue potential. This shift ensures greater clarity, broader applicability, and actionable insights across diverse markets.
How does the Competitive Earning Baseline chart work in Blask?
The CEB chart visualizes each brand’s revenue potential within their market context. Updated monthly, it provides clear insights into expected revenue performance based on brand strength and market conditions.
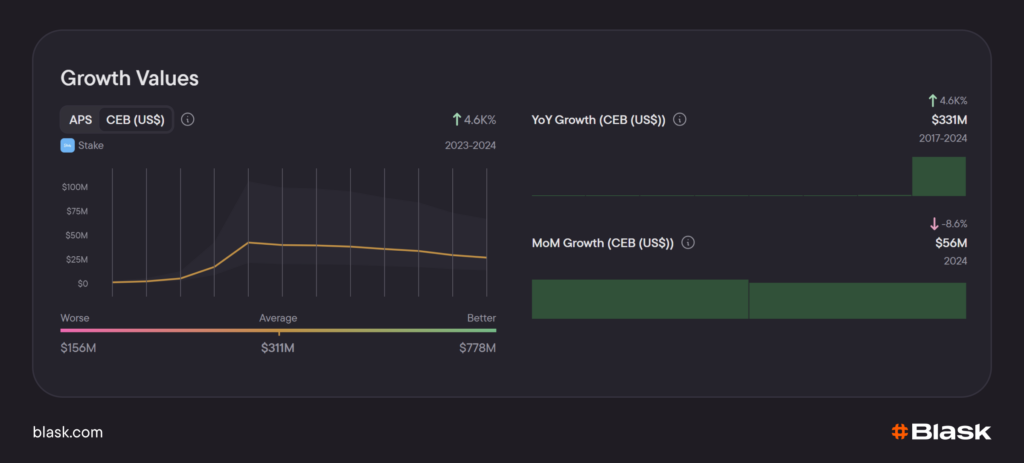
The CEB chart for the Indian brand Stake.
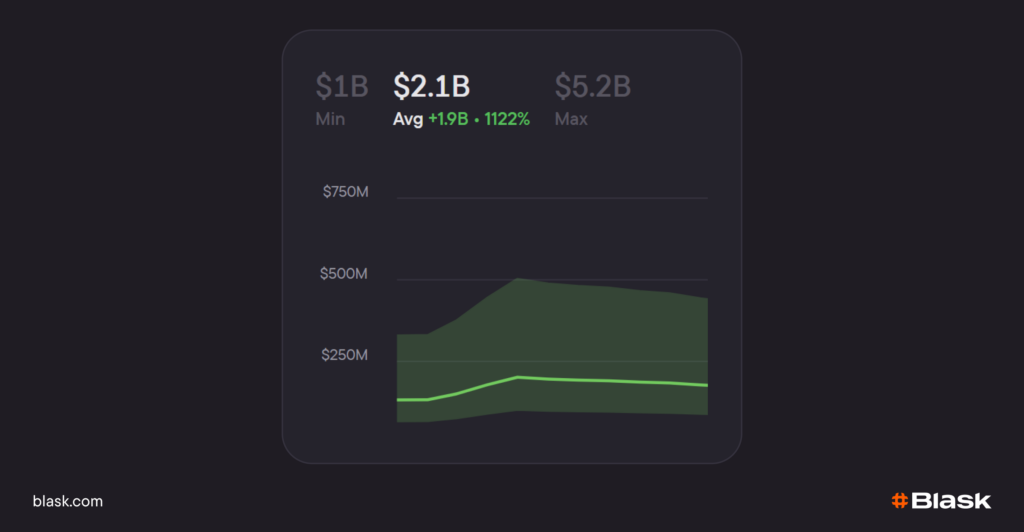
CEB utilizes a sophisticated three-tier projection system:
- Minimum expected revenue baseline.
- Most probable revenue performance.
- Maximum revenue potential.
This range-based approach offers several advantages over single-point revenue estimates:
- ✅ Within expected range: Your brand performs according to market expectations.
- 📊 Near minimum baseline: Performance is acceptable but shows room for improvement.
- ⚠️ Below minimum baseline: Significant optimization needed in revenue generation strategies.
- 📈 Near maximum potential: Outstanding performance at market peak.
- 🌟 Exceeding maximum potential: Exceptional results that redefine market standards.
This range-based approach ensures that CEB is not interpreted as an exact financial projection but rather as a performance benchmark grounded in external market signals.
For instance, consider Brand A, with a CEB of 27k on Blask, and Brand B, with a CEB of 30k. Brand B is performing better.
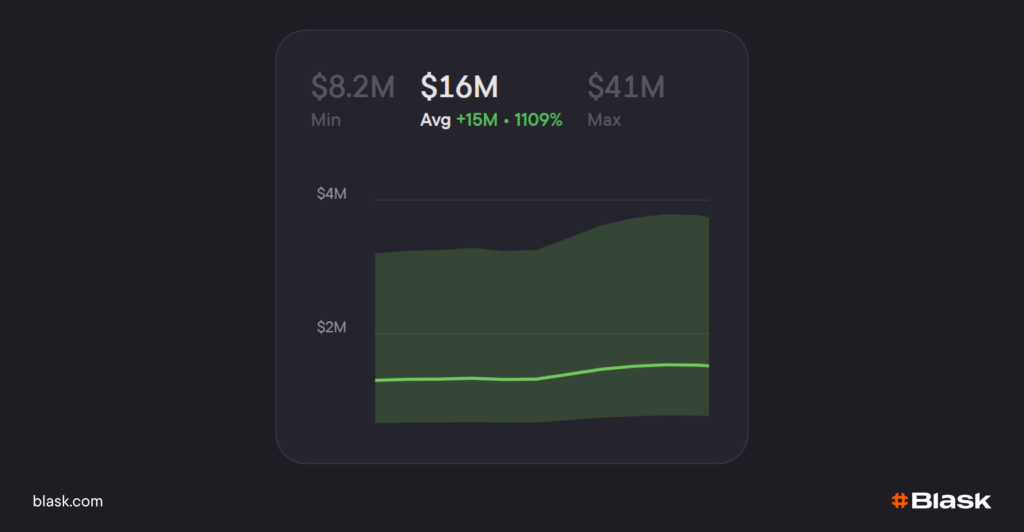
How does the Competitive Earning Baseline work for an entire country?
CEB can be analyzed at both brand and market levels, providing valuable insights into overall market potential and revenue opportunities.
For country-level analysis, Blask aggregates individual brand data to create a comprehensive market view.
CEB for a country = sum of the CEB for all brands operating in that market.
It is also represented as a range.
The country-level CEB helps stakeholders:
- 🌍 Assess market potential: High CEB indicates strong revenue opportunities.
- 📈 Track market evolution: Monitor how revenue potential changes over time.
- 🏆 Compare markets: Evaluate different regions for expansion opportunities.
- 💡 Identify trends: Spot seasonal patterns and market shifts.
For example, if a country-level CEB shows consistent growth month-over-month, this signals increasing market opportunities. Conversely, stagnation or decline may indicate saturation or external challenges affecting all participants.
Compare CEB for specific brands.
Blask allows you to refine your CEB analysis by focusing on specific brands within a market. On the country page, you can select individual brands from the data table to filter the overall CEB calculation.
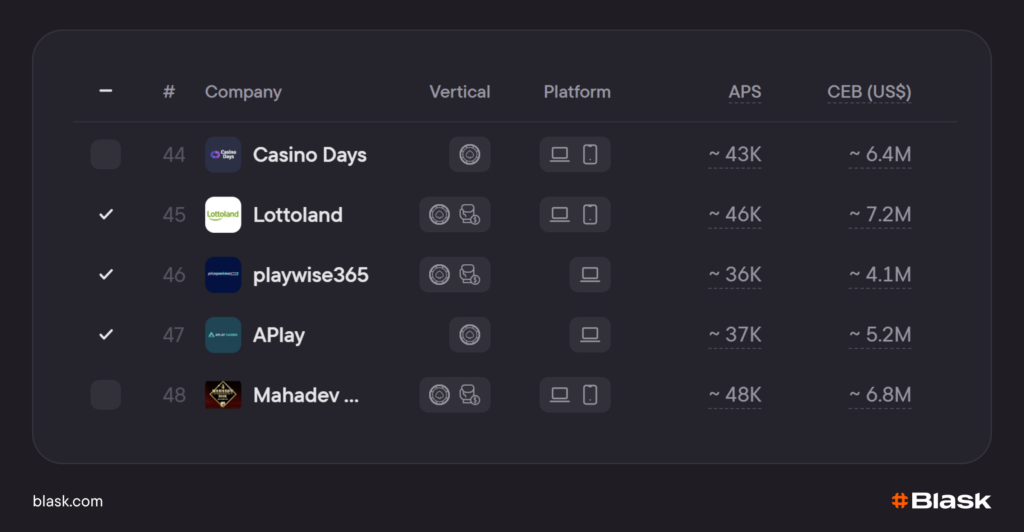
Once selected, Blask recalculates the aggregated CEB exclusively for those brands, helping you track their performance dynamics without the noise of the broader market. This targeted approach is ideal for identifying competitive gaps and refining strategies in niche segments.
Pro tip on niche analysis: Focus on brands within a specific vertical, such as casino gaming or sports betting, to identify opportunities for differentiation.
How is the Competitive Earning Baseline calculated?
Blask’s AI model generates CEB by analyzing a blend of:
- 🔍 Brand visibility and search trends — How frequently consumers engage with the brand online.
- 💡 Market influence — The relative strength of the brand compared to competitors in the same vertical.
- 📈 Acquisition effectiveness — Derived from APS, which measures the potential for attracting new customers.
- 📊 Competitor benchmarks — Revenue potential adjusted for market conditions and competitive intensity.
These data points are integrated into Blask’s proprietary Brand Accumulated Power (BAP) framework, which serves as the backbone for calculating CEB. By continuously analyzing these factors, the model delivers monthly CEB updates that reflect evolving market conditions and brand performance.
The CEB metric achieves remarkable accuracy through:
- ✅ Continuous AI model training.
- ✅ Regular validation against market data.
- ✅ Cross-reference with regulatory reports.
- ✅ Industry expert verification.
How can brands use CEB effectively?
The Competitive Earning Baseline helps brands navigate complex markets by providing clear benchmarks for revenue optimization and growth.
Validate revenue strategies.
Compare actual earnings against the CEB range to identify whether your brand is fully capitalizing on its market influence. Falling below the baseline? Consider optimizing your product offering or marketing strategy. Surpassing it? Double down on what works.
Set realistic goals.
Use CEB as a guide for setting achievable monthly or quarterly revenue targets aligned with your brand’s current position and market conditions.
Monitor competitive positioning.
Track how your brand’s CEB compares to competitors over time to understand shifts in market influence or emerging threats.
Expand into new markets.
Evaluate country-level CEB to identify regions with high revenue potential before committing significant resources to expansion efforts.
How can brands improve their competitive earning baseline?
Boosting your CEB requires a strategic focus on enhancing both market presence and operational efficiency. By addressing key areas of visibility, engagement, and product alignment, brands can elevate their revenue potential and competitive standing:
- 🌟 Strengthen market visibility: Build a strong digital footprint by investing in brand awareness campaigns, optimizing for search engines, and leveraging affiliate networks. A well-recognized brand attracts more consumer interest and drives higher revenue potential.
- 🎯 Target high-value audiences: Use data-driven insights to identify customer segments with the highest lifetime value. Tailor marketing campaigns to resonate with these groups and maximize the return on your acquisition efforts.
- 🔄 Adapt to market dynamics: Monitor CEB trends regularly to identify shifts in consumer behavior or competitor strategies. Being agile in adjusting your marketing and product offerings ensures that you stay ahead of market changes.
- 🔧 Refine the customer experience: Optimize onboarding processes, user interfaces, and support systems to reduce friction in the customer journey. A seamless experience translates to higher conversions and improved retention rates.
- 📈 Invest in long-term engagement: Don’t just focus on acquiring new customers—engage your existing audience through loyalty programs, personalized offers, and consistent communication. A well-engaged customer base contributes significantly to sustained revenue growth.
By adopting these practices, brands can not only improve their current CEB performance but also lay the groundwork for long-term competitiveness and profitability.
Why Blask transitioned from eGGR to CEB?
The introduction of Competitive Earning Baseline marks a significant evolution in how Blask measures market performance. While Estimated Gross Gaming Revenue (eGGR) was effective in providing iGaming brands with an estimate of their gross revenue based on first-time deposits and player activity, it had limitations:
- 📉 Misinterpretation risks: Many operators misunderstood eGGR as an exact financial figure rather than a model-based projection, leading to confusion when numbers didn’t align with internal data.
- 🎰 iGaming-specific focus: The terminology limited its relevance beyond traditional gambling verticals, restricting its adoption in adjacent industries like fintech or entertainment.
- 🔄 Backward-looking nature: eGGR focused on historical performance rather than projecting future opportunities, which limited its alignment with forward-focused business strategies.
With CEB, Blask has introduced a metric that transcends these limitations by offering an industry-agnostic, future-oriented benchmark for revenue potential. By shifting the focus from what has already occurred (deposits and payouts) to what could be achieved (market-driven earnings), CEB empowers brands across all verticals to align their strategies with actionable insights grounded in real opportunities.
This evolution reflects Blask’s commitment to continuous innovation and adaptability in today’s dynamic markets—helping brands unlock their full potential through data-driven decision-making. 🌟
Unlock your iGaming potential with Blask!
Blask empowers you to make data-driven decisions, optimize marketing strategies, and drive significant GGR increases by providing unparalleled clarity about the iGaming market and your performance.
Curious about our precision? Discover our article “What is Blask?” and how Blask’s cutting-edge technology is transforming iGaming analytics.
Ready to experience Blask in action?
Request a personalized demo with full access to data tailored to your niche and objectives. Fill out the form at blask.com to help us prepare use cases specific to your needs.
Need assistance?
Our support team is always here to help. Click the chat icon in the bottom right corner of your screen to connect with us instantly and get the answers you need.