Peru doesn’t usually dominate LatAm headlines. Brazil does. Mexico does. Sometimes even Colombia does.
Yet when it comes to how to regulate online gambling without suffocating growth, Peru has quietly become the region’s most instructive case study — and that’s exactly why NEXT.io chose it for the latest edition of NEXT iGaming Market in Focus.
Blask supported the report with market-intelligence data and benchmarks that help answer the questions official statistics still can’t: who is really winning player attention, where revenue potential sits, and how sharply the market is channelising into regulated operators.
📊 Check also: Gambling market overview in Peru
A regulated success story with real scale behind it
Industry experts cited in the report estimate Peru’s total gambling turnover at $1.5bn–$2.5bn and GGR at roughly $350m, with around three million people believed to gamble online monthly. The foundation is structural: Peru moved from grey to white through Law No. 31557, fully implemented in February 2024, under the oversight of MINCETUR and its dedicated gaming directorate.
And in October 2025, the compliance architecture tightened further with formal AML/CTF requirements (including clearer reporting and KYC obligations) — turning “regulated” into “enforceable.”
Where Blask data comes in: validating channelisation, not just narrative
NEXT.io uses Blask benchmarks to map competitive strength in markets where official numbers are incomplete, delayed, or inconsistently reported. And Peru is a perfect example.
1) Local vs offshore: dominance that isn’t subtle
Blask’s 2025 benchmarks show a regulated market where offshore brands struggle to materially shift outcomes:
- ~99% of expected acquisitions are captured by local operators, vs ~1% by international brands.
- On revenue potential (CEB), local brands represent ~98–99% of total expected market earnings, with offshore players remaining marginal.
2) Growth has seasonality — and operators can plan around it
Peru’s acquisition potential (APS) rises from ~610k in January to ~955k by October, with maximum potential reaching ~1.67M. Revenue potential (CEB) tracks the same pattern, rising from an average of $53.8m (Jan) to $76.2m (Oct).
The strongest months — September and October — underline how seasonal pushes and marketing intensity translate into measurable upside.
What is APS and CEB
CEB (Competitive Earning Baseline)
CEB is an external, market-based revenue benchmark (for a brand or a country’s brand total) in USD: how much an operator should be earning in a given country, given brand strength and competitive context. It is not your accounting ledger and not a guess at GGR; it’s an objective reference built on behavioral market signals (search interest, brand visibility), competitive anchors, and a model that captures brand equity and a brand’s ability to attract new customers.
Brand equity’s link to financial outcomes is well established; external signals improve demand forecasts — that’s why we use them as the base for potential revenue.
APS (Acquisition Power Score)
APS is an external, market-based benchmark for new-customer acquisition (for a brand or a country’s brand total): how many new users an operator should be bringing in at current brand strength and competitive intensity. It is not your FTD/registration tally and not a re-hash of yesterday’s conversions; it’s an objective reference built on external behavioral signals — search interest and brand visibility, social engagement, behavioral indicators and competitive anchors..
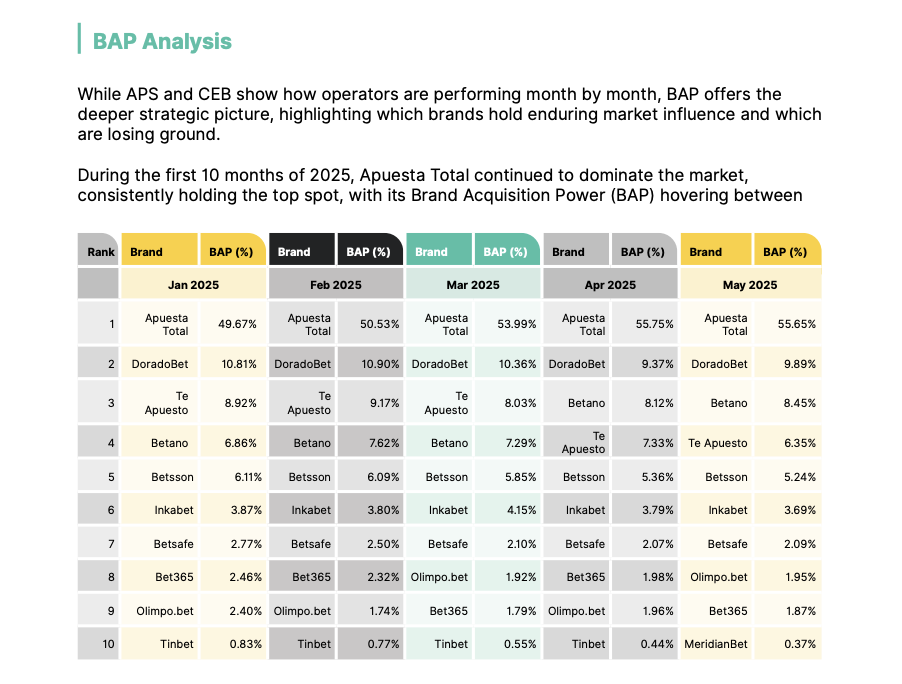
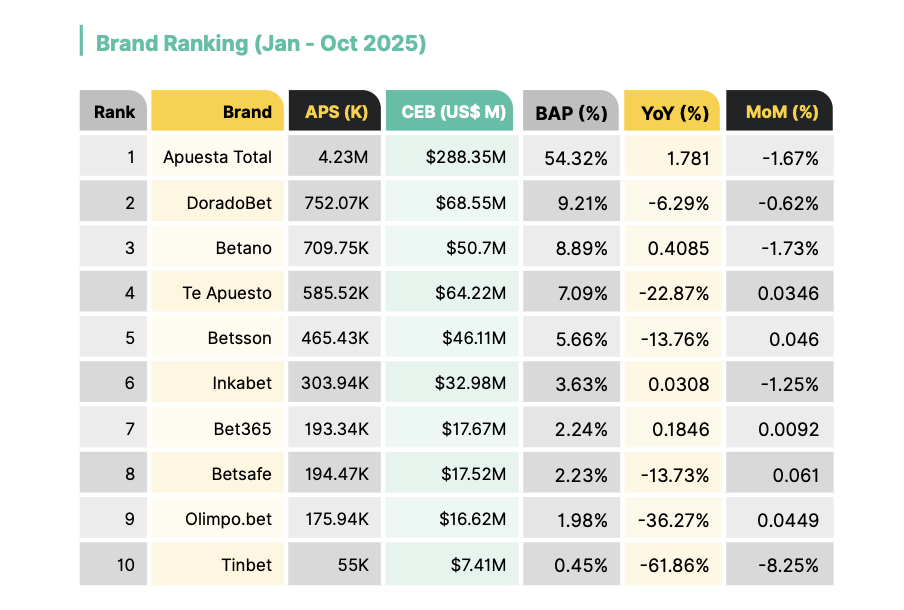
3) Brand power explains the market’s “shape”
Beyond month-to-month movement, Blask’s BAP analysis shows a market that’s highly concentrated at the top, with Apuesta Total holding a dominant share of long-term brand power and a tight second tier competing for incremental influence.
What is BAP
BAP is a percentage measure of brand strength over time — a brand’s “accumulated power” as a share of category power in a given market.
Built on cleaned external behavioral signals (Blask Index, social engagement, mentions/reviews, affiliate activity), BAP is aggregated and normalized, so it’s stable against swings in absolute market size and fits cross-country, cross-period comparisons.
BAP is not sales and not SEO traffic — it’s a relative indicator of market power, revealing whose share of attention is rising or waning, and where the potential lies for acquisition (APS) and revenue (CEB).
💡 Read also: LATAM iGaming 2025: Where growth stopped being a promise
What’s inside the report
- Market Validation
A grounded view of a market generating ~$350m GGR, attracting major international names alongside strong local leaders. - Regulatory Landscape
How MINCETUR built a transparent framework — and what the latest AML/KYC requirements mean operationally. - Player Insights
A digitally engaged audience where football and esports matter — and where local culture still shapes betting behaviour in ways outsiders often miss. - M&A Outlook
Why Peru is entering a “Darwinian phase of dealmaking” — a consolidation cycle where compliance, scale, and acquisition efficiency determine who becomes a target (and who gets left behind).
Read the full report via this link.