Blask introduces Trends, a new view inside the Blask Index that smooths short-term spikes on the graphs to reveal the underlying direction of a market and label its current state as Growth, Stagnation, or Decline. Built for volatile periods, it lets teams read momentum at a glance and act faster.
Why it matters
Major events, launches, and promo spikes can distort raw curves. Trends provides a stable signal so teams can spend time, prioritize markets, and adjust product or compliance with confidence.
How it works
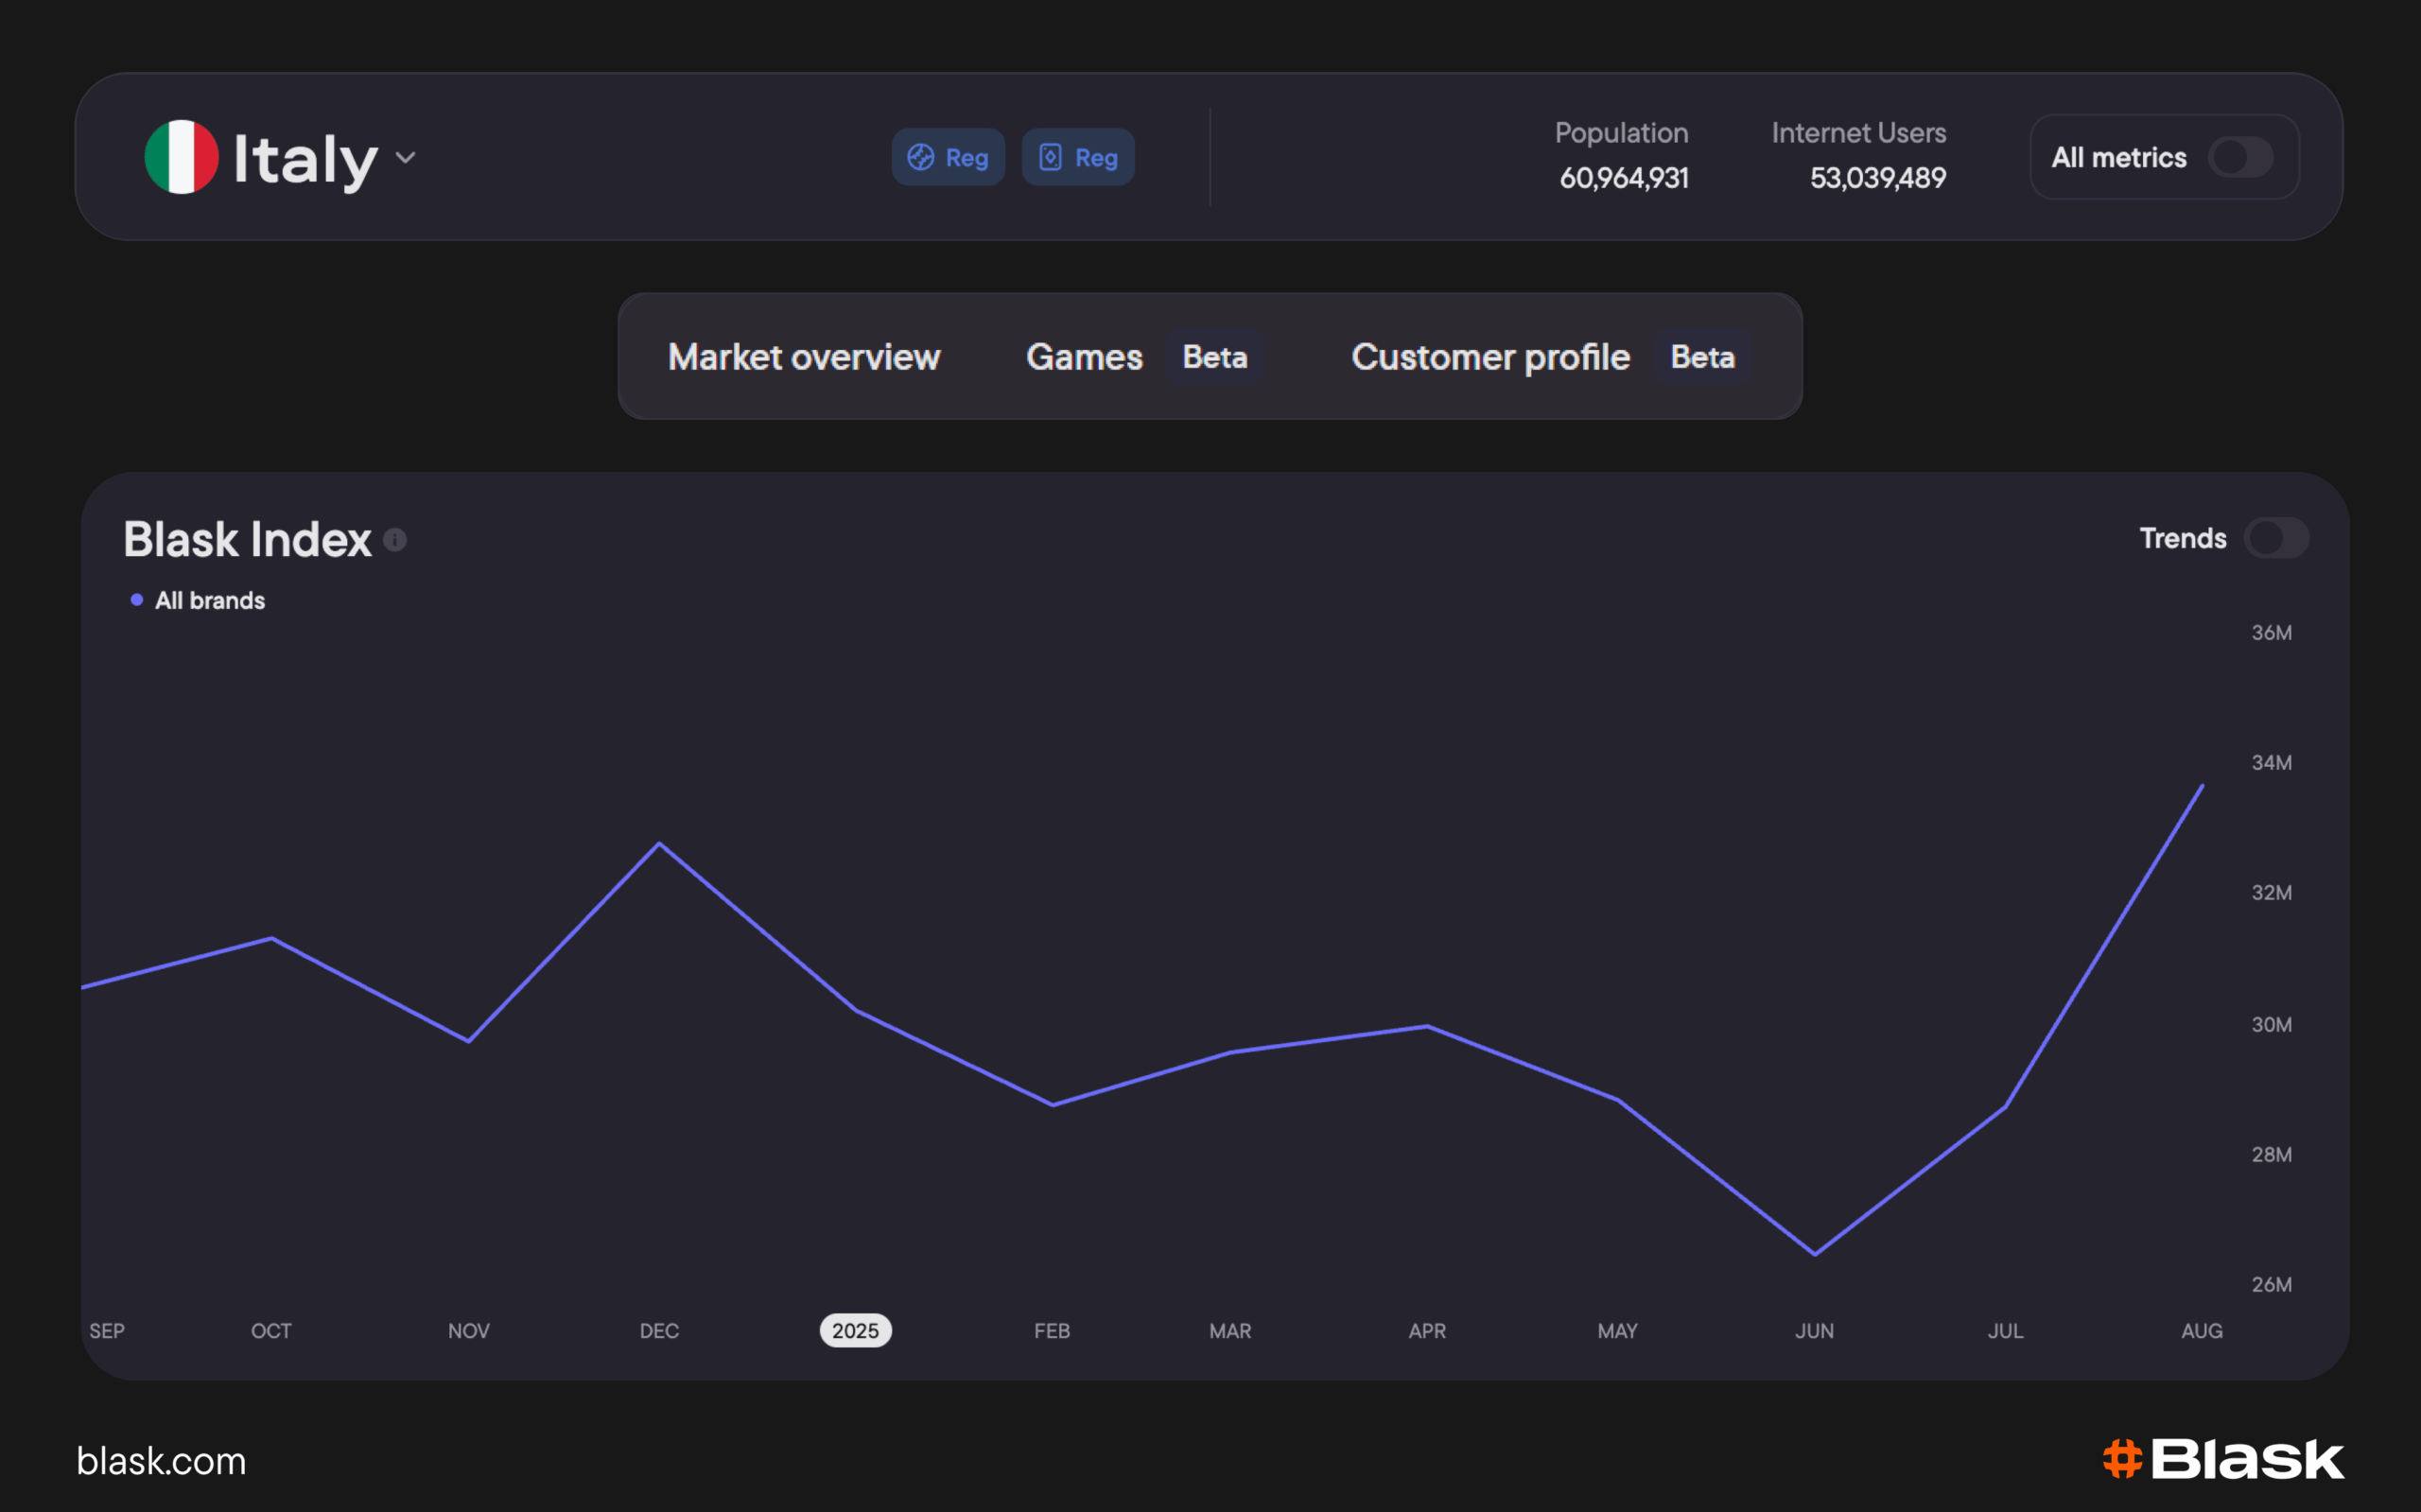
Blask Trends takes the standard Blask Index time series for a selected market and timeframe and smooths short-term volatility. The widget overlays a trend line and a state badge that update on the platform’s hourly refresh cadence.
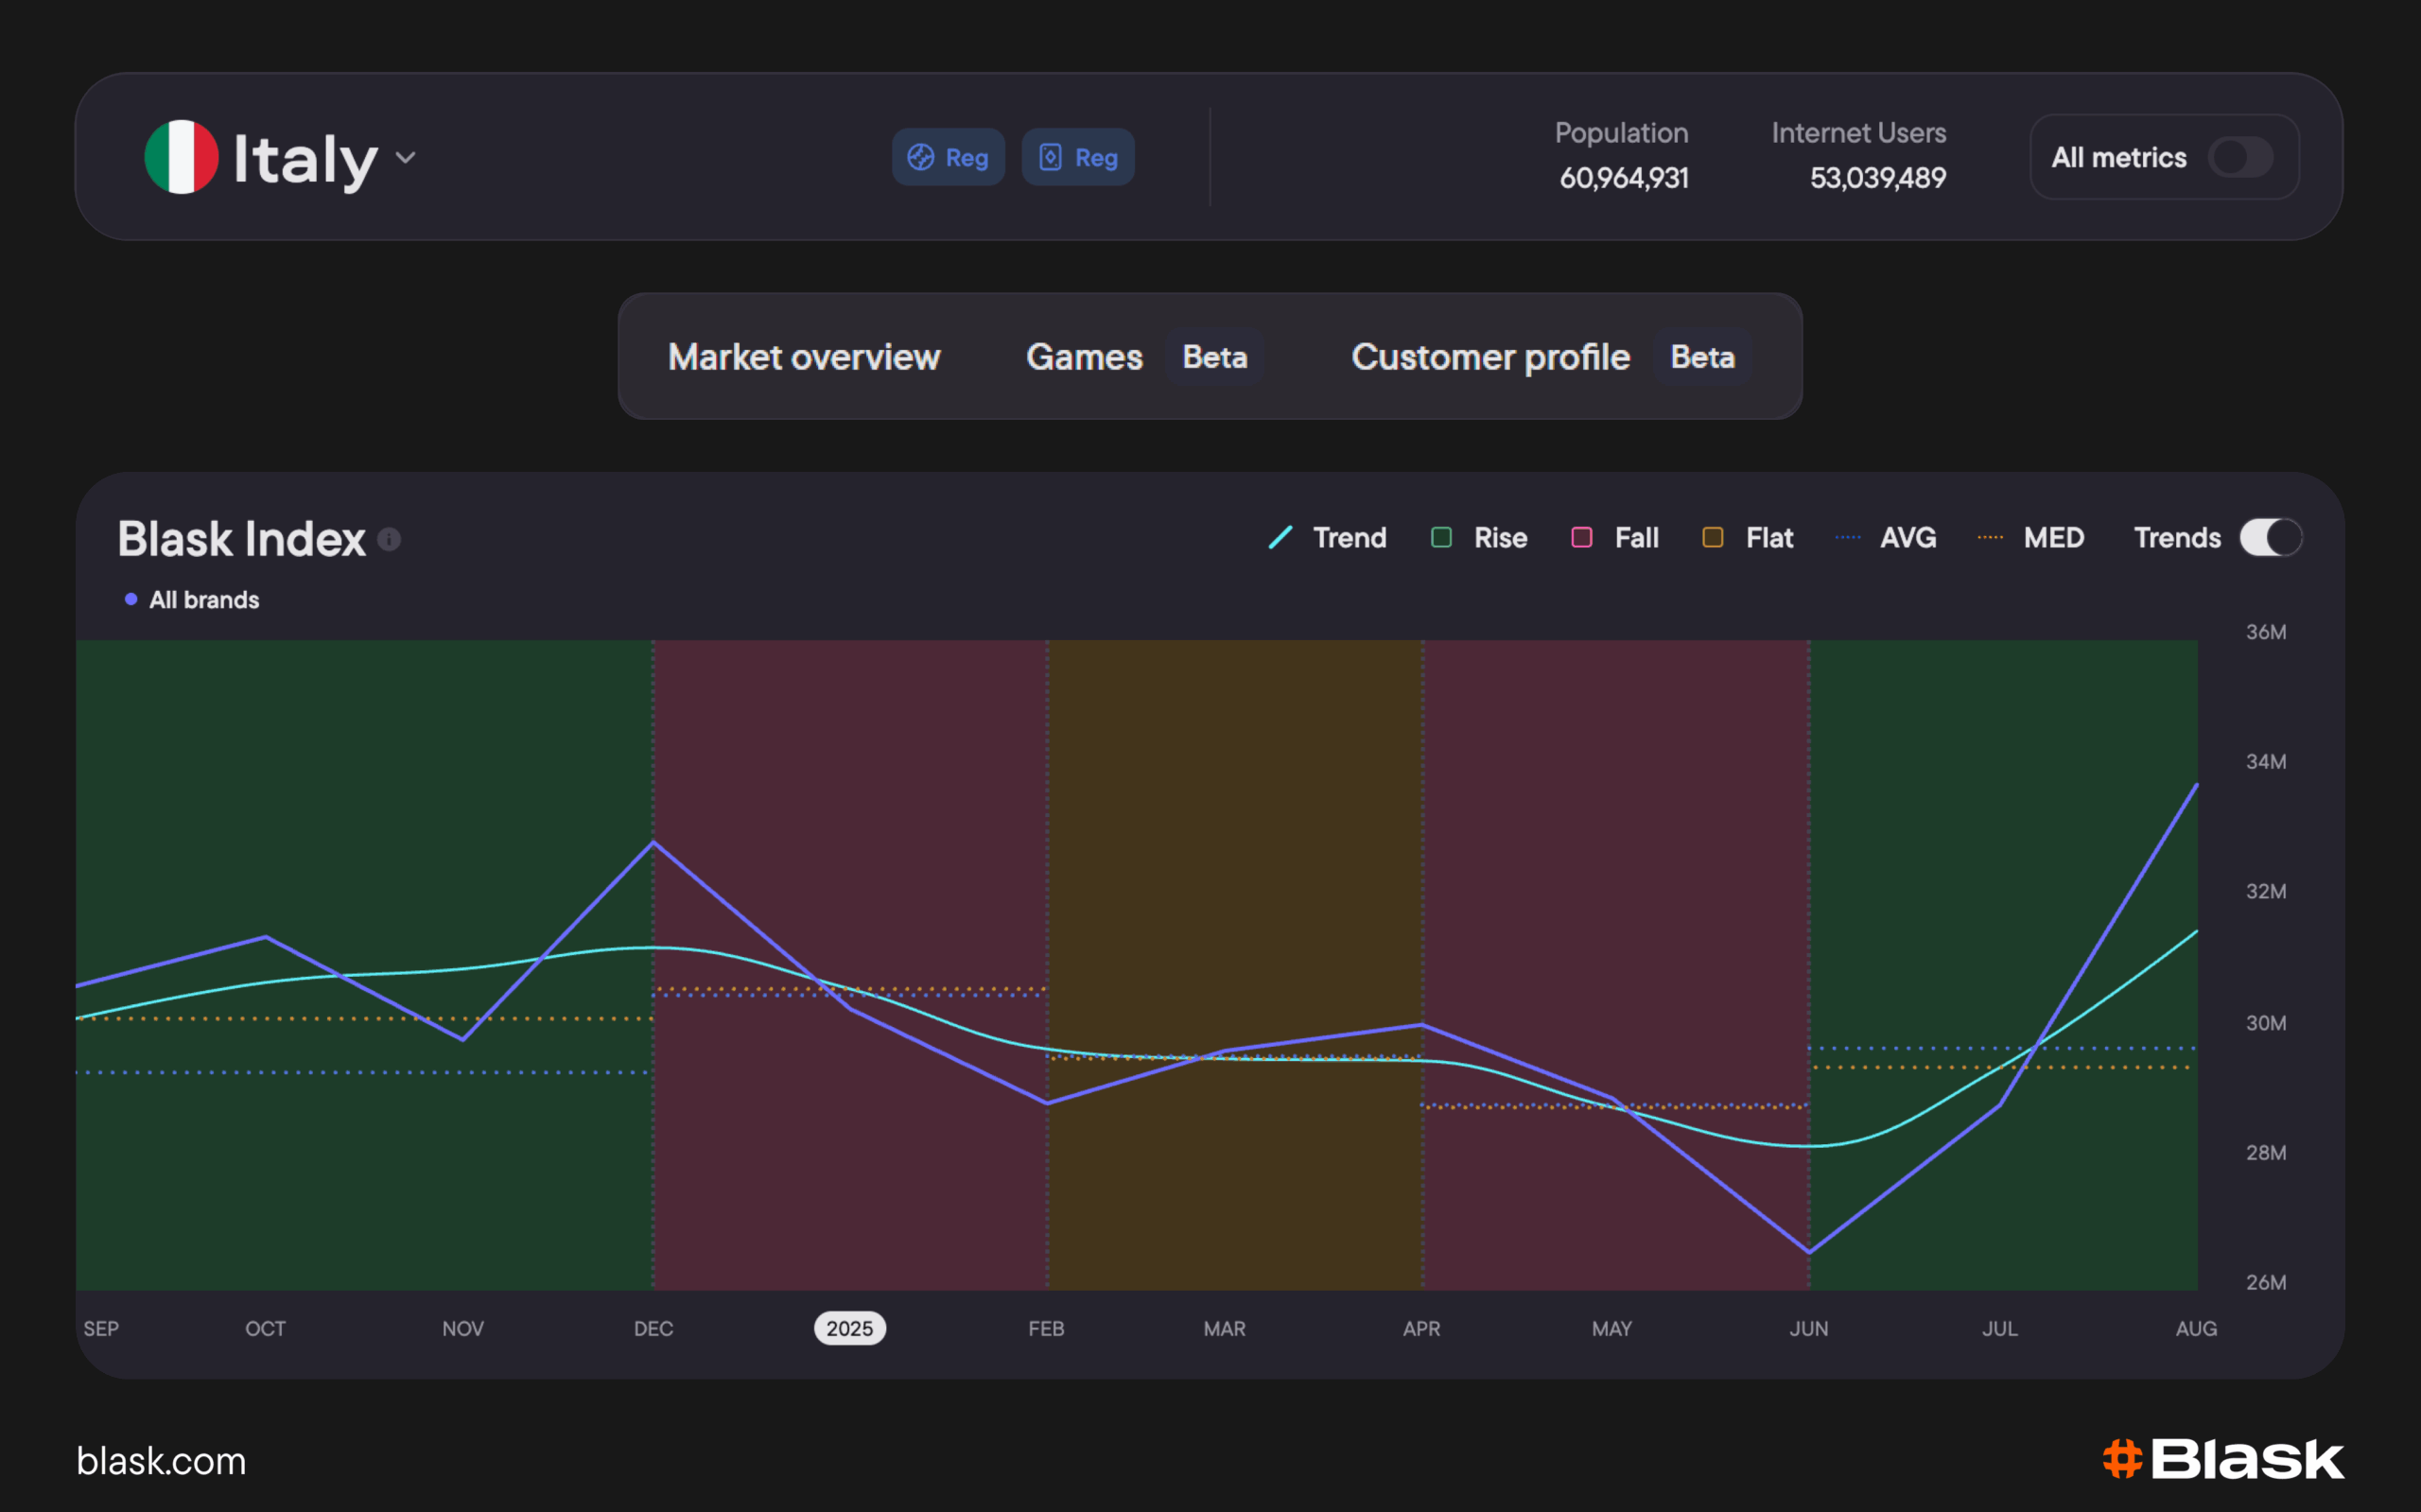
It is as simple as that, and it makes the data much more easy to understand and, what’s more important, to analyze.
Trends is available inside the Blask Index widget across 85 markets. Users can toggle the overlay on/off and set Trends as the default.
Get started
Open any market’s Blask Index, switch on Trends and start analyzing the growths and declines of the data with a cleaner view. It really is that easy!