Most iGaming KPIs tell you what happened last quarter. This guide covers the metrics that show where your brand stands right now — and where it’s going.
Casino operators track revenue. They track deposits, new registrations, first-time depositors, average bet size, and player lifetime value. All of these are useful numbers. None of them tells you how your brand is performing relative to the market.
That’s a different question — and one the industry is surprisingly bad at answering.
When a brand’s GGR drops 10%, is it a market problem or a brand problem? When a competitor launches in your key territory, how do you know if players are noticing? When you’ve run six months of brand campaigns, how do you measure whether brand strength actually moved?
Internal data alone won’t answer these questions. You need external signals — the kind that show up before revenue does.
Why GGR doesn’t tell you where your brand stands
Gross Gaming Revenue is a lagging indicator. By the time it moves, the underlying cause is months old. A brand can post flat GGR while steadily losing player attention to competitors. A brand can grow GGR while its share of market demand collapses — riding momentum from campaigns that stopped working two quarters ago.
The other problem: GGR is private. You can see your own number. You can’t see William Hill’s, Ladbrokes’, or the challenger brand that just entered your market. Without external data, you’re measuring yourself in a vacuum.
Most iGaming KPI frameworks focus entirely on internal performance: conversion rate, ARPU, churn, bonus utilization. These are operational metrics. They optimize the funnel. They don’t measure brand.
What search demand reveals that financial reports don’t
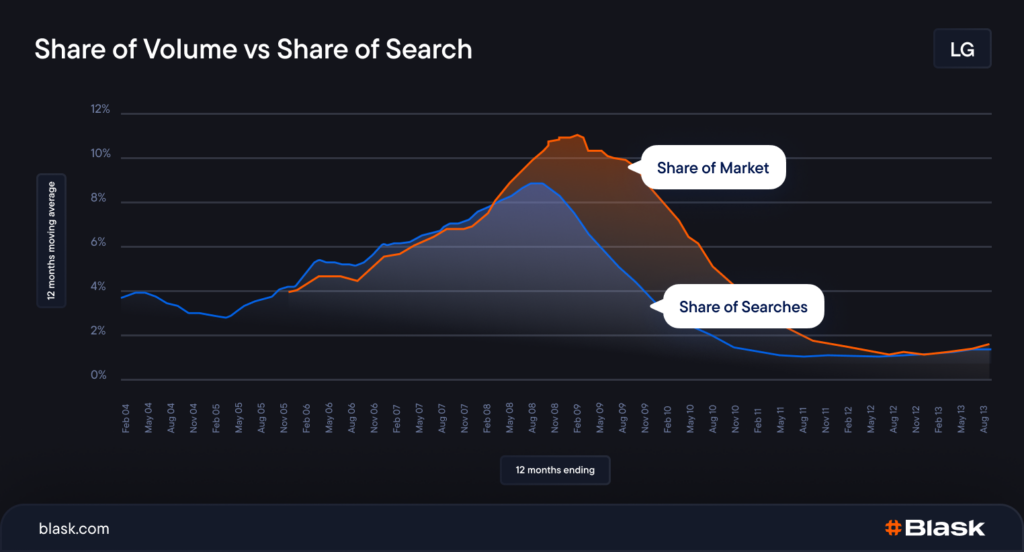
Share of search is the percentage of all brand-related searches in a category that your brand captures. Econometrician Les Binet demonstrated that share of search reliably predicts future market share — in some categories, with a 6-to-12-month lead time. When search demand for your brand grows faster than the market, revenue tends to follow. When it drops, revenue eventually follows that too.
In iGaming, this matters more than in most industries.
Players research before they deposit. They search brand names, compare offers, look up reviews. This search activity leaves a clear signal about which brands are winning attention — before a single bet is placed.
The challenge is that raw Google Trends data is normalized and approximate. Building a proper share of search model for 335+ brands across dozens of markets requires significant infrastructure. That’s the core problem Blask solves.
The four metrics that actually measure casino brand performance
Measuring casino brand performance externally requires four distinct data dimensions. Each answers a different question.
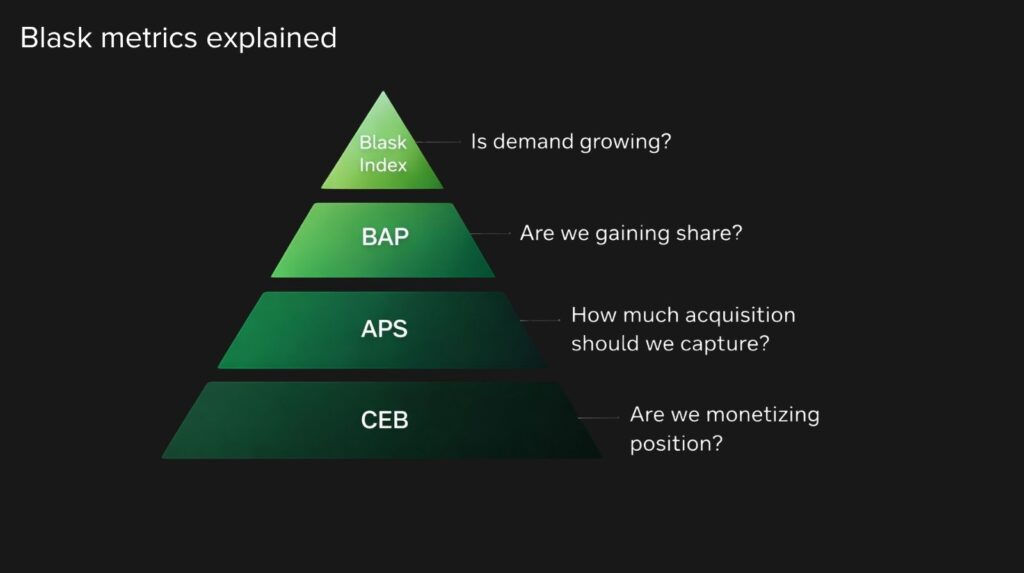
Blask Index
Blask Index is an AI-enhanced demand signal built from search activity across all tracked iGaming brands in a given market. It measures how much genuine user interest a brand generates — searches, brand interactions, account-related activity — aggregated and normalized into a single comparable figure.
Unlike raw search volume, Blask Index is calibrated across markets and over time. A reading of 50M in the UK means something specific relative to other UK brands and relative to UK Blask Index in prior periods. It’s a leading indicator: it captures intent before it converts to deposits.
What it tells you: Is player demand for your brand growing, flat, or eroding?
BAP — Brand Accumulated Power
BAP is your brand’s percentage share of total market demand. It’s calculated from Blask Index data, normalized across all active brands in a country and period.
BAP reveals concentration dynamics that revenue data can’t. A brand can grow its Blask Index in absolute terms while losing BAP — if competitors are growing faster. In a market with 335 active brands, your absolute demand growth may be irrelevant if the market itself is growing at twice the rate.
What it tells you: Are you gaining or losing ground relative to the field?
APS — Acquisition Power Score
Acquisition Power Score (APS) is a benchmark for how many new customers a brand’s current market position should be delivering. It’s expressed as a min–avg–max range to reflect seasonal variability and competitive dynamics.
APS doesn’t come from your CRM. It comes from external signals — brand visibility, search presence, competitive positioning. This makes it useful for two things: reality-checking your actual FTD numbers against market expectations, and benchmarking your acquisition capacity against competitors without needing their internal data.
What it tells you: How much new customer acquisition should your brand be capturing, and how does that compare to competitors?
CEB — Competitive Earning Baseline
Competitive Earning Baseline (CEB) is a market-based revenue benchmark. It estimates how much a brand should be earning in a given country, given its current brand strength and competitive environment. Like APS, it’s a min–avg–max range — the minimum reflects conservative competitive assumptions, the average is the most likely scenario, and the maximum reflects favorable conditions.
CEB isn’t GGR from your accounting system. It’s what the market says you should be earning based on your position. The gap between CEB and actual revenue is where the conversation about brand investment starts.
What it tells you: Is your brand monetizing its market position, or is it leaving revenue on the table?
UK 2025: what the data looks like in practice
The UK is the most data-rich iGaming market to illustrate these metrics. In 2025, 335 active brands competed for player attention with a total market APS of 19.85M new players and a combined CEB of $11.52B.
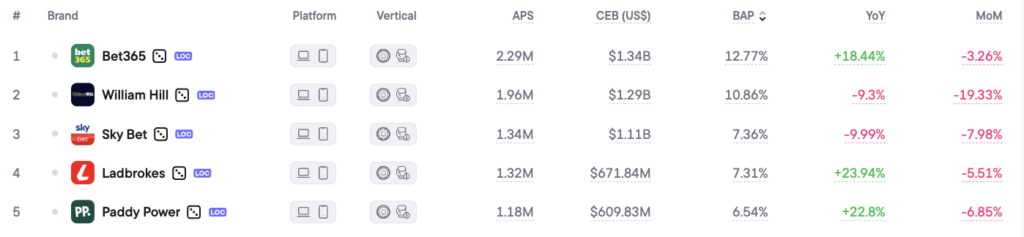
Here’s how the top three brands compare:
| Brand | APS (min–avg–max) | CEB (min–avg–max) | YoY demand change |
|---|---|---|---|
| Bet365 | 1.71M – 2.28M – 3.99M | $979M – $1.31B – $2.29B | +15.18% |
| William Hill | 1.50M – 2.00M – 3.50M | $968M – $1.29B – $2.26B | –12.63% |
| Ladbrokes | 960K – 1.28M – 2.24M | $487M – $649M – $1.14B | +21.88% |
The revenue benchmarks for Bet365 and William Hill are nearly identical: $1.31B vs. $1.29B average CEB. If you only looked at financial estimates, you’d call them roughly equivalent brands.
The demand data tells a different story. Bet365’s brand demand grew 15.18% year-over-year. William Hill’s fell 12.63%. That’s a 28-point divergence in brand trajectory between two operators with essentially the same revenue baseline today.
Ladbrokes is the interesting case. Its CEB is half of the top two — but its demand growth at +21.88% is the strongest of the three. A brand growing at that rate, from a smaller base, is the kind of competitive signal that’s invisible in revenue reports and obvious in search demand data.
This is the core value of measuring brand performance externally: it shows divergence before revenue reflects it.
How to benchmark your brand against competitors
The practical process for measuring casino brand performance across these four dimensions:
- Step 1: Establish your Blask Index baseline. Track your brand’s monthly demand signal over 12+ months. Look for trend direction, not just absolute values. A flat Index in a growing market means you’re losing share.
- Step 2: Calculate your BAP. Your BAP converts absolute demand into relative position. A brand with a 5% BAP in the UK is holding significant share in a 335-brand market. A brand whose BAP drops from 5% to 4.5% over six months is losing ground — even if its Blask Index in absolute terms looks stable.
- Step 3: Benchmark APS against actual FTD. Compare your APS range against your actual first-time depositors. If you’re consistently below the APS floor, your brand is underdelivering on its market position. If you’re consistently above the APS ceiling, something else is driving acquisition — partnerships, affiliate traffic, a specific campaign — and it’s worth understanding why.
- Step 4: Use CEB to size the gap. Your CEB tells you what the market says you should be earning. If actual revenue is below CEB, it’s a signal to investigate: is monetization underperforming? Is the player mix different from the model? Is the brand stronger in searches than in conversions? Each of these points to a different operational fix.
- Step 5: Run competitor comparisons quarterly. Brand performance is relative. Knowing your own Blask Index trend matters less than knowing how it compares to the brands you’re actually competing against in your key markets.
The measurement gap most operators ignore
iGaming is unusual among consumer industries in how little external brand measurement gets done. Most operators benchmark themselves against their own prior periods — last month, last quarter, last year. Very few build systematic views of how their brand is performing relative to the field.
The brands that do this well use it as an early warning system. When BAP starts dropping in a key market before revenue moves, they have time to respond. When a challenger brand’s Blask Index starts growing at an accelerating rate, they can see it in the data — not in a competitor’s press release six months later.
Share of search research in non-gaming industries consistently shows that brands with growing search demand outperform those with declining demand by a significant margin over 12-to-24-month horizons. In iGaming, where the conversion from brand awareness to first deposit is highly search-mediated, the relationship is likely stronger.
The question isn’t whether this data exists. It does. The question is whether you’re looking at it.
Conclusion
GGR, deposits, and FTD count tell you about your funnel. They don’t tell you about your brand.
Measuring casino brand performance means tracking demand signals that exist outside your systems: how much player intent your brand is capturing, what share of the market you hold, and how those numbers compare to the brands you’re competing against.
That’s what Blask Index, BAP, APS, and CEB measure — and that’s the layer of intelligence that makes the difference between reacting to a problem and seeing it coming.