- Updated:
- Published:
iGaming brand benchmarking: how to measure your real competitive position
Internal KPIs tell you what happened in your funnel. Brand benchmarking tells you what’s happening across the entire market — and where you sit in it.
On average, 219 active brands compete in a single European iGaming market. In Latin America, that number is 216. In Africa, 164. These are not fringe operators — they’re all live, all chasing the same players, all running campaigns in the same geos.
Most of them only know their own numbers.
That’s the core problem with how iGaming operators track performance. Registrations, GGR, retention, LTV — all of it is self-referential. It tells you whether you’re growing relative to last month. It doesn’t tell you whether you’re growing relative to the market, which is the only comparison that actually determines competitive outcome.
A 15% increase in first-time deposits sounds strong. If the market grew 30% in the same period, that 15% means you’re losing ground — you just can’t see it from inside your own data.
iGaming brand benchmarking closes that gap. It places every brand on a shared competitive map, measured by the same signals, so operators can see their actual position relative to every other brand in the market — not just their own historical trend.
What brand benchmarking actually measures
Effective benchmarking in iGaming requires three reference points.
- Demand share. What percentage of total market player interest does your brand attract? Brand Accumulated Power (BAP) is Blask’s measure of this — a brand’s share of total player attention in a given country and period, normalized across all tracked operators. It answers: out of everything the market produces, how much of it flows to you?
- Revenue benchmark. Given your demand share and market position, what should you be generating? Competitive Earning Baseline (CEB) is the answer — a market-derived revenue estimate built from brand strength and competitive dynamics, not from internal financials. It’s always a range (min–avg–max), because competitive conditions create a spectrum of plausible outcomes. Lead with the average; the range shows the realistic envelope.
- Acquisition benchmark. Given the same position, how many new customers should you be bringing in? Acquisition Power Score (APS) is the external baseline for new customer volume, expressed as a range that reflects seasonal variability and competitive intensity.
Together, BAP, CEB, and APS give any operator a precise external view of their competitive situation — independent of what they choose to report.
What Blask Index measures
Blask Index is an AI-enhanced demand signal built from search activity across iGaming brands. It measures how much active player interest a brand generates in a market before that interest converts to registrations or deposits. It’s a leading indicator: brand demand shifts in Blask Index before they show up in revenue.
Position #1 isn’t permanent
The most important thing brand benchmarking reveals is movement. Market leaders in iGaming look stable until they aren’t.
Blask data from 2025 shows three markets where leadership shifted in ways that internal metrics alone wouldn’t have predicted.
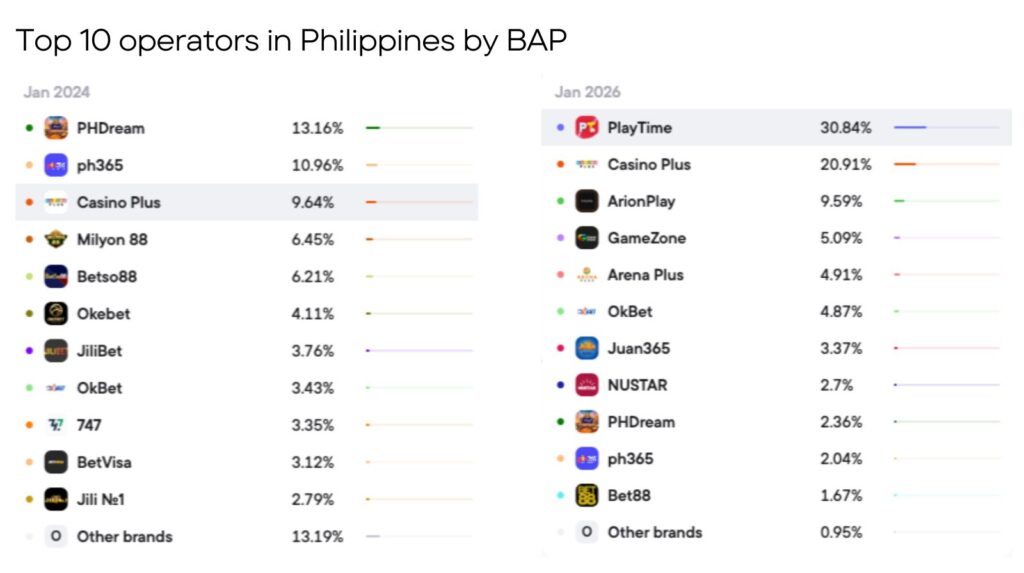
Philippines. Unlicensed operators held 68% of player attention at the end of 2024. By the end of 2025, that share collapsed to 22% as regulatory pressure redirected users toward licensed platforms. PlayTime captured the largest share of that shift: its BAP rose from 4% in December 2024 to 30.4% a year later — a gain of 26 percentage points in twelve months. No operator without external demand benchmarking would have seen that move coming until it was already done.
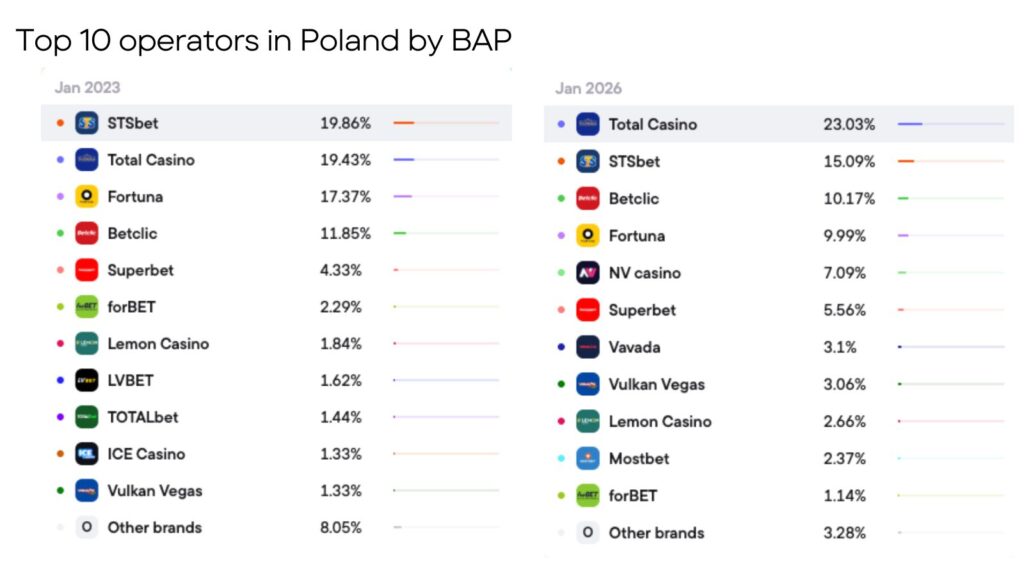
Poland. Online casino in Poland is a state monopoly. Total Casino’s BAP climbed from 14.8% in December 2024 to 24.8% by December 2025, driven by tightening enforcement and domain blocking of unlicensed operators. Structural demand shifted to the licensed brand, and BAP captured it in real time.
El Salvador. GanaPlay’s BAP nearly doubled year-over-year, making it the dominant operator by year-end. Sponsorship of three of the country’s most successful football clubs — Alianza FC, CD Águila, and CD FAS — built the brand presence that search demand eventually reflected.
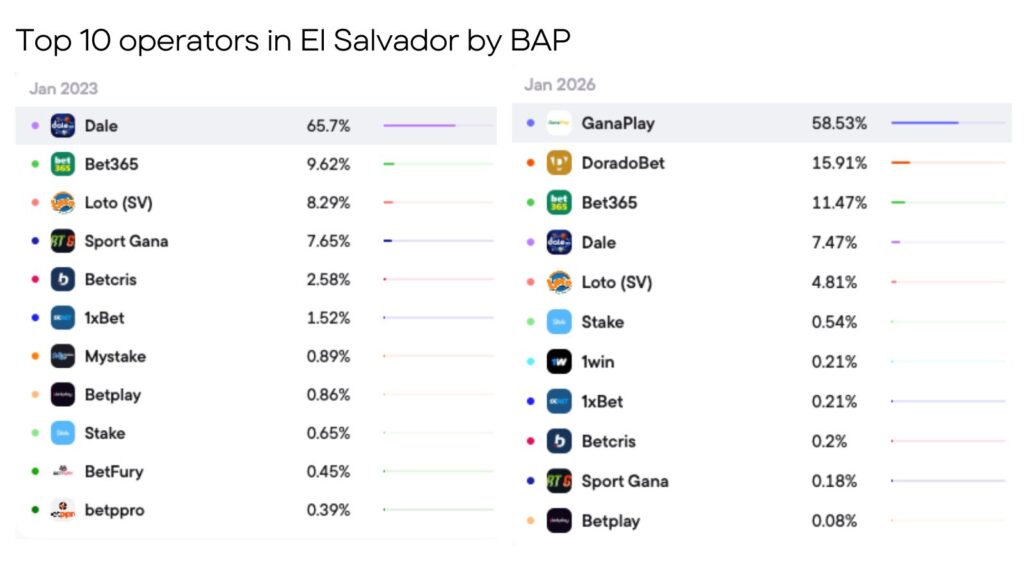
In all three cases, the shift was visible in BAP before it was visible in revenue data. That’s the value of a leading indicator: it gives you time to respond.
What about operator #50?
Here’s a practical problem that internal metrics can’t solve: everyone in a market knows who the top three brands are. Ask any iGaming professional to name the #1 operator in their target country, and they’ll give you the same answer.
Ask them about #50. Almost no one knows.
And yet operator #50 in Brazil has 519 competitors. In the UK, 335. In Nigeria, 184. That long tail is not irrelevant — it’s where competitive pressure builds before it reaches the top. It’s where new entrants launch, where niche operators build defensible positions, and where mid-market brands quietly gain or lose share without anyone noticing.
Blask tracks every brand on that list. Not just the top three — all of them, in a single ranked table with BAP, CEB, and APS for each one. An operator at position #50 can see exactly who is ahead of them, by how much, and at what rate those brands are growing or shrinking.
That comparison is impossible to construct from internal data. It requires a shared measurement framework applied consistently across every operator in the market. When that framework exists, the competitive picture for operator #50 is just as clear as it is for operator #1.
This is the infrastructure that iGaming brand benchmarking provides: a common denominator that lets every brand in a 200-brand market see where they actually stand.
Building a benchmarking practice
A usable benchmarking framework has four components:
- Market baseline. What is the total addressable demand in your target market by Blask Index? What are total APS and CEB across all brands? This is the ceiling — the maximum the market produces, shared among everyone competing in it.
- Competitive position. Where does your brand sit by BAP? Which brands are immediately above you, and by how much? Which brands grew faster than you over the last 12 months?
- Revenue and acquisition benchmark. What is your CEB (average and range)? What is your APS? How do these compare to your actual reported performance? The gap between CEB and actual revenue is diagnostic: a negative gap points to a conversion or product problem; a gap in Blask Index relative to CEB expectations points to a brand awareness problem.
- Trajectory. YoY and MoM Blask Index changes show whether competitive position is improving or eroding before that trend appears in revenue. A brand losing BAP share will see declining Blask Index months before it sees declining GGR — the Philippines example ran in the opposite direction, but the mechanics are the same.
Run this analysis quarterly. Markets move faster than annual reporting cycles. The European gambling market reached €123.4B in gross gaming revenue in 2024 and continues to add operators every quarter. The brand that spots a competitor’s Blask Index surge in Q1 can respond before that movement shows up in Q3 reports.
Conclusion
In a market of 200 brands, the operators that grow fastest are not necessarily the ones with the biggest budgets. They’re the ones that know exactly where they stand in the competitive map — and can see movement before it turns into market share loss.
iGaming brand benchmarking is how that map gets built. The signals are there. The question is whether you’re reading them.