- Updated:
- Published:
iGaming brand market share: how to measure it and what it reveals
Revenue rankings tell you who was biggest last year. Demand share tells you who’s gaining right now — and the two often point in opposite directions.
When Flutter Entertainment reported $16.3 billion in revenue for FY2025, it confirmed what the industry already knew: scale concentrates at the top. But that figure doesn’t tell you which of Flutter’s individual brands are gaining ground or losing it, what share any single brand holds in a specific market, or whether a new entrant is quietly eating into incumbents’ player base.
Revenue totals consolidate everything. For competitive analysis at the brand level, they’re close to useless.
iGaming brand market share is more granular — and more actionable — than a revenue ranking. This piece explains how it’s measured, what signals it captures, and how to read it in practice.
Why revenue-based rankings fall short
The global online gambling market is projected to reach $169.2 billion by 2030. That number is useful for macro context. It tells you nothing about how that revenue splits across 300+ operators in any given country — or whether a brand’s share of that market is growing or shrinking.
Revenue-based market share has three structural problems for operators:
- It arrives late. Financial reporting is quarterly at best. By the time a brand’s revenue numbers confirm that demand has shifted, competitors have already responded.
- It doesn’t distinguish between brands within a group. Flutter, Entain, and Evoke each operate multiple brands. Group-level revenue hides what’s happening at the brand level — which matters when brands within the same parent company are moving in opposite directions.
- It measures monetization, not acquisition. High revenue can reflect a loyal, aging player base drawing down over time. A brand can generate strong GGR while its front-of-funnel is quietly narrowing. Revenue validates the past; it doesn’t signal the future.
Demand-based market share: the other layer
Alongside revenue, there’s a parallel measure of market share built on player demand — how much attention and search activity a brand generates compared to all other operators in a market.
This is what Brand Accumulated Power (BAP) measures. BAP is a brand’s percentage of total market demand in a given country over a given period. It’s calculated from the Blask Index — an AI-enhanced demand signal derived from search activity across every tracked operator in a market.
Blask Index captures what players are actually doing: searching, engaging with brand content, performing account-related activity — before any of that converts to bets or revenue.
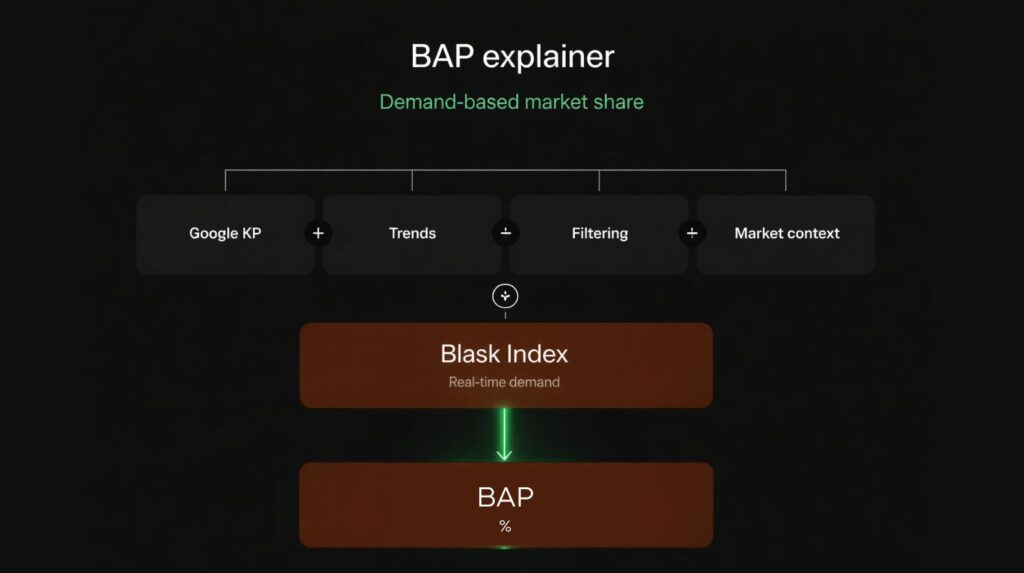
BAP answers one clean question: of all the player attention available in a market, what share does each brand hold?
Unlike GGR figures, it updates monthly. Unlike brand surveys, it’s behavioral — based on what players do, not what they say. And unlike revenue data, it’s a leading indicator.
Demand shifts before revenue shifts. A brand gaining BAP today will typically show revenue gains in the following quarters. A brand losing BAP is signaling a narrowing acquisition funnel before the P&L reflects it.
How market share concentration looks in a mature market
Any regulated iGaming market has hundreds of active brands. The UK had 335 active operators in 2025; Germany had 348. Most of that long tail holds negligible demand share. The top 10 brands in each market typically control 60–70% of total BAP.
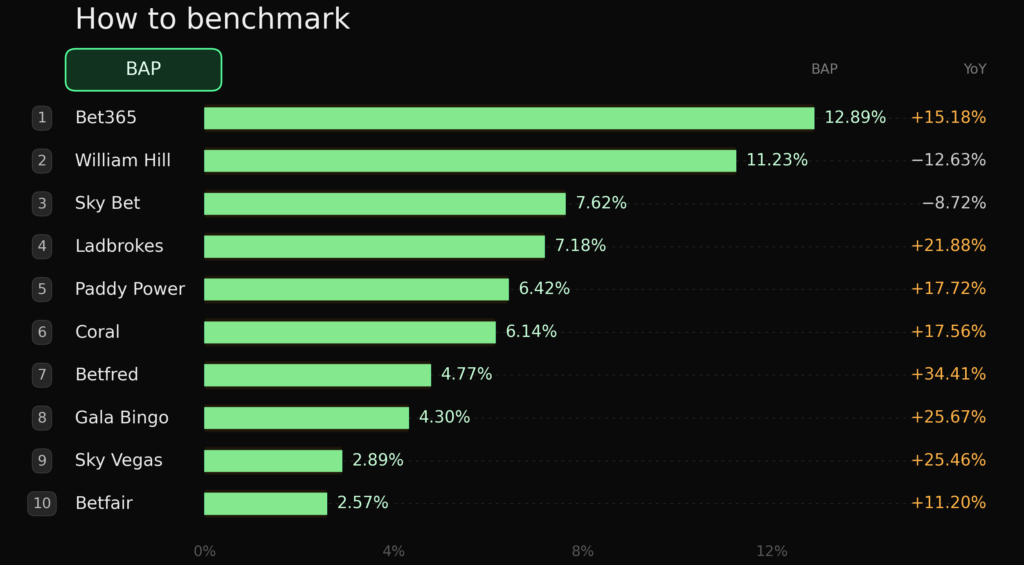
Here’s what that looks like in the UK, measured by Blask across January–December 2025:
| Rank | Brand | BAP | CEB (avg) | APS avg | YoY demand |
|---|---|---|---|---|---|
| 1 | Bet365 | 12.89% | $1.31B | 190K | +15.18% |
| 2 | William Hill | 11.23% | $1.29B | 167K | –12.63% |
| 3 | Sky Bet | 7.62% | $1.11B | 114K | –8.72% |
| 4 | Ladbrokes | 7.18% | $649M | 107K | +21.88% |
| 5 | Paddy Power | 6.42% | $589M | 96K | +17.72% |
| 6 | Coral | 6.14% | $587M | 92K | +17.56% |
| 7 | Betfred | 4.77% | $425M | 72K | +34.41% |
| 8 | Gala Bingo | 4.30% | $413M | 65K | +25.67% |
| 9 | Sky Vegas | 2.89% | $274M | 44K | +25.46% |
| 10 | Betfair | 2.57% | $256M | 39K | +11.20% |
Source: Blask data, January–December 2025. CEB and APS are average (mid-range) values.
Two metrics accompany BAP in this table:
- Competitive Earning Baseline (CEB) — a market-based revenue benchmark estimating what a brand should earn given its current demand position. Always expressed as a range (min–avg–max) because competitive conditions create a spectrum of plausible outcomes. The table shows the average.
- Acquisition Power Score (APS) — how many new customers a brand’s market position implies it should be attracting monthly. Also a range; the table shows the average monthly figure.
The top 10 collectively hold 66% of UK demand. The other 325 active brands share the remaining 34%.
Reading the data: what BAP reveals
The table above looks like a stable ranking. Bet365 is #1, William Hill is #2. But the YoY demand column tells a different story.
William Hill holds 11.23% BAP — and lost 12.63% of it in 2025. Its revenue position is still strong: a CEB of $1.29B ($968M–$2.26B range) reflects a large, established player base. But the front of the funnel is narrowing. Fewer new players are searching for and engaging with William Hill than a year ago. Revenue will follow that trend — it just hasn’t caught up yet.
Bet365, by contrast, grew demand 15.18% YoY while holding the top BAP position. The gap between #1 and #2 in demand terms widened through 2025, even though both brands sit within $20M of each other by CEB. Revenue shows near-parity. Demand shows divergence.
Betfred grew 34.41% YoY from 7th position — the strongest rate among established top-10 brands. That signal doesn’t appear in any revenue table. A mid-tier brand compounding demand share while larger brands plateau is exactly what BAP is built to surface early.
The portfolio dimension adds another layer. Flutter’s UK brands — Sky Bet (7.62%), Paddy Power (6.42%), Sky Vegas (2.89%), Betfair (2.57%) — combine to roughly 19.5% BAP. Entain’s portfolio — Ladbrokes, Coral, Gala Bingo — reaches 17.6%. No individual brand exceeds 13%, but at the group level, both Flutter and Entain hold more demand than any single operator. Competitive analysis that stops at brand-level rankings misses this.
When market share shifts faster than expected
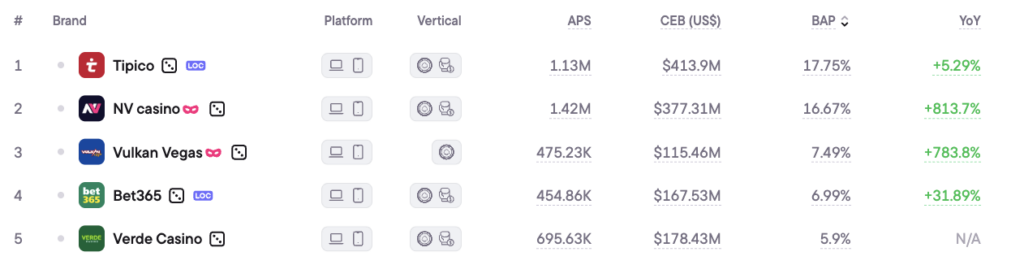
In a mature market like the UK, brand positions move slowly. In a younger regulated market, demand share can redistribute dramatically in months. Germany opened its regulated online market in July 2021 and is still settling. The 2025 BAP data shows what that looks like:
| Rank | Brand | BAP | CEB (avg) | YoY demand |
|---|---|---|---|---|
| 1 | NV Casino | 18.01% | $365M | New (launched Nov 2024) |
| 2 | Tipico | 17.22% | $408M | +2.61% |
| 3 | Vulkan Vegas | 7.04% | $102M | +719.54% |
| 4 | Bet365 | 6.65% | $162M | +22.15% |
| 5 | Verde Casino | 5.90% | $167M | New (launched Feb 2025) |
Source: Blask data, January–December 2025.
NV Casino launched in November 2024. By the end of 2025, it held the highest BAP in a market of 348 operators — ahead of Tipico, which has been in Germany since 2008.
At the same time, Tipico’s CEB ($408M) exceeds NV Casino’s ($365M), because an established player base monetizes at higher rates even after being overtaken on demand. The divergence is temporary: if NV Casino sustains its BAP lead, the revenue gap closes.
Vulkan Vegas is the other extreme — 719% YoY demand growth, from near zero to 7.04% BAP in 12 months. Its CEB of $102M ($51M–$254M range) shows revenue hasn’t yet caught up with demand. Both cases gave clear signals in the demand data before any revenue confirmation existed. That’s the practical value of BAP as a leading indicator.
Three things market share data tells operators
- Direction matters more than current rank. A brand at 11% BAP and declining is in a worse competitive position than a brand at 5% BAP and growing 30% YoY. Betfred at 7th in the UK with +34.41% YoY is a stronger competitive signal than William Hill at 2nd with –12.63%.
- Revenue and demand diverge for quarters before reconciling. A competitor losing BAP while holding revenue is drawing down equity, not building it. An entrant gaining BAP without yet appearing in revenue tables is the one to track before others do. This is where competitive intelligence lives.
- Portfolio analysis changes the picture. In markets with large operator groups, no single brand ranking captures actual concentration. Group-level BAP aggregation shows how much competitive pressure really sits behind each set of brands.
The bottom line
iGaming brand market share isn’t a single metric. It’s a demand layer — BAP, Blask Index — running alongside a revenue layer, and the two often diverge. The demand layer is faster-moving and earlier-signaling. It surfaces competitive shifts before they reach quarterly reports.
In the UK, William Hill holds second place by BAP while losing more demand share than any other top-10 brand. In Germany, a brand launched 13 months ago leads the entire market by the same metric. Neither data point appears in a revenue ranking. Both are material to competitive strategy.