- Updated:
- Published:
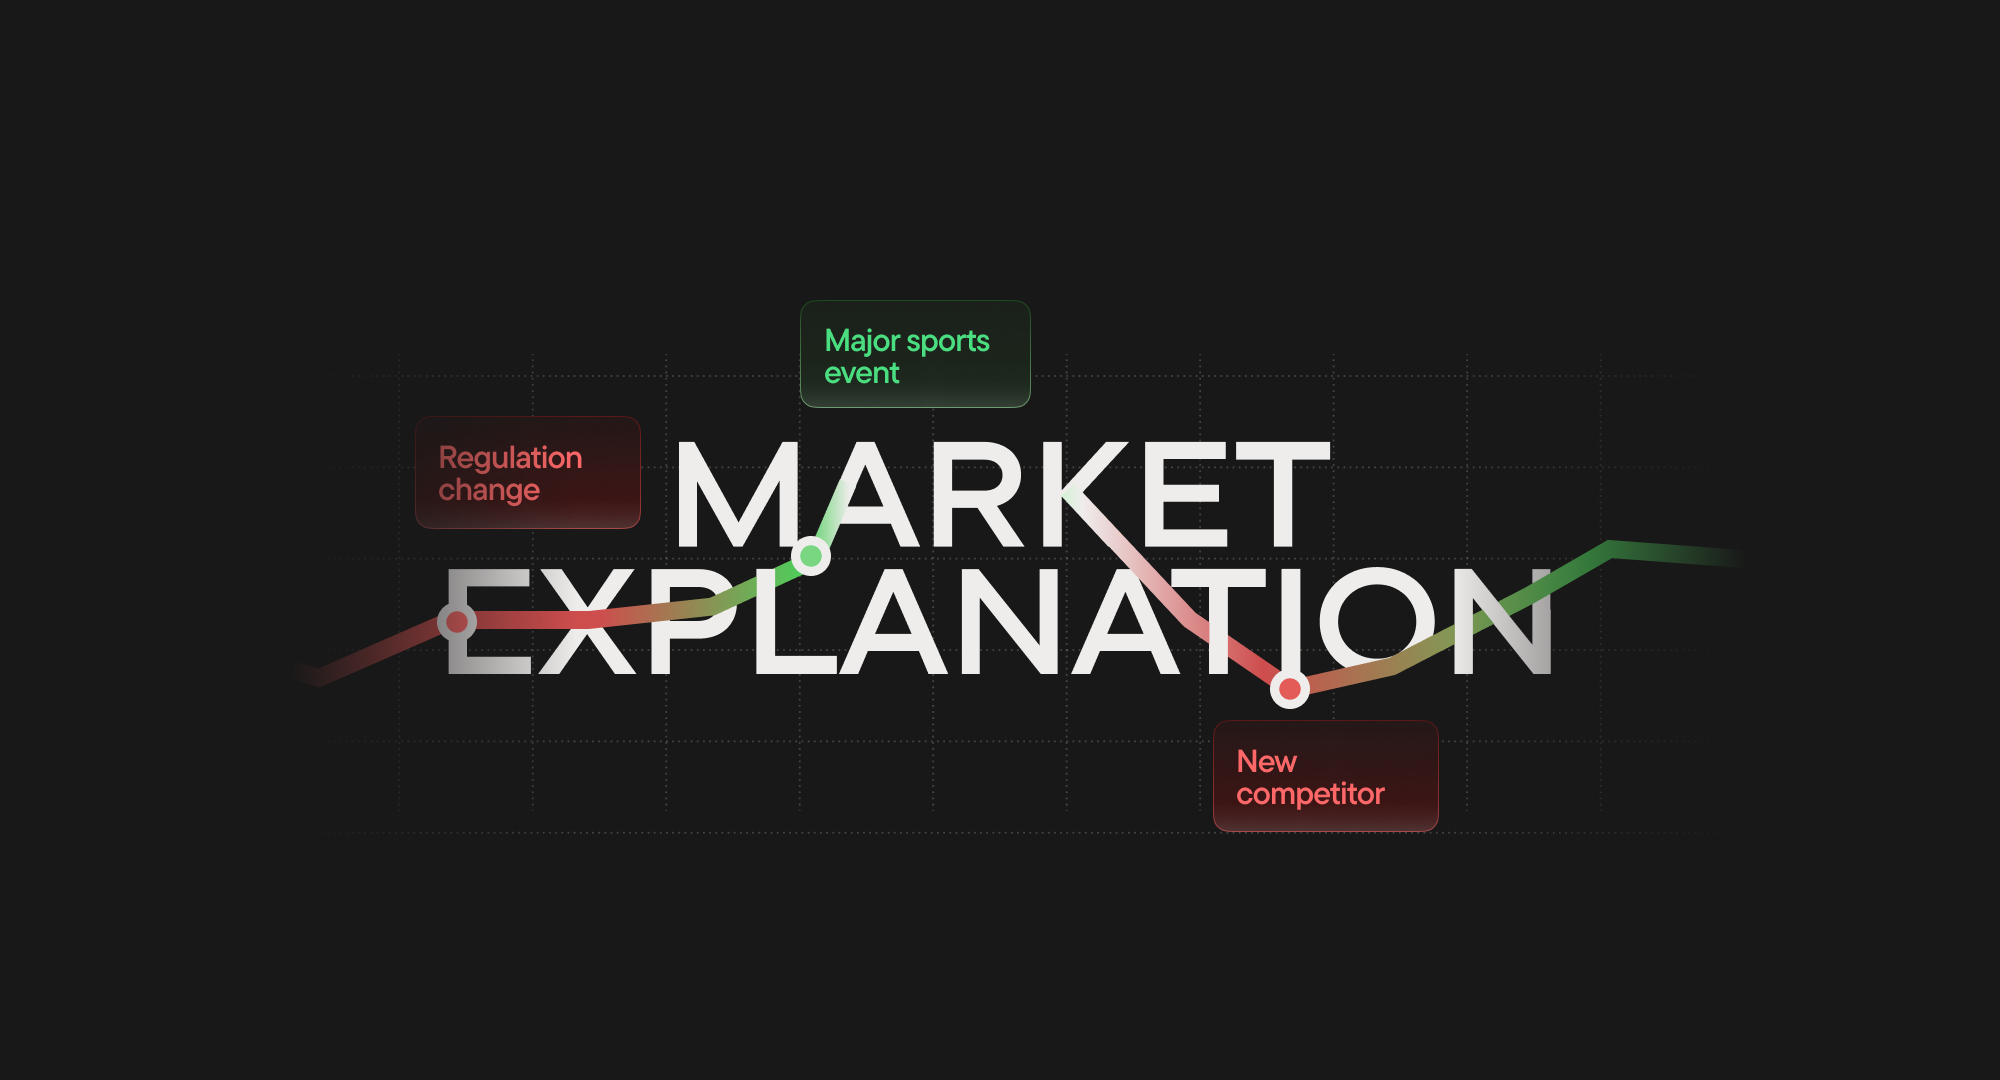
Market Explanation: how Blask explains local trends in one click
How Blask turns a trend line into a full breakdown of what’s driving the market.
Market Explanation is Blask’s AI-powered feature that answers the “why” behind market movements. This article is for teams who want to understand how it works under the hood: what data we collect, how we process it, and how explanations are generated.
How Market Explanation works
Market Explanation follows a four-stage pipeline:
- Data Collection — the system aggregates relevant events and signals from the period matching a detected trend cycle.
- Event Analysis — it analyzes which factors correlate with the observed Blask Index movement.
- LLM Processing — the model synthesizes these inputs into a structured narrative.
- Output Generation — a post-processing layer validates sources and formats the output.
Let’s take a closer look at each stage.
Data sources
We parse four categories of data to build each explanation.
- Sports calendar covers major competitions that drive betting activity in each market — from UEFA fixtures and World Cup qualifiers to domestic leagues, F1, tennis, and more.
- Regulatory news covers licensing changes, enforcement actions, advertising restrictions, tax updates, and operator sanctions — sourced from national regulators like UKGC, GGL, ANJ, and DGOJ, alongside government publications.
- Casino and product data draws from GGR reports, stake cap changes, operator earnings, product launches, and more.
- Macro and payments data covers consumer sentiment, central bank rates, inflation, payment outages, seasonal patterns, etc.
LLM architecture
The system runs on a two-model setup. The primary model is the latest GPT extended thinking version, which handles analysis and narrative generation — evaluating event relevance, weighing competing drivers, and producing the explanation text.
A lightweight post-processing model then structures the output, validates sources, and ensures formatting consistency.
Update frequency and cycle detection
Explanations are generated once per month, aligned with the latest available data from regulators, sports calendars, and macro sources.
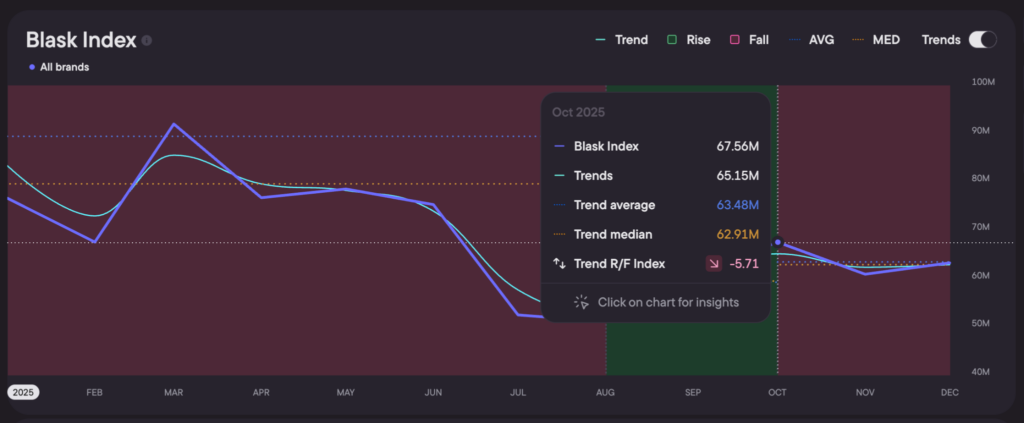
Cycle detection works through Blask Trends, which smooths short-term volatility in Blask Index to identify whether a market is rising, falling, or stagnating. Once a regime is labeled, Market Explanation analyzes the corresponding time window.
Output structure
Each Market Explanation delivers a consistent set of components.
- The overview provides a two-to-three sentence summary of what happened and the primary driver behind the trend.
- Segment drivers break down the movement across four categories: sports-led factors, casino-led dynamics, regulatory and payments, and macro factors.
- The event table lists key moments chronologically — date, driver description, effect direction, category, and source links.
- Ruled out drivers show factors that were investigated but excluded due to insufficient evidence or timing mismatch, adding transparency to the analysis.
Let’s look at a few examples.
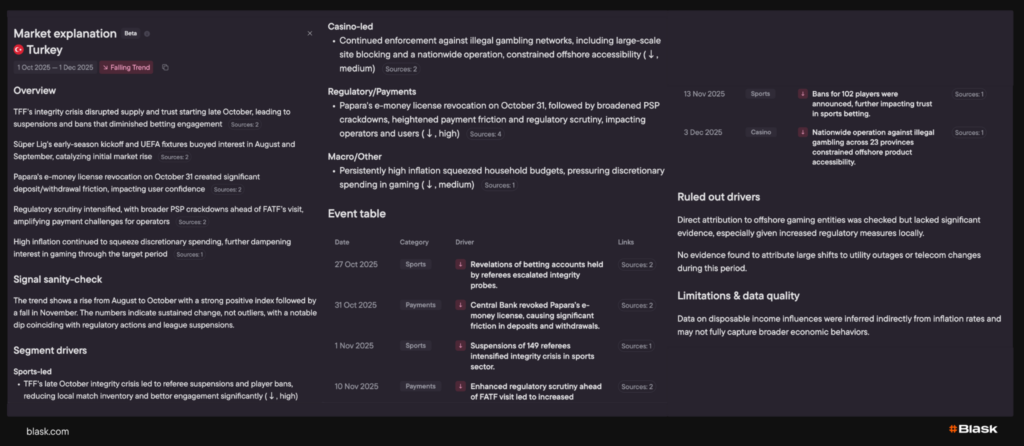
Turkey — Falling Trend (Oct–Dec 2025)
A rare case where all four drivers pushed in the same direction: integrity crisis in sports, payment provider crackdowns, offshore enforcement, and inflation pressure.
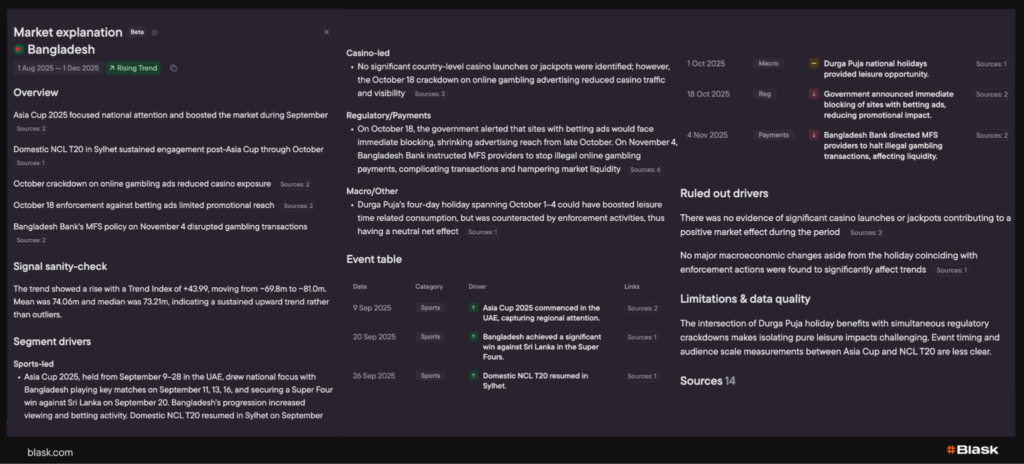
Bangladesh — Rising Trend (Aug–Dec 2025)
Sports-led growth powered by Asia Cup 2025 and domestic NCL T20 — despite late-period headwinds from ad blocking and MFS payment restrictions.
Feedback
Market Explanation is in Beta. We’re continuously expanding coverage, improving event detection, and refining driver prioritization.
Try it inside Blask and tell us what’s working — and what’s missing. Reach out at accounts@blask.com or book a demo.