- Updated:
- Published:
YoY and MoM growth
Year-over-Year (YoY) and Month-over-Month (MoM) are classic growth lenses, but inside Blask they take on real-time power.
Because both metrics are calculated straight from the hourly-updated Blask Index, you see the exact percentage change between today and the same day 365 days ago (YoY), or today and 30 days ago (MoM).
That means iGaming teams can benchmark momentum within minutes, spot seasonal shifts as they form, and react before rivals even refresh their spreadsheets.
What YoY & MoM mean in Blask.
The formulas stay familiar:
- YoY % = ( Today’s Blask Index – Blask Index 365 days ago ) ÷ Blask Index 365 days ago × 100
- MoM % = ( Today’s Blask Index – Blask Index 30 days ago ) ÷ Blask Index 30 days ago × 100
Because YoY & MoM in Blask are calculated from the Blask Index value of today versus the value 30 or 365 days ago, they register market mood the moment search interest moves — days or even weeks before revenue sheets close.
What is Blask Index?
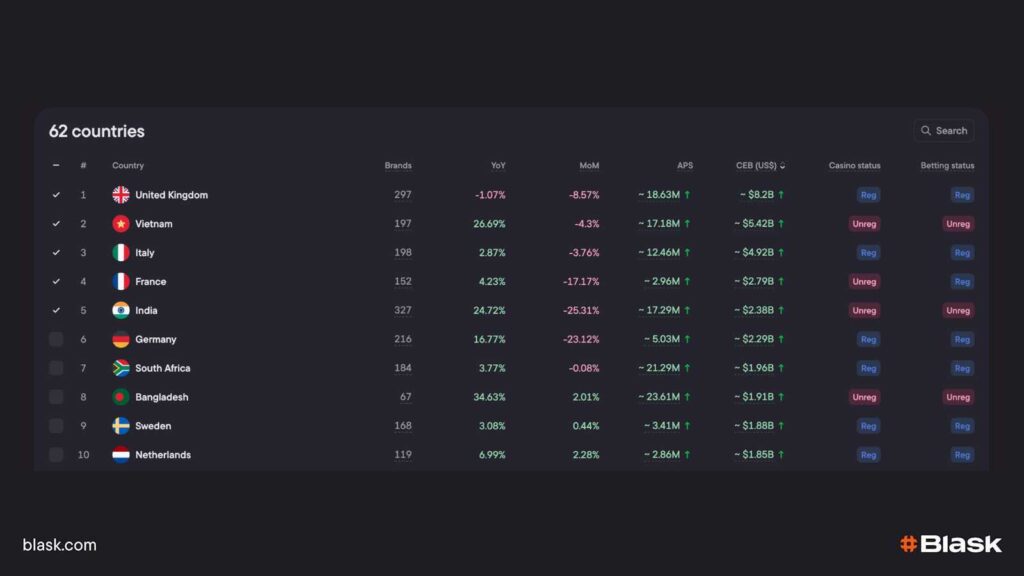
- An hourly “share-of-search” gauge: we pull the search volumes for every iGaming brand, strip out noise (e.g., “scam”, “cash-out problem”), normalise them against the country’s total search pool, and rescale to a single headline number.
- Academic work shows Share-of-Search predicts real market share with ≈95 % accuracy; our back-tests on iGaming confirm that link.
- Because the data is refreshed 24×7, any spike in searches: for example, after an IPL match or a new bonus, instantly flows into the day’s Index and therefore into today’s YoY / MoM percentages.
Read more: What is Blask Index.
Why real-time YoY & MoM matter
| Classic use-case | Real-time twist in Blask |
|---|---|
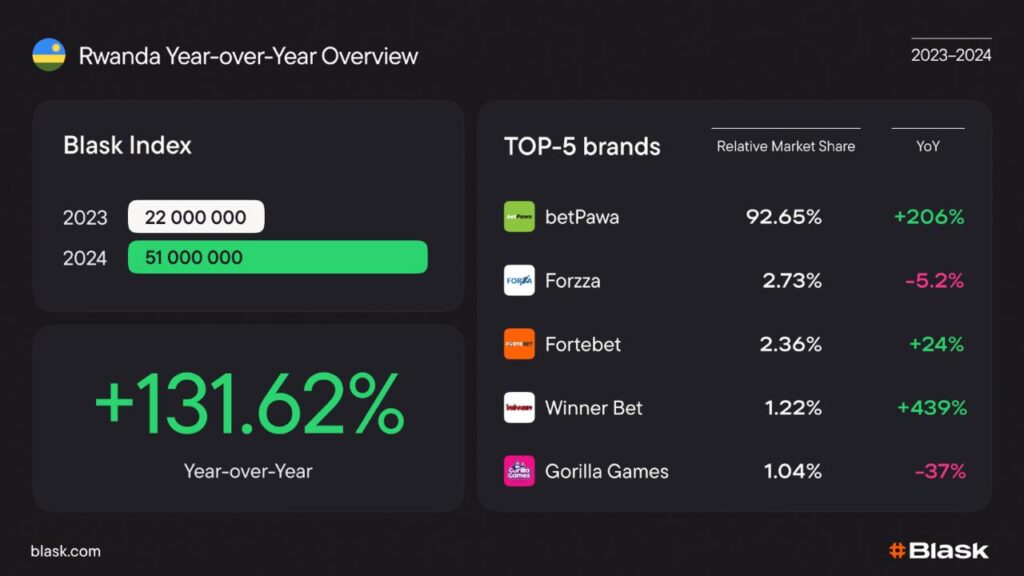
| Spot long-term market cycles | Daily YoY charts reveal whether an emerging market—e.g., Rwanda’s 132% YoY surge — still has tail-winds or is cooling |
| Catch seasonality | MoM exposes mid-season IPL bumps that static quarterlies miss |
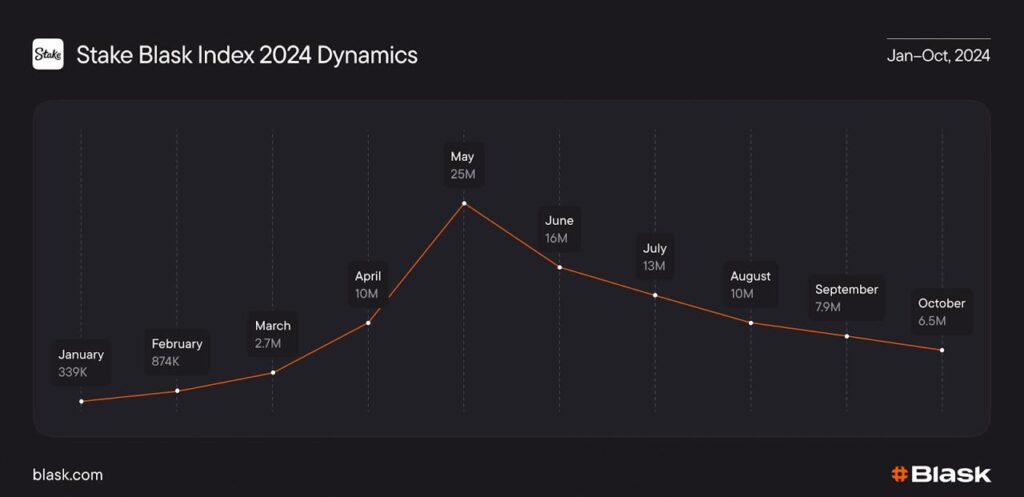
| Grade campaigns fast | Stake’s INR push sent its MoM above +500% within weeks; partners saw that in Blask the same day |
| Benchmark competitors | Compare your YoY to market YoY to see if you’re outpacing overall interest or riding the tide blask.com |
Practical use-case playbook for YoY & MoM metrics in Blask
Below you’ll find two focused “cheat-sheets.” The first shows how Year-over-Year (YoY) swings in Blask Index support big-picture, long-cycle choices. The second lists Month-over-Month (MoM) moves you can act on this week.
Both metrics are just the percentage change between today’s Blask Index reading and the figure on the same day 365 (or 30) days ago, so they surface demand shifts long before revenue books close.
YoY = strategic headlights
(12-month horizon)
| Strategic question | How to use YoY | Real-world example |
|---|---|---|
| Where should we expand next? | Rank all markets in Blask by YoY, then shortlist the top risers for licensing / M&A. | The Phillipines Blask Index jumped +80% YoY in 2024 |
| Is our brand still gaining mind-share? | Compare your YoY to the market average. A negative gap signals brand fatigue. | Blask’s “5 signs you’re losing Market share” recommends benchmarking YoY to spot slippage early. |
| Budget re-allocation | Shift annual media spend toward markets/brands with the highest positive YoY delta; cut the laggards. | Blask’s “Emerging markets reshaped iGaming in 2024” piece shows budget moving from saturated UK to fast-growing African states. |
| Investor & board reporting | Use YoY to frame long-term health instead of month-end revenue snapshots. | — |
✨ Explore: How to enter new markets.
MoM = Tactical levers
(30-day horizon)
| Tactical Decision | How to use MoM | Real-world example |
|---|---|---|
| Campaign pulse-check | Pull brand-level MoM daily; ≥ +15 % means the promo is working—extend budget. | Stake’s INR roll-out saw MoM Index leap from +177% in Feb-24 to Apr-24, proving its IPL promo hit the mark. |
| Event hijacking | Track MoM for the whole market during tournaments to time flash-bonuses. | During IPL 2024 opening weekend India’s Index spiked +86% MoM—operators triggered real-time push offers. |
| Optimise day-parting | Combine MoM with Blask’s hourly view to find peak traffic windows, then schedule live-dealer tables or boosted odds. | — |
| Creative A/B tests | Run two ad concepts for 14 days; whichever brand gets the higher MoM lift wins the creative budget. | — |
Why it works
Single Pane – Both metrics live on every Blask dashboard, alongside deeper signals like Brand’s Accumulated Power (BAP) and Competitive Earning Baseline (CEB), giving one continuum from interest → acquisition → revenue.
Same DNA – YoY and MoM are built on Blask Index, the search-behaviour proxy that mirrors market share with up to 95% correlation. A rise in searches today hits YoY/MoM immediately — weeks before finance ledgers close.
✨ Read more: Ushering in APS & CEB for a new era of brand performance
Conclusion
Blask’s real-time YoY and MoM views turn the familiar “growth calculator” into an early-warning radar. Because both metrics are drawn straight from the hourly-refreshed Blask Index, they surface demand swings the moment search intent moves — days or even weeks before revenue or deposit data arrives.
- Use YoY for strategic steering: decide which markets to enter, whether your brand is truly expanding, and how to brief investors on long-cycle health.
- Use MoM for tactical wins: validate campaigns in-flight, hijack live events, and optimise acquisition windows right down to the hour.
Pair these signals with deeper Blask benchmarks — BAP, APS, CEB — and you have a single continuum from interest ➜ acquisition ➜ revenue.