- Updated:
- Published:
IPL and Indian iGaming: an 18x growth story that repeats every spring
Every March, something predictable happens in India’s iGaming market: it surges. The Blask Index, Blask’s measure of market-wide player demand, has grown on IPL opening day every year since 2017 — from 276,000 in the first season to 2,480,000 in 2026. Ten seasons, nearly ten-fold growth on opening day alone. But the 2026 season introduced a new question: what happens when opening day is also the peak?
This article is the definitive reference for understanding what IPL does to India’s iGaming market — season by season, brand by brand, and player by player. Updated annually with new data.
Why IPL moves the market more than any other event
Cricket is not a sport in India. It is closer to a shared national language — the one thing that cuts across regional, linguistic, and economic lines. IPL translates that cultural weight directly into betting intent.
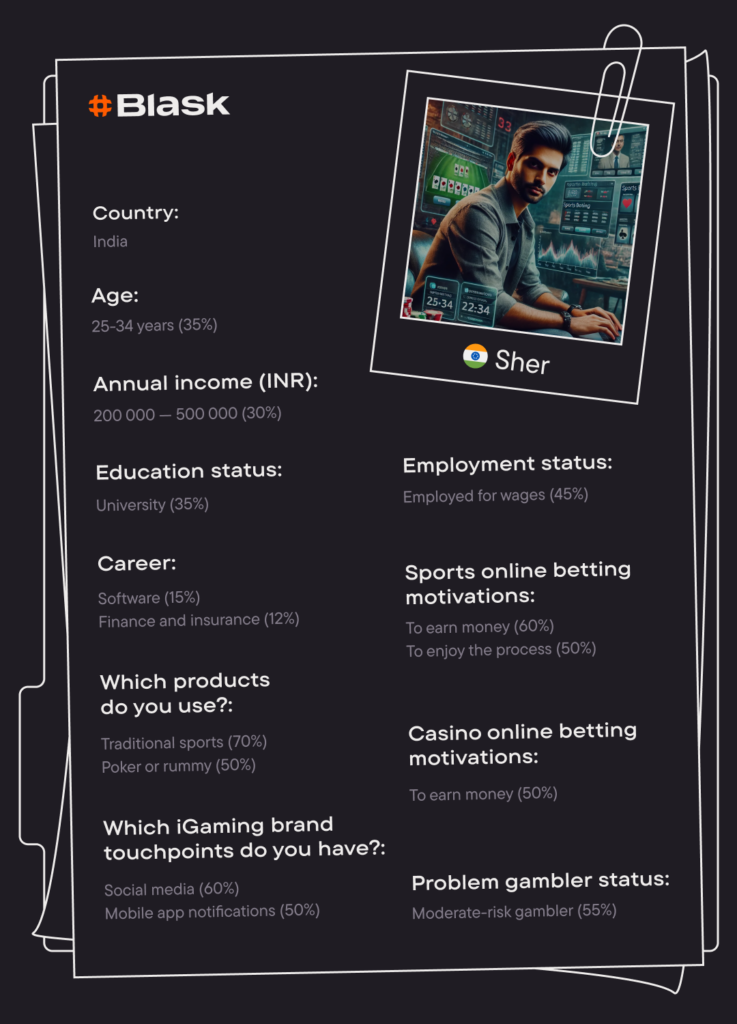
According to Blask’s Customer Profile data, 70% of Indian iGaming players prefer traditional sports, with cricket and football at the top. For 50% of them, betting is explicitly how they enhance the match-watching experience — not a separate activity, but an integral part of it. And 60% are motivated by the potential income dimension.
When IPL runs, these three motivations converge simultaneously for two months. The result is the most concentrated, predictable demand spike in any iGaming market Blask tracks.
The data: IPL opening day vs Blask Index, 2017–2026
The table below shows the Blask Index on the day before IPL opening versus opening day itself — tracking demand the tournament unlocks in a single 24-hour window.
| Season | Pre-IPL Blask Index | Opening Day | 24h Surge |
|---|---|---|---|
| IPL 2017 | 121.8K | 276.4K | +127% |
| IPL 2018 | 114.5K | 291.9K | +155% |
| IPL 2019 | 176.8K | 249.6K | +41% |
| IPL 2020 | 372.1K | 715.4K | +92% |
| IPL 2021 | 569.9K | 1.23M | +116% |
| IPL 2022 | 674.8K | 1.27M | +88% |
| IPL 2023 | 868.1K | 1.84M | +112% |
| IPL 2024 | 1.28M | 2.38M | +86% |
| IPL 2025 | 1.60M | 2.39M | +49% |
| IPL 2026 | 1.43M | 2.48M | +74% |
Two things stand out. First, the absolute base keeps growing — the market IPL catalyses every spring is larger than the one it catalysed the spring before. Second, the percentage surges remain large even as the base grows: even in 2026, with no pre-season cricket priming the market, IPL added over one million daily engaged users overnight
Note that the 2025 pre-IPL baseline of 1.60M was itself already elevated — by late March 2025, the market had been rising for six weeks driven by the ICC Champions Trophy (Feb 19–Mar 9) and the Women’s Premier League (Feb 14–Mar 15). IPL didn’t ignite a cold market; it accelerated one already moving.
Opening day is not the peak
This is the most important operational insight for operators timing their campaigns.
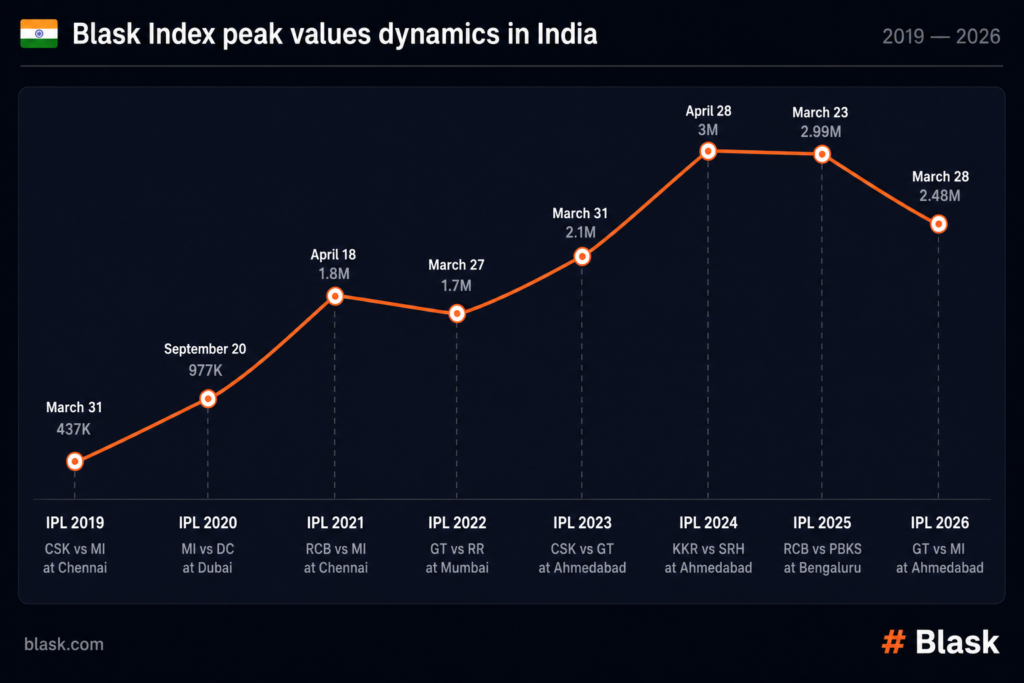
Blask data consistently shows that opening day activity — while dramatic — is not where the season peaks. The record highs come mid-tournament, when India’s most popular franchises meet on the same day.
- IPL 2021: Peak of 1.8M on April 18 — during RCB vs KKR
- IPL 2023: Peak of 2.1M on March 31 — one week in, double-header format
- IPL 2024: All-time high of 3.0M on April 28 — SRH, CSK, GT, and RCB all playing on the same day
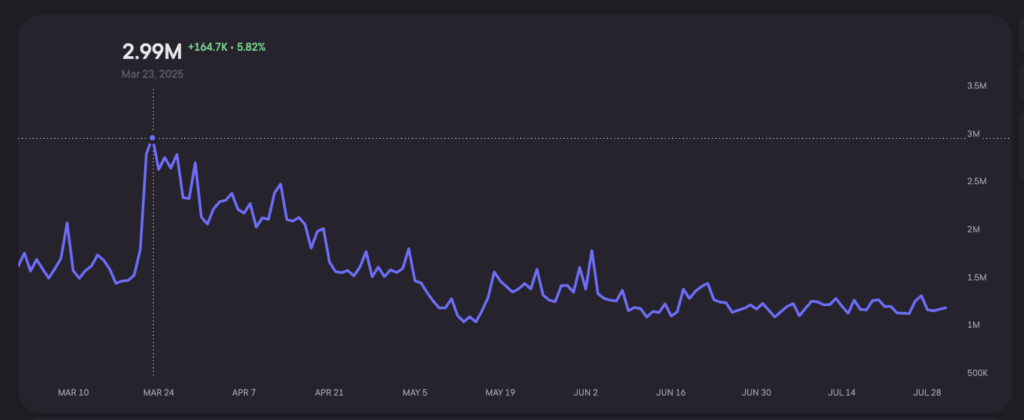
- IPL 2025: Season peak of 2.99M on March 23 — the day after opening
IPL 2025 is an exception that proves the rule: the March 23 spike came unusually early because the market was already primed by the Champions Trophy. The Trends R/F Index hit +100 (full Rise classification) on opening day — momentum that had been building for weeks was immediately channelled into IPL.
IPL 2026 reversed the pattern entirely. Opening day (March 28, 2.48M) was the season peak — the first time this has occurred in nine seasons of tracking. The market declined every subsequent week, with the final drawing ~970K, or 39% of the opening-day figure. The structural cause: no comparable pre-season cricket inventory in early 2026 meant pent-up demand was spent in the first 48 hours rather than building through the tournament.
Season Opening Day Season Peak Peak Date Final Day Final as % of Peak IPL 2024 2.38M 3.0M April 28 — — IPL 2025 2.39M 2.99M March 23 1.81M 61% IPL 2026 2.48M 2.48M March 28 ~970K 39%
The formula for peak engagement: marquee team matchups, mid-to-late season when the playoff picture is coming into focus. That combination drives peak engagement more reliably than any calendar milestone — with the caveat that a pre-heated market can front-load the spike. For media planning: monitor the pre-season cricket calendar, not just IPL’s start date. In 2025, operators who activated in February for Champions Trophy had a structural advantage by IPL’s first week. When no pre-season cricket calendar exists, the opening-day surge may represent the ceiling, not the floor.
The 2020 exception: how a pandemic became an accelerant
IPL 2020 was played not in India but in the UAE — bio-bubbles in Dubai, Abu Dhabi, and Sharjah, from September to November. No crowd noise from Indian stadiums, unusual time slots, physical isolation.
The market responded with the biggest single-season leap in the dataset: from a 2019 peak of 65,000 to a 2020 peak of 524,000. An 800% increase, season-over-season.
The explanation mirrors the broader COVID iGaming dynamics: people confined at home, physically cut off from entertainment options, redirected attention to online platforms. The unusual timing (September rather than April) meant IPL arrived just as the first lockdown fatigue was peaking. The appetite was there; IPL gave it structure.
Season-by-season: how the market evolved year by year
- 2018 (peak: 38K). A functional, regional market. High-scoring matches generated 10–20% more interest than average matches. The correlation between on-field drama and betting intent was already clear even at small absolute scale.
- 2019 (peak: 65K). Double-headers drove the biggest numbers — two simultaneous matches creating overlapping fan attention. May 5 (KXIP + MI victories on the same day) hit the season high.
- 2020 (peak: 524K). The COVID inflection. UAE setting, pandemic context, explosive growth.
- 2021 (peak: 1.8M). Split season — India then UAE. The Indian phase (April) peaked at 1.1M; the UAE phase averaged 800K. The market carried across the venue change with barely any drop.
- 2022 (peak: 1.4M). The season that introduced new franchises (Gujarat Titans, Lucknow Super Giants) and maintained an average above 1.1M throughout. New teams meant new fan bases actively discovering iGaming during tournament season.
- 2023 (peak: 2.1M). The first season to consistently hold above 1.3M throughout. Double-headers drove weekly peaks above 1.7M. The market demonstrated structural maturity: not just big spikes but a sustained elevated floor.
- 2024 (peak: 3.0M). All-time record. Blask Index more than doubled between pre-IPL baseline and peak day. Stake’s IPL campaign captured an extraordinary share of this growth.
- 2025 (peak: 2.99M). A more complex season — a front-loaded spike, an unprecedented mid-season suspension, and a post-tournament regulatory shock that reshaped the market’s long-term trajectory. Full analysis below.
- 2026 (peak: 2.48M). The first season in which opening day was the season peak. The market declined continuously from March 28 through the final on May 31 (~970K). No pre-season cricket inventory (no Champions Trophy equivalent in early 2026) meant demand arrived fully formed on day one and spent itself over 48 hours. The Online Gaming Act (October 2025) likely contributed to a structurally lower ceiling: the season peak represents a 17% decline from the 2024–2025 highs of ~3.0M.
IPL 2025 and 2026: two seasons that broke different patterns
IPL 2025 (March 22 – June 3) and IPL 2026 (March 28 – May 31) each disrupted the tournament’s established demand patterns — in opposite directions.
IPL 2025: the pre-loaded surge
Act 1 — The pre-loaded surge (January–March). The Blask Index rose from ~1.4M in January to 2.99M by March 23 — a sustained, multi-week climb driven not by IPL but by the cricket calendar preceding it. Champions Trophy ran from February 19, with the India-Pakistan match on February 23 generating one of the biggest single-match spikes of the year. WPL added nightly T20 inventory from February 14. UPI recorded its highest-ever transaction volume in March 2025, reflecting infrastructure aligned with peak demand. By the time IPL opened on March 22, the market was already in full Rise classification (Trends R/F Index: +100).
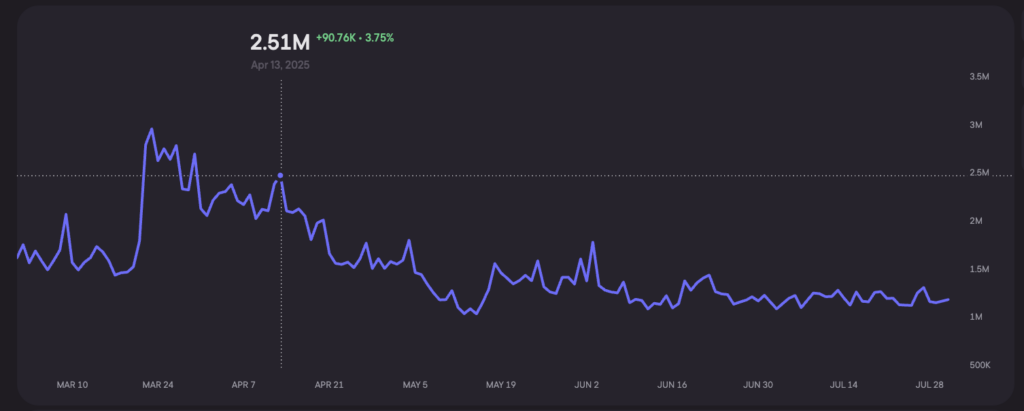
Act 2 — The sustained peak (April). The Blask Index remained elevated through April, settling around 2.51M on April 13 — still above both the trend average of 1.87M and the trend median of 1.86M. By this point, Trends had shifted to Fall classification (R/F Index: −100): not a collapse, but the signal that the peak had passed and the tournament was in its second half.
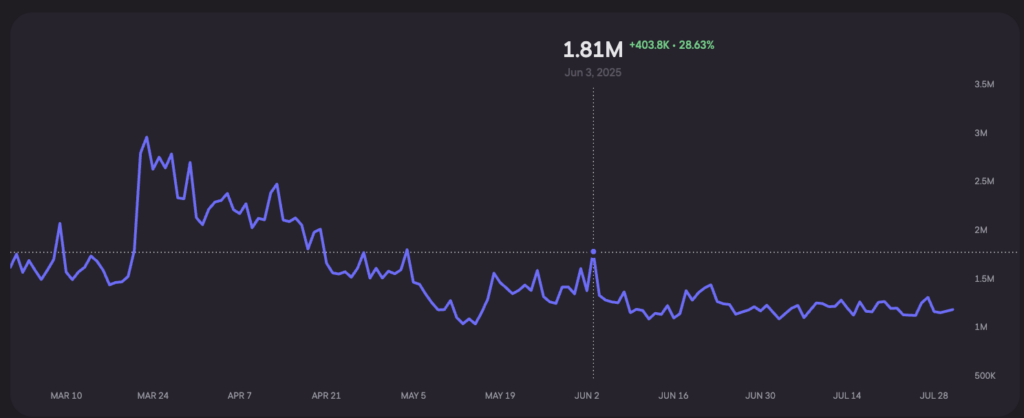
Act 3 — Suspension and close (May–June). On May 9, IPL was suspended due to India-Pakistan military tensions — the first unscheduled interruption in the tournament’s history. Play resumed on May 17. The final was held on June 3 with a Blask Index of 1.81M (R/F Index: −34.08). The suspension created a brief demand interruption mid-tournament that compressed the normal end-of-season elevation. Final-day demand at 61% of the season peak remained within the normal historical range.
The broader seasonality chart shows the full arc clearly: Blask Index rose from ~40M in January to ~67M at the March–April peak, then declined steadily to ~45M by July–August — a higher post-season floor than pre-IPL, reflecting the market’s continued structural expansion.
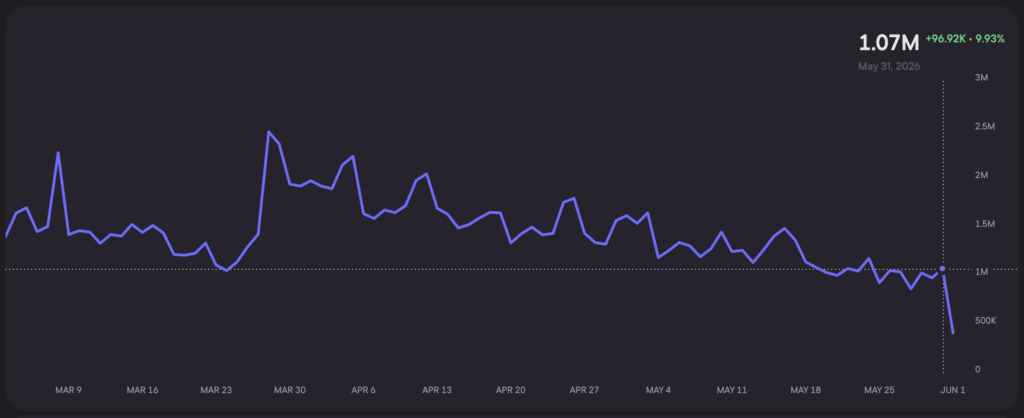
IPL 2026: when opening day is the ceiling
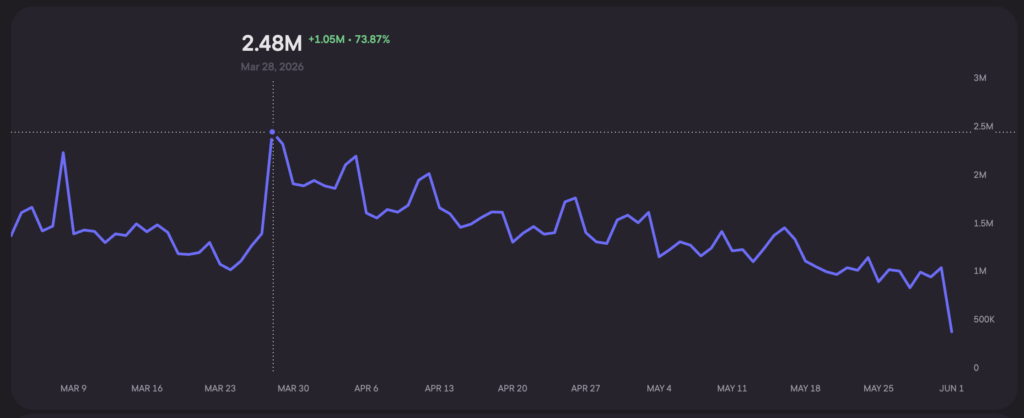
Act 1 — Opening day as peak (March 28). The market opened at 2.48M — a record opening-day figure — but unlike every prior season, this was not the launchpad for further growth. It was the season high. No comparable pre-season cricket inventory existed in early 2026: no Champions Trophy, no WPL equivalent driving a six-week demand ramp. The full burst of pent-up demand arrived on day one and was spent within 48 hours.
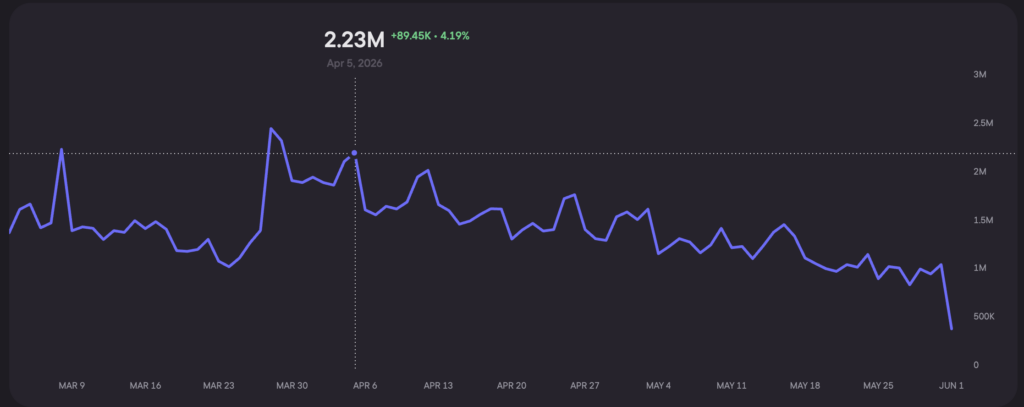
Act 2 — Continuous decline (March–May). The Blask Index fell every subsequent week without recovery. Brief weekend doubleheader peaks reached 2.23M (April 5) and 2.05M (April 12) — each lower than the last. By the league stage close on May 16, the Index had fallen to 1.49M.
Act 3 — The playoffs and final (May). Qualifier 1 (May 26, RCB beat GT) drew 1.03M. The final on May 31 — RCB’s second consecutive title, Kohli 75* — registered an estimated ~970K. That is 39% of the opening-day figure, and a 46% year-over-year decline from IPL 2025’s final-day reading of 1.81M. Across nine prior seasons, Blask had not recorded a year-over-year decline in final-day demand.
The structural explanation is consistent across both seasons: the pre-IPL cricket calendar now shapes the season’s demand curve as much as IPL itself. When it exists (2025), demand builds for weeks and peaks mid-tournament. When it doesn’t (2026), opening day consumes all available intent at once. This is now the primary variable operators should track when planning India market activation.
The 2025 competitive landscape: market fragmentation
If 2024 had one story — Stake’s historic rise — 2025 had many. The tournament no longer belonged to a single brand.
BAP through IPL 2025:
| Brand | March 2025 | April 2025 | May 2025 |
|---|---|---|---|
| Stake | 20.01% | 17.79% | 17.46% |
| 4RABET | 8.93% | 9.22% | 9.88% |
| Winmatch | 8.44% | 7.09% | 6.37% |
| Khelo24bet | 8.31% | 7.36% | 6.93% |
| Dafabet | 7.78% | 9.33% | 8.79% |
| Parimatch | 6.75% | 7.03% | 5.61% |
| 1xBet | 4.51% | 4.40% | 4.00% |
Stake entered the 2025 IPL season already holding 20% — a baseline that itself reflects successful retention from 2024. But unlike the previous year, when Stake climbed from 1.27% to 39.75% during the tournament, 2025 saw gradual decline rather than acceleration: 20% in March → 17.46% in May. The platform remained #1 by a significant margin, but the gap to the field narrowed.
The more interesting story is what happened below Stake.
- Winmatch emerged as the breakout brand of IPL 2025: 8.44% BAP in March, an 828.7% year-over-year growth rate for the Jan–Aug 2025 period. A regional-native platform with cricket-first product positioning, Winmatch captured a significant share of the market segments Stake had opened up in 2024.
- Khelo24bet showed similar dynamics: 8.31% BAP at peak, +436.4% YoY. Another India-native brand built specifically for the cricket bettor profile.
- 4RABET was the most consistent performer through the season, actually gaining from March to May (8.93% → 9.88%) — the only major brand to grow its share as the tournament progressed.
The Jan–Aug 2025 cumulative picture:
| Brand | BAP | APS | CEB (USD) | YoY |
|---|---|---|---|---|
| Stake | 13.59% | 1.66M | $449.66M | −2.2% |
| 4RABET | 10.1% | 1.22M | $266.58M | +132.7% |
| Winmatch | 8.76% | 1.07M | $241.42M | +828.7% |
| Dafabet | 8.26% | 1.01M | $316.46M | −21.59% |
| Khelo24bet | 8.07% | 978.83K | $201.98M | +436.4% |
The structural shift: in 2024, the Indian market had a dominant global player (Stake) and a cluster of regional incumbents (Parimatch, Dafabet, 1xBet, 4RABET). By 2025, a new tier of India-native challengers had emerged, growing 4–8x year-over-year. These brands didn’t require an 80% first-time depositor campaign to acquire users — they were already positioned for the Indian cricket bettor by design.
The 2026 competitive landscape: Stake loses the top spot
IPL 2026 produced the most significant competitive reshuffle since Stake’s emergence in 2024. For the first time in three seasons, Stake did not rank in the top three.
India’s top five brands by cumulative Blask Index, IPL 2026 season (March 28 – May 31):
| Rank | Brand | Type |
|---|---|---|
| 1 | 4RABET | Offshore |
| 2 | Parimatch | Offshore |
| 3 | Dafabet | Offshore |
| 4 | Winmatch | Offshore |
| 5 | Stake | Offshore |
The shift reflects two converging forces. First, the overall market contracted: the 2026 season peak of 2.48M represented a 17% decline from the 2024–2025 highs of ~3.0M — the first reversal in the nine-year trend. In a shrinking pool, the brands that grew their share in 2025 (4RABET: +132.7% YoY, Winmatch: +828.7% YoY, Khelo24bet: +436.4% YoY) entered 2026 with structural positioning that offset the volume decline.
Second, Stake’s 2026 trajectory continued the gradual erosion visible through IPL 2025: from 20% BAP in March 2025 to 17.46% in May 2025, and now out of the top three entirely. The platform that captured 39.75% of the Indian market at its May 2024 peak has experienced two consecutive seasons of share loss. Whether that represents competitive displacement or deliberate de-prioritisation of the India market is not visible in demand data alone.
The broader signal: India’s iGaming market in 2026 no longer has a single dominant player. The field that was Stake plus regional challengers in 2024 has become a genuinely fragmented top five, with no brand holding an obviously commanding position.
What brands actually do with this window: the Stake 2024 case study
IPL 2024 remains the benchmark for single-tournament market capture. Understanding it explains both what’s replicable and what’s structural.
Stake entered 2024 with 1.27% BAP and a negligible Blask Index. Before IPL began, the platform made one structural decision: enable INR deposits — making Indian rupees the sixth fiat currency accepted, at a moment when competitors were retreating from India due to the 28% GST concern.
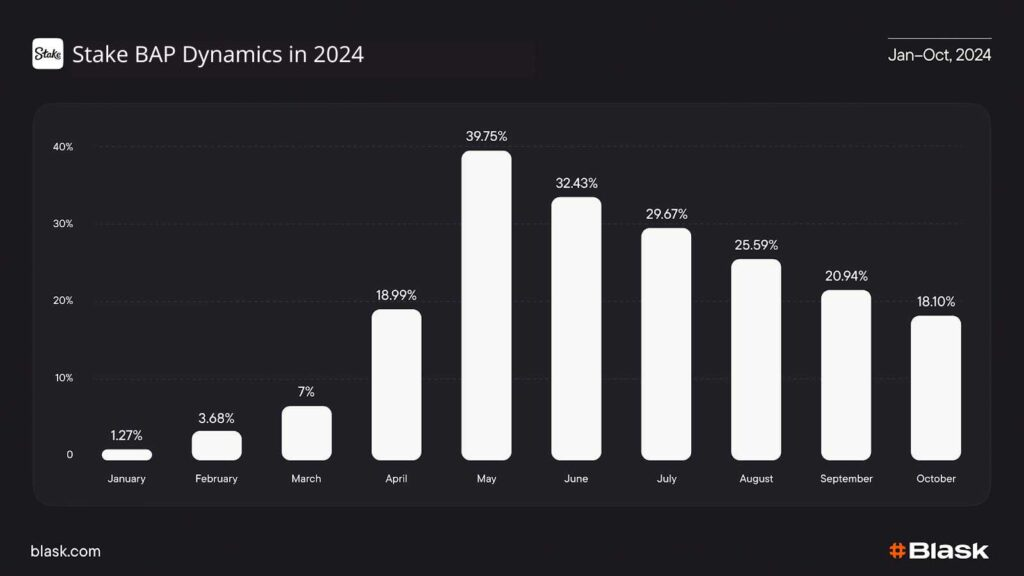
Then came the campaign. Stake paid out bettors as winners if their selected team hit a six in the first four overs — a mechanic that combined cricket’s most exciting moment with an immediate financial reward. The campaign paid out in 63% of selected matches. Over 80% of participants were first-time depositors.
| Month | Stake Blask Index | BAP |
|---|---|---|
| January 2024 | 339K | 1.27% |
| February 2024 | 974K | 3.68% |
| March 2024 | 2.7M | 7.0% |
| April 2024 | 10M | 18.99% |
| May 2024 (peak) | 25M | 39.75% |
| October 2024 | 6.5M | 18.10% |
From January to May: a 7,275% increase in Blask Index. A rise from 4th to 1st in competitive position. A peak APS of approximately 302,000 new depositors in April alone.
The October retention data is equally instructive: six months after IPL ended, Stake maintained 18% market share. The tournament was an acquisition window; the product and retention strategy determined how much of that acquisition survived into the following year. Stake’s 20% BAP at the start of IPL 2025 is a direct legacy of IPL 2024 retention.
Full analysis: Sports events as market catalysts, Stake’s growth in India during 2024
When IPL gets disrupted: the May 2025 suspension
On May 9, 2025, IPL was suspended due to military tensions between India and Pakistan — the first time in the tournament’s 18-year history that geopolitical events interrupted play. It resumed on May 17, with the final rescheduled to June 3.
From a market perspective, the suspension created a brief but visible dip in the Blask Index. The recovery, when play resumed, was incomplete — by the final day, the Index stood at 1.81M rather than the ~2.5M+ that would be typical for a finals week.
The event is worth understanding as a scenario for risk planning. India’s iGaming demand during IPL is not purely structural — it depends on matches actually being played and live betting markets being available. A two-week gap mid-tournament is enough to break a retention flywheel that took months to build.
The second disruption came after the season ended: in August 2025, India passed the Online Gaming Act, banning real-money games from domestic platforms. Platforms like Dream11, My11Circle, MPL, and Zupee suspended paid contests. While offshore operators like Stake remained accessible, the regulatory environment became meaningfully more complex in the second half of 2025.
What the ten-year trend says about 2027
Ten seasons of IPL data produce one reliable conclusion: the market that IPL activates every spring is larger than the one it activated the spring before. Opening-day demand has grown every year from 2017 to 2026 without exception — from 276K to 2.48M.
But 2026 introduced a qualification that didn’t exist before: opening-day records and season-peak records are no longer the same metric. The 2026 season peak of 2.48M is a record for opening day and simultaneously the lowest season peak since 2024. The first year-over-year decline in final-day demand in the dataset’s history arrived not from a catastrophic market event but from the absence of a pre-season cricket calendar.
Two structural factors will determine whether 2027 looks like 2025 or 2026.
The first is the pre-IPL cricket calendar. If Champions Trophy, a major bilateral series involving India, or a WPL equivalent precedes IPL 2027, the market will arrive pre-heated — and the season-peak figure should recover toward the 2.9–3.0M range. If the early-year calendar is thin, 2026’s pattern of front-loaded demand and continuous decline is likely to repeat.
The second is the regulatory trajectory under the Online Gaming Act. Implemented from October 2025, the Act constrained the domestic fantasy and skill-gaming segment without directly restricting offshore sports betting operators. Its medium-term effect on the total addressable market remains unclear: domestic platforms like Dream11 and MPL contributed meaningfully to the broader cricket-season demand environment, and their constrained state reduces the market’s aggregate ceiling.
The 2027 projection: if a major pre-IPL cricket event activates the market from February and the regulatory environment remains stable for offshore operators, opening-day demand above 2.5M is achievable and mid-season peaks approaching 3.2–3.5M are plausible. Without pre-season inventory, the 2026 pattern — a record opening day that is also the season ceiling — becomes the base case.
For operators: the question for 2027 is not whether to be in India during IPL. It is whether the activation plan accounts for the scenario where March 28 (or equivalent) is the last day the market is that large, not the first.
Key operational takeaways
- Activate before IPL, not at IPL. The pre-season cricket calendar (Champions Trophy, WPL) now drives 4–6 weeks of market rise before IPL begins. Brands that enter in February own the first wave; brands that enter in March are playing in a market others have already seeded. IPL 2026 demonstrated the downside: without pre-season inventory, the opening-day surge arrived and dissipated in 48 hours.
- Opening day is not the peak — but watch the Trends signal. In most years, the peak comes mid-tournament during marquee matchups. In 2025, the peak was front-loaded. Track Trends R/F Index daily: when it crosses into Fall territory, pivot from acquisition to retention immediately.
- Double-header days are premium inventory. When India’s most popular franchises play simultaneously, Blask Index spikes 20–40% above the tournament average. These days are knowable in advance from the fixture schedule.
- Design specifically for the Indian cricket bettor. Live markets, match-moment mechanics (over/under on individual overs, six-in-the-first-four-overs), UPI-native payment flows. Generic casino promotions underperform significantly against cricket-native activations in this market.
- The new competition is regional, not global. Stake, Parimatch, and Dafabet remain significant — but Winmatch (+828% YoY), Khelo24bet (+436% YoY), and 4RABET (+132% YoY) represent a different category of competitor: India-native brands built for this exact player profile. Their growth trajectory in 2025 signals a market that is starting to develop local champions.
- Retain before the next tournament. Stake’s 20% BAP entering IPL 2025 was the payoff from its 2024 retention strategy. The brands that won IPL 2025 carried a structural advantage into 2026 — as 4RABET and Winmatch’s rankings confirm.
- Monitor the pre-IPL calendar as a leading indicator of season shape. In years with Champions Trophy or WPL preceding IPL, demand builds over weeks and peaks mid-tournament. In years without comparable inventory (2026), opening day is the ceiling. This distinction is now the most important variable in India market planning.