- Updated:
- Published:
Casino brand visibility metrics: what they measure and why they matter
The way to measure casino brand strength before revenue reports arrive — and what Brazil’s 2025 numbers reveal about who’s actually winning a newly regulated market.
Brazil’s regulated gambling market officially launched on January 1, 2025. Within months, 519 active brands were competing for the same players. The license count tells you nothing about who was winning. Casino brand visibility metrics do.
Brand visibility in iGaming is not about advertising spend or share of voice. It’s about behavioral demand — the search activity players generate when they’re ready to play. The aggregate of those signals, across every brand in a market, creates a real-time picture of where player attention is flowing and how fast competitive positions are shifting. That picture arrives months before any revenue report can confirm it.
What casino brand visibility actually measures
When a player searches for a specific casino brand, that action reflects intent. They’re not browsing. They’re deciding which platform to use next. The accumulated volume of those decisions, compared across all brands in a market, is the raw material of brand visibility data.
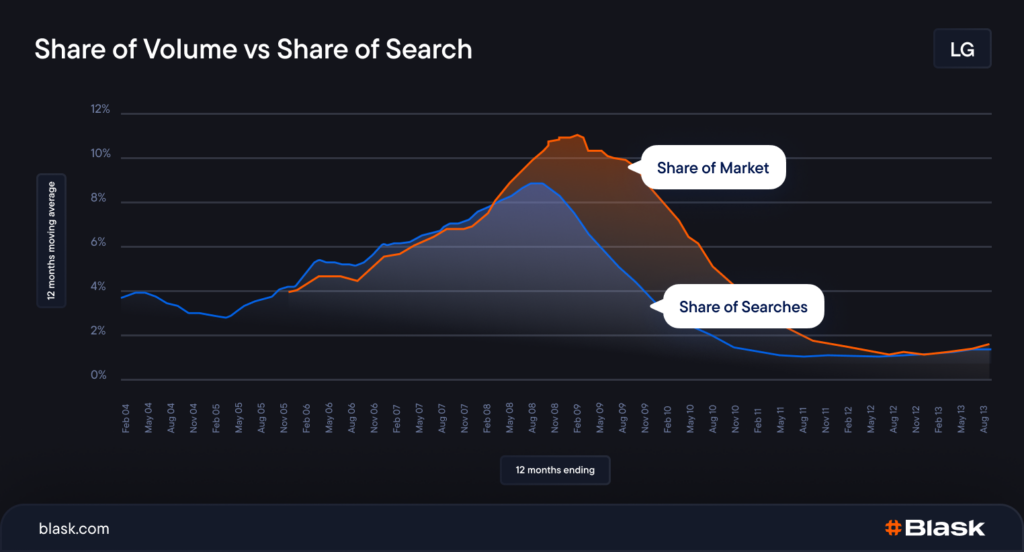
This is categorically different from advertising metrics. Share of voice measures what a brand spends to reach players. Brand visibility measures what players do without any prompt — their active, unpaid searches expressing genuine acquisition intent. The two signals diverge regularly, and the divergence is where the intelligence lives.
A brand can be everywhere on television and show weak visibility data, because players are searching for competitors instead. A brand with a modest media budget can show strong and growing visibility data, because players are actively looking for it. Revenue follows the second signal, not the first.
In gambling specifically, the correlation between search-based brand demand and actual market share runs at around 95% — above hospitality, above automotive, one of the highest rates across any studied industry. The research-before-registration pattern in gambling makes search behavior an unusually clean proxy for acquisition intent.
The metrics that track it
Blask measures casino brand visibility through four interconnected signals.
Blask Index is the foundational demand signal. It’s derived from Google Keyword Planner and Google Trends data, processed to filter for positive acquisition intent — genuine player searches, not complaint spikes or media-driven noise. Blask Index measures how much real demand a brand generates in a given market. It’s a leading indicator: demand moves before revenue moves.
Brand Accumulated Power (BAP) converts the Blask Index into a market share figure. It’s each brand’s percentage of total player demand in a country during a given period. BAP normalizes across time, making it possible to track whether a brand is gaining or losing ground even as the market itself grows. In a 500-brand market, a brand at 21% BAP and another at 10% BAP are not in the same competitive position even if their revenue looks similar — and BAP shows the gap.
Acquisition Power Score (APS) translates visibility into a customer acquisition benchmark. It estimates how many new customers a brand’s market position implies it should be attracting in a given period. APS is always expressed as a min–avg–max range: player acquisition varies with seasonal patterns, campaign timing, and competitive intensity. The range is not an error margin — it shows the realistic floor and ceiling given current brand strength.
Competitive Earning Baseline (CEB) is the revenue expression of brand visibility. It estimates what a brand should be earning based on its demand signal and competitive position in a market — not from operator-reported financials, but from behavioral signals. Like APS, CEB is a range (min–avg–max): different competitive scenarios produce different revenue outcomes from the same demand base. CEB tells operators whether they’re capturing what their visibility implies they should be earning, or leaving it on the table.
Brazil 2025: visibility in a market just opened
Brazil is the sharpest test case for what casino brand visibility metrics actually show. The regulated fixed-odds betting market launched January 1, 2025. The full-year 2025 Blask data covers the entire first regulated calendar year: 519 active brands, 2.57 billion Blask Index units, $5.09B CEB ($3.41B–$10.1B), and 79.2M APS (58.1M–142.6M range).

These are not the numbers of a small market. Brazil’s total Blask Index in 2025 was more than four times larger than the UK’s — 2.57B versus 586.7M.
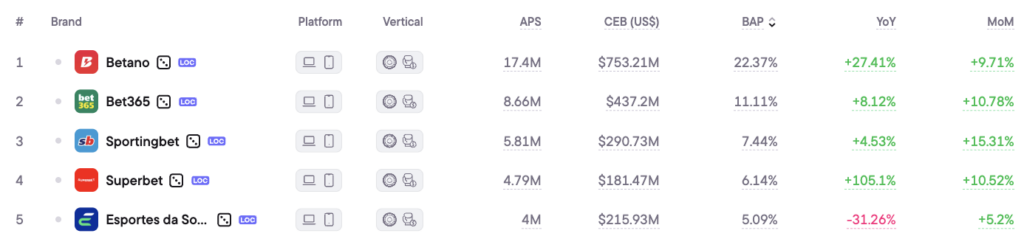
Here is how demand was distributed across the top nine brands:
| Brand | BAP | YoY demand | APS avg | CEB avg |
|---|---|---|---|---|
| Betano | 21.75% | +21.13% | 16.3M | $713M |
| Bet365 | 10.90% | –4.16% | 8.2M | $423M |
| Sportingbet | 7.80% | +12.22% | 5.9M | $291M |
| Esportes da Sorte | 5.76% | –20.44% | 4.4M | $231M |
| Superbet | 5.50% | +109.19% | 4.1M | $161M |
| Betnacional | 4.97% | –8.23% | 3.8M | $195M |
| 7Games | 4.27% | +21.69% | 3.2M | $140M |
| EstrelaBet | 2.41% | +5.33% | 1.8M | $93M |
| Vaidebet | 2.26% | –8.71% | 1.7M | $81M |
Source: Blask, Brazil, January–December 2025. APS and CEB shown as averages. CEB ranges: Betano $535M–$1.25B; Bet365 $317M–$741M; Sportingbet $218M–$509M.
The top nine brands together held 65.6% of all measurable player demand. The other 510 active brands shared the remaining third.
What the numbers reveal
Betano is not just winning — it’s widening the gap. At 21.75% BAP and growing 21.13% year over year, Betano holds more than twice the demand share of the #2 brand. The brand arrived in Brazil in 2021 and built local equity through major club sponsorships and continuous product investment before the regulated market opened. When regulation arrived, the demand base was already there.
Bet365 is the most instructive case. The world’s largest gambling brand by global reach, it entered Brazil in 2016. On January 1, 2025, it held 10.90% BAP — the second-highest in the market. But through 2025 it lost 4.16% of its Blask Index year over year, while the market itself was growing. Bet365’s share of total player demand contracted even as new players flooded in. A global reputation is not the same as local brand demand. The data separates the two.
Superbet doubled. The brand launched in Brazil in September 2023 and entered 2025 with a meaningful but not dominant position. By the end of the year it had grown its Blask Index by 109.19%, moving to 5.50% BAP. Its CEB of $161M ($120M–$281M range) shows the revenue picture has not yet fully caught up with the demand signal — which is precisely how BAP functions as a leading indicator. The revenue will follow.
Esportes da Sorte fell 20.44%. A Brazilian-native brand that was an early mover in the unregulated period, it lost more demand share than any other top-ten operator in 2025. In a growing market, that requires real effort to achieve — the brand was actively outrun by competitors at every tier.
What visibility gaps cost in a new market
A newly regulated market creates an unusual pressure pattern. The total available demand is growing rapidly as new players enter the licensed ecosystem. Brands that grow their visibility at least as fast as the market are holding share. Brands that grow slower than the market are losing it — even if their absolute Blask Index numbers are rising.
Brazil’s total Blask Index grew significantly through 2025 as regulation brought previously informal gambling activity into the licensed market. Against that backdrop, Bet365’s –4.16% Blask Index decline is not a minor data point. It means the brand captured essentially none of the new regulated demand — while Betano, Superbet, and 7Games absorbed it.
The CEB figures translate the visibility gap into revenue terms. Betano’s CEB of $713M ($535M–$1.25B) against Bet365’s $423M ($317M–$741M) reflects a gap that compounds over time as BAP diverges. A brand building visibility in year one of regulation is not just winning that year. It’s establishing the demand baseline that acquisition and retention will be measured against for the next five years.
How to use visibility metrics in practice
Casino brand visibility metrics answer specific operational questions.
Are we growing with the market or falling behind it? Absolute Blask Index growth is insufficient. The question is whether BAP is stable, rising, or eroding. A brand growing at 10% YoY in a market growing at 25% is losing relative position.
Who is moving fastest? Superbet’s +109% and 7Games’ +21.69% both appeared in Blask data months before any public reporting covered these brands’ Brazilian trajectories. Tracking competitor BAP trends monthly provides early warning of which challengers are building real acquisition capacity.
What does my visibility imply about revenue? CEB benchmarks provide a sanity check. If a brand’s actual GGR runs significantly below its CEB, the gap usually traces back to monetization efficiency rather than demand. If CEB is rising but GGR is flat, the brand has a conversion problem, not a visibility problem.
The bottom line
Casino brand visibility metrics measure what revenue reports miss: which brands players are actively choosing before they deposit, how that attention is distributed across a competitive market, and whether individual brands are building or losing their share.
In Brazil’s first regulated year, the data answered those questions clearly. Betano built real demand. Superbet built it fast. Bet365 — a brand operating in Brazil since 2016 — watched its share contract while the market grew around it. None of that required waiting for annual reports. It was visible in the Blask Index from the first quarter of regulation.
In any newly regulated market, and in every mature one, that gap between when visibility data tells you something and when financial data confirms it is where competitive advantage lives.