- Updated:
- Published:
Beyond borders: turning global events into iGaming gold
Global headline events — the Super Bowl, FIFA World Cup, the Summer Olympics, The International — concentrate more betting intent in a single night than many operators see all quarter.
Blask’s data show that when a market-wide surge is paired with precision segmentation, brands harvest two-to-three-digit lifts in FTDs and GGR without adding media budget. Blask playbooks plugs every Blask module into the event cycle: from spotting the next spike to grading the cash-flow impact afterward.
Find the biggest spikes with daily+hourly Blask Index
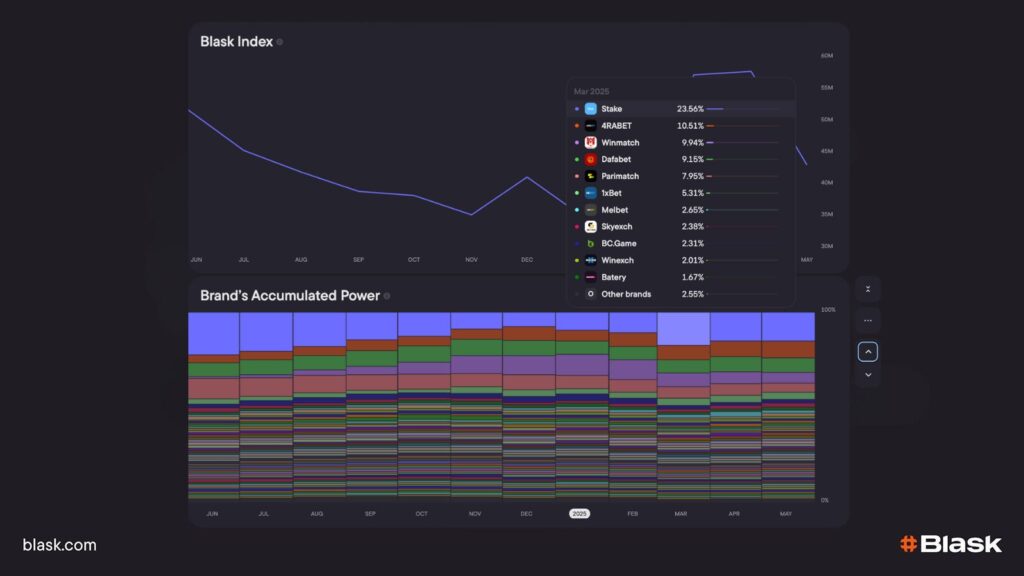
Blask Index converts raw Google-query volume for every brand, game and country into a single Interest score.
- Hourly live view — refreshes every 60 minutes, pinpointing the exact 15-minute pocket when a market goes hot. Because the Index is normalised for seasonality and total search traffic, peaks are instantly comparable across years, sports and geographies.
- Daily view (back to 2017) — ideal for spotting historic “magnet” fixtures.
📖 Read more: What is Blask Index?
| Country | Record daily peak | Magnet event | Take-away |
|---|---|---|---|
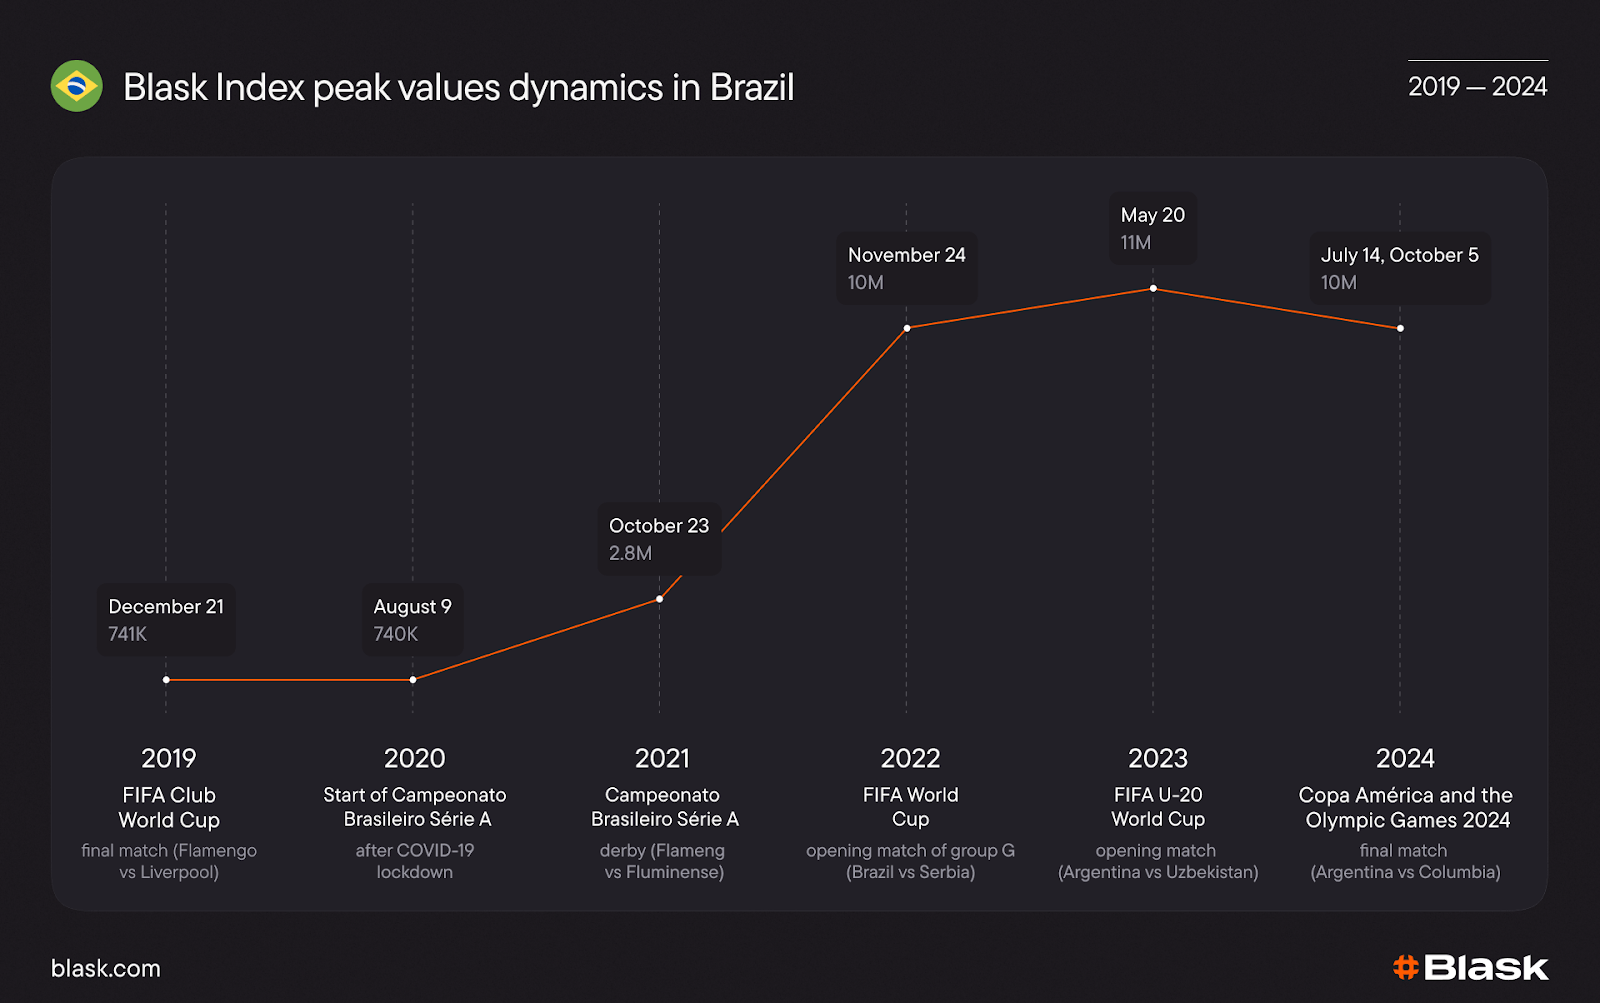
| Brazil | 10 M Index points on WC 2022 group-stage opener | Brazil vs Serbia | World-Cup matches dwarf even Flamengo-Flu derbies. |
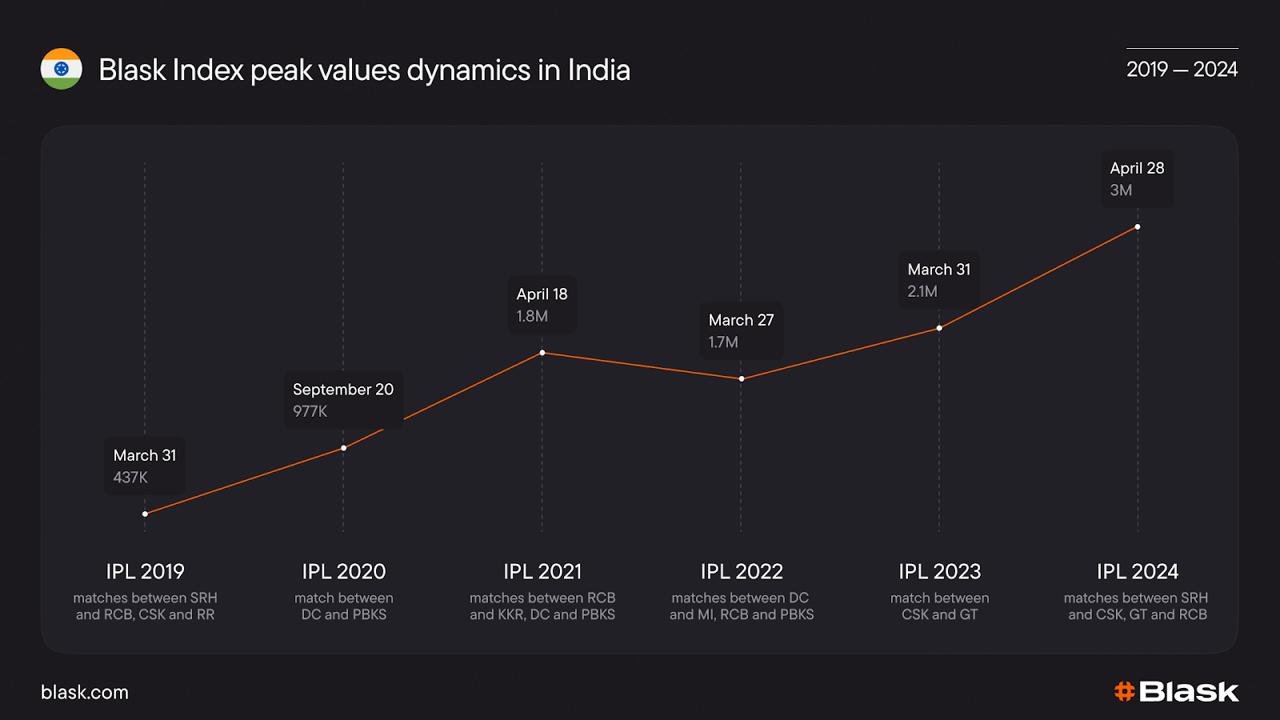
| India | 3 M Index points on mid-table IPL double-header (Apr 2024) | IPL | Spikes grow every season and cluster on double-headers, not on the opener or final. |
| Global | Olympics handle tripled for Flutter brands at Paris 2024 | Olympics | Basketball & athletics drive cross-market volume despite fragmented schedules. |
Open the daily Index curve for your target country, grab the five tallest needles, tag them to their fixtures, and drop those dates into your “Magnet Calendar.”
On campaign day, switch to the hourly view: the steepest minute-by-minute ramp shows exactly when to launch flash odds, push messages or influencer calls-to-action.
Check if the surge repeats every year.
Scrolling year-by-year confirms whether an event is a one-off or a perennial cash machine. The IPL has topped India’s Index six seasons running; FIFA and Copa América rotate through Brazil, but football is always the magnet. Knowing this lets you pre-book influencers, servers and KYC staff months ahead.
See which rival milked the spike — and why
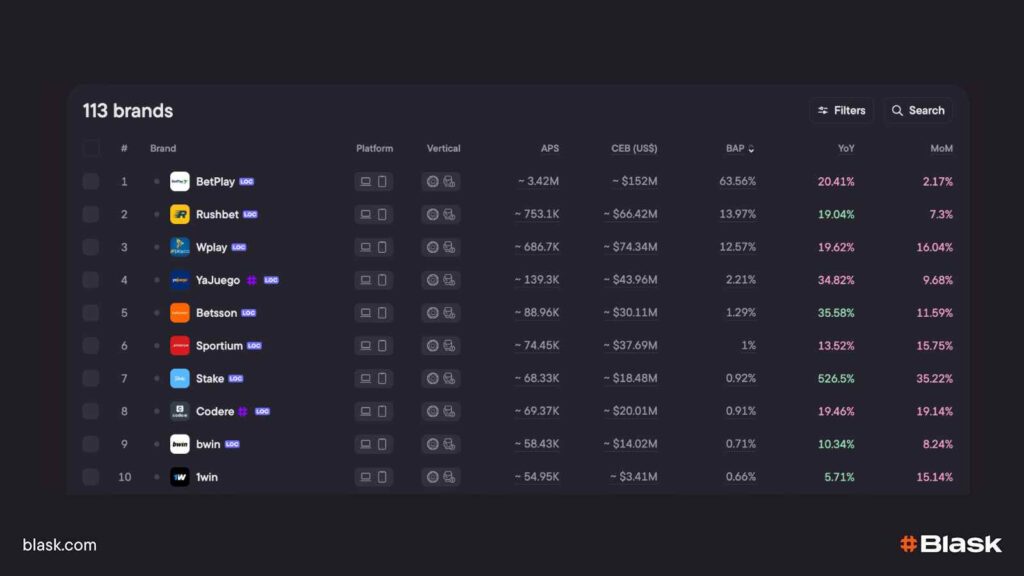
Open the Country › Brands table.
Click the flag in Countries to land on the full operator list.
Sort by BAP (Brand’s Accumulated Power) — Blask’s hour-level score that fuses the live Blask Index with sustained brand visibility and competitive crowding — to see who owned the greatest share of attention during the surge.
📖 Read more: BAP is all you need
Hover any row to replay that brand’s hourly Index curve in the side-panel and spot the exact moment their campaign bent the line.
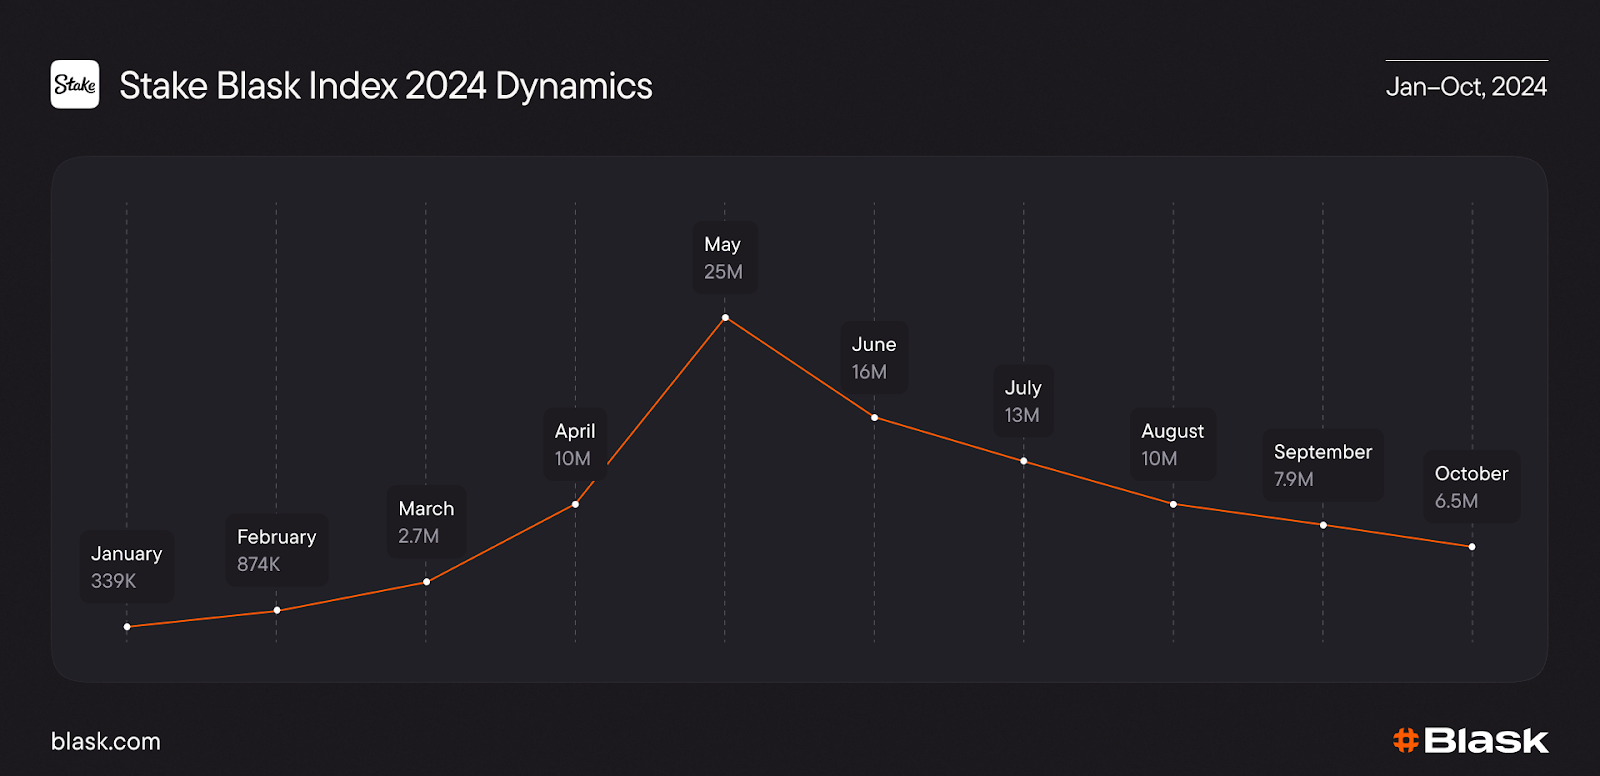
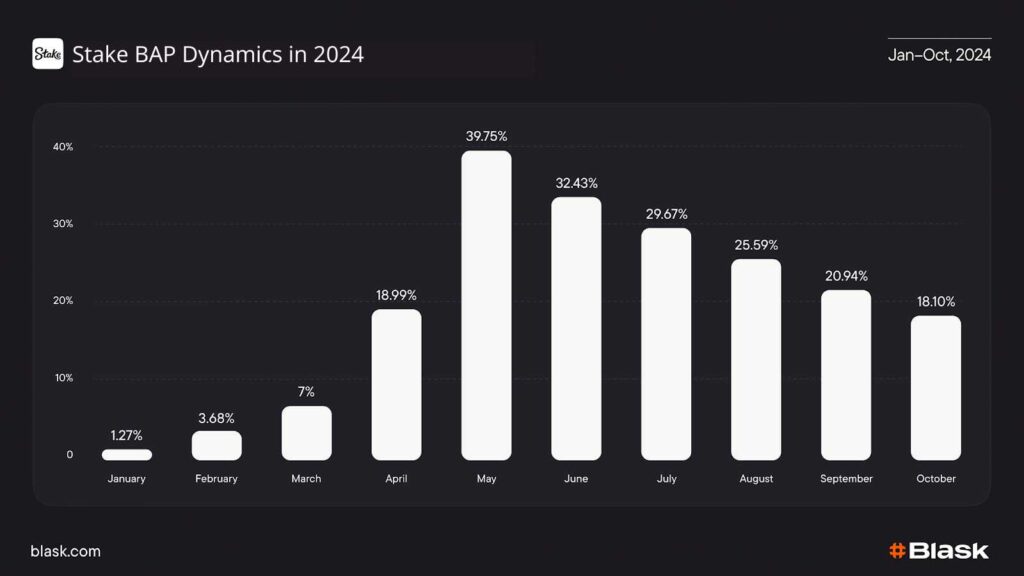
💡 Example — Stake in India, IPL 2024.
Stake: during IPL 2024, the curve leapt 2.7M → 25M after the “Early Six, You Win” promo plus INR deposits, lifting Stake’s Relative Market Share near 40%.
Compare and copy.
If their vertical leap beats yours while pre-spike BAP is roughly equal, the gap is funnel execution: odds-boost moment, bonus clarity, or lobby seat — not media weight.
Note the exact hour their line inflects, inspect the corresponding creative in your ad-library feed, then iterate: mirror the mechanic, tighten the call-to-action, and aim it at the next Index peak.
Aim the right offer at the right cohort.
Blask’s Customer Profile module converts more than 80 000 player surveys, regulatory filings and open-web behaviour signals into nine hard fields for every national audience: age band, income range, education level, employment status, career cluster, preferred product vertical, sports-betting motive, casino motive and first brand touch-point.
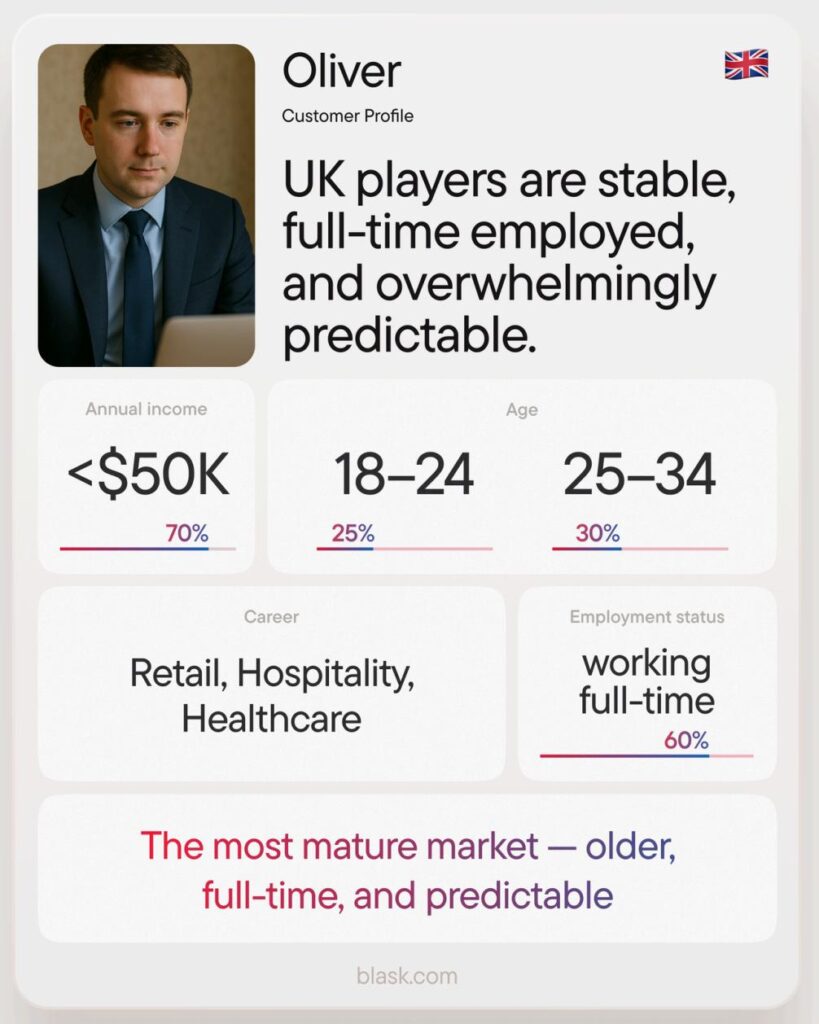


📖 Read more: What is Blask Customer Profile?
Open the Country view and stack those psychographic slices against the real-time business gauges that sit beside them:
- YoY / MoM Blask Index deltas – structural vs. tactical demand shifts.
- APS (Acquisition Power Score) – how many FTDs the market says your brand should capture.
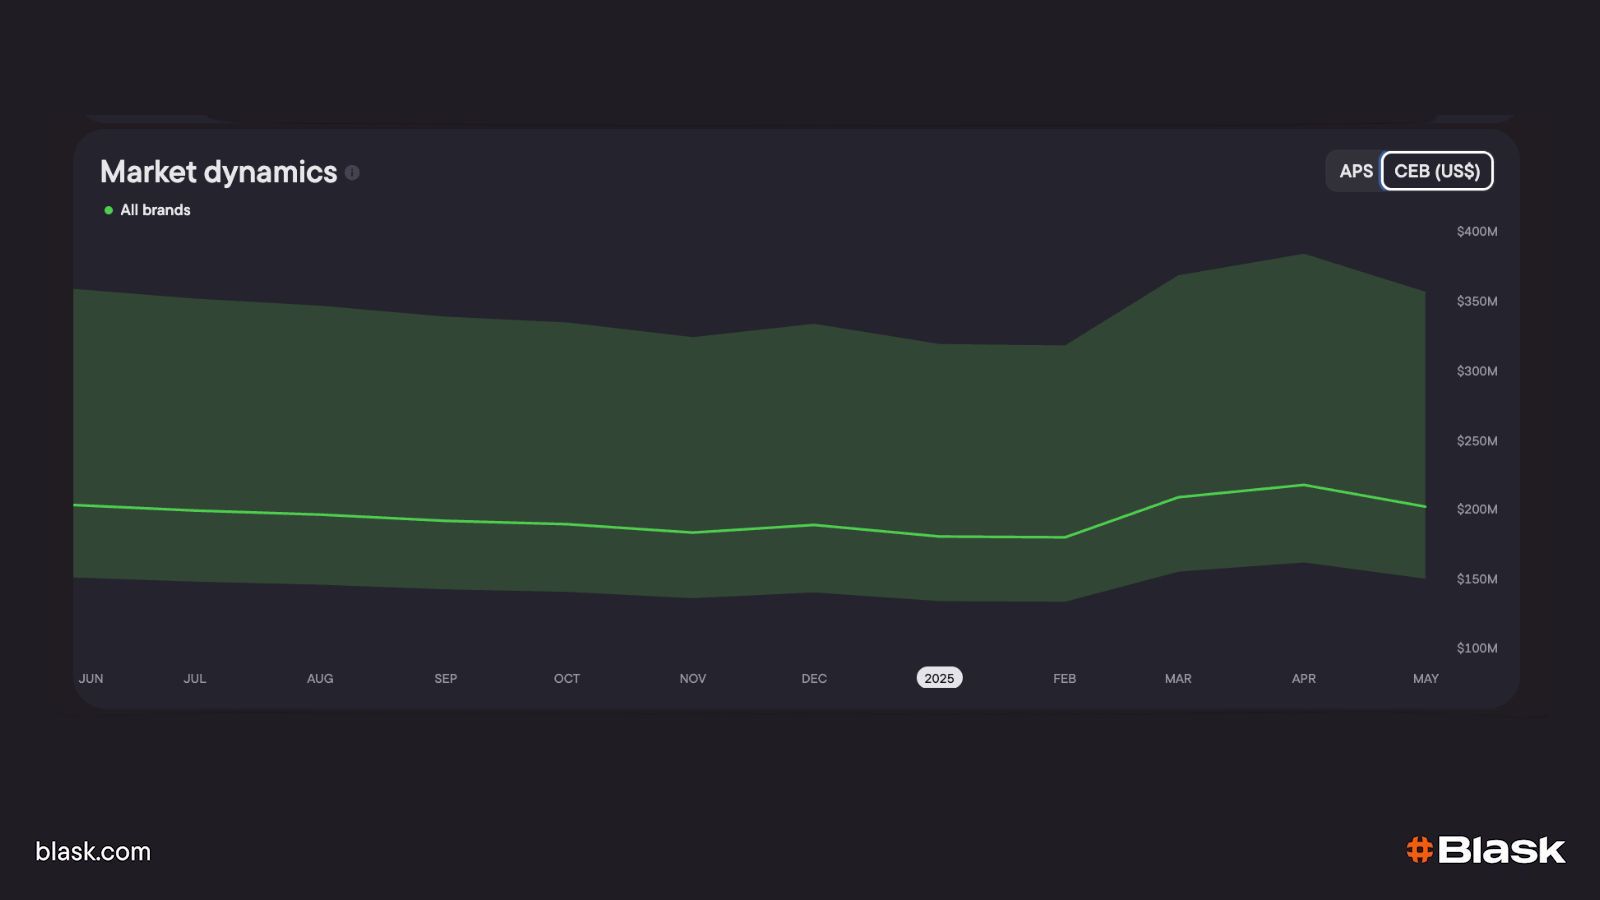
- CEB (Competitive Earning Baseline) – the USD revenue corridor a brand with your BAP and APS should hit.
- RG / regulation flags – which jurisdictions allow or restrict promotion levers.
How operators build laser cohorts in three clicks
- Filter markets by momentum – sort All-Metrics on YoY Index; pivot into high-growth locales (e.g., India +38%) and skip flat ones.
- Slice Customer Profile – within the chosen country tick, say, 25-34 yrs · mid-income · “Passion & Tribalism” football motive · YouTube first touch-point.
- Overlay risk & funnel capacity – exclude high RG-risk IDs, then eye APS/CEB to size the head-count and wallet ceiling that segment can realistically deliver next month.
Now your push lands only on users who want football odds, can deposit mid-stakes, discover brands on YouTube and sit inside a market whose macro signals prove the spend is worth chasing.
Result: bonus wastage drops, BAP climbs, and next month’s APS/CEB refresh shows whether the cohort really moved the GGR needle — all without a single guess.
Trigger offers at the exact hour — and in the right lobby seat.
Blask gives you two live-fire sights for timing:
| Live signal | What it shows | How to act right now |
|---|---|---|
| Hourly Index (+ BAP overlay) | A fresh country-level Index print every 30 min (twice an hour). BAP weights that pulse by current visibility, so you see whether attention is compounding or leaking in real time. | Check the heat map: • UK — curve crests consistently at 00 UTC (01 BST). • Germany — top at 00 UTC (02 CEST). • France — within the same 15-min pocket. Drop flash odds / push codes inside that window; the very next BAP refresh (half an hour later) will tell you if the blast cut through. |
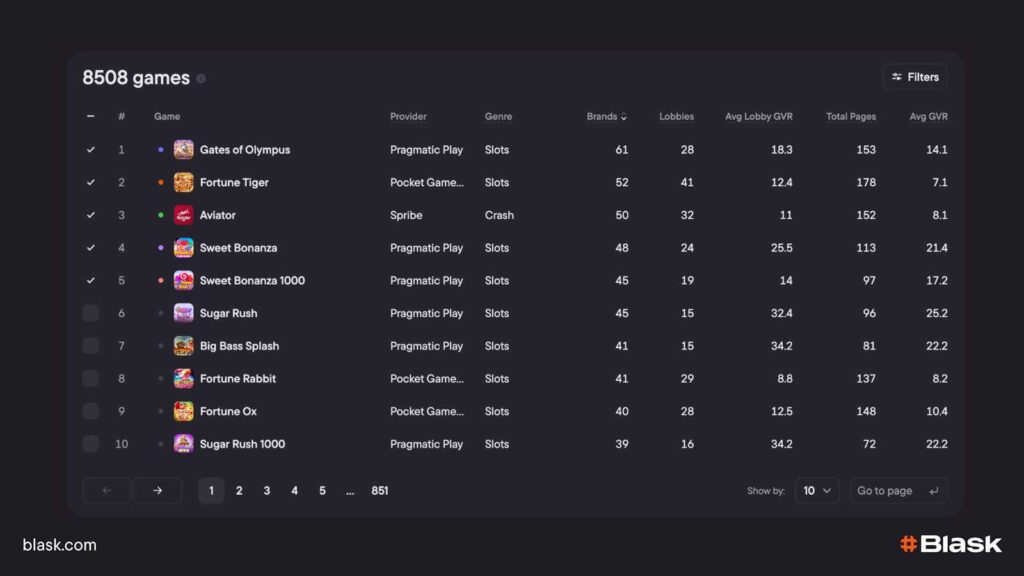
| GVR (Game Visibility Rank) | A computer-vision engine screenshots every lobby nightly, recognises 10 000+ game logos, numbers the first 100 tiles top-left → bottom-right, and stores that seat number. The result: a metric, that detects every game every day. | Campaign only counts if the promoted title sits seat 1-10 when the push lands. Anything buried beyond row 2 misses ≈ 95% of clicks. • Monday morning: did the weekend banner move your slot from seat 23 → 4? • Sort GVR by provider: if a premium studio shows zero titles in the top-20, you have leverage for the next rev-share negotiation. |
🔗 Deep dive: Inside Blask’s Lobby-Position engine
Put it together
- Open the Blask Index for your market; identify the next cresting block (it updates twice an hour, so you’re never guessing more than 30 minutes ahead).
- Confirm GVR for the game you’ll highlight — it must already be in minimum seats (move it manually if needed).
- Fire the offer — flash odds, bonus code, influencer shout-out — right inside that cresting quarter-hour.
- Watch BAP in the subsequent refresh; a rising green bar tells you the timing + lobby seat combo worked, long before revenue tallies arrive.
Watch BAP climb live — then grade the whole sprint with APS & CEB.
Blask updates Brand’s Accumulated Power (BAP) every 60 minutes, fusing each brand’s hour-by-hour Blask Index curve with its current visibility footprint. The result is a live bar chart that tells you, in near-real time, whether the audience you just paid to attract is actually compounding into lasting share of attention.
While the promo is running open the BAP widget beside your campaign dashboard. Two hourly refreshes are usually enough to see movement. You can fix creative, placement or pricing before you burn an entire match-day budget — something traditional next-day dashboards simply cannot do.
Post-event: validate with Blask’s two monthly benchmarks
Blask drops its Acquisition Power Score (APS) and Competitive Earning Baseline (CEB) on the 10-th of every month, covering the previous calendar month.
APS models how many first-time depositors your brand should have converted from the Index curve and social buzz; CEB converts that funnel potential plus BAP and macro factors into a realistic USD GGR range.
| What to compare | If you land in the red band | Typical fixes |
|---|---|---|
| Internal FTDs → APS | Funnel leak — interest didn’t turn into sign-ups | Strip KYC friction; clarify bonus Ts&Cs; localise payment rails |
| Actual GGR → CEB | Monetisation leak — players didn’t spend to model | Tighten cross-sell paths; boost retention triggers; add higher-margin verticals |

APS in India
CEB in India
Conclusion
Global headline events hold a few brief hours of ultra-concentrated betting demand. Operators that can (1) spot the surge, (2) target the right cohort, (3) verify game visibility, and (4) audit the funnel with APS / CEB turn that hype into permanent BAP gains.
Blask’s end-to-end stack—hourly Index + BAP (signal), Customer Profile (audience), GVR (exposure), and APS/CEB (P&L reality-check) — puts the entire “signal → action → profit” loop on one screen.