
- Updated:
- Published:
Macro-dynamics: how to measure movement, beyond noise
Or How Blask Index Trends turns motion into meaning.
TL;DR
Blask Index Trends turns a single Blask Index chart into decisions. It splits the curve into clear Rise/Fall/Flat segments, shows a clean Trend with mean and median as baselines, and scores the strength of each move with a Growth Index (-100 to +100). In one glance you get: the regime you’re in, how hard the market is pushing, and the context to act.
We present Segments, to show automatic Rise / Fall / Flat so you read market cycles, not wiggles. Baselines of Trend + AVG + MED for a fair, stable reference and the Growth Index with a strength score per segment; ~0-10 = drift, 10-30 = move, 30-60 = strong, 60-100 = breakout.
Trend well above baselines in a rising segment = real momentum; pulling back toward baselines = cooling. Use it for time campaigns, rotate budgets, spot inflection points, compare countries/brands apples-to-apples.
Turning motion into meaning
A single line chart is honest but dumb. It shows where the market went, not how hard it pushed — and it hides the regime shifts that actually matter for decisions.
Blask Index Trends (Macro-Dynamics) upgrades the Blask Index with three layers:
- Segments: automatic detection of Rise / Fall / Flat regimes.
- Baselines: Trend (smoothed path), mean (AVG) and a robust median (MED).
- Growth Index — a unitless –100…+100 score per segment that preserves direction and encodes magnitude.
Together, they answer three executive questions in one glance: what regime are we in; how strong is the push; relative to what baseline.
From one curve to segments
We split the series into monotonic segments (rise/fall/flat) using change-point detection; think PELT-style penalized segmentation that’s fast, scalable, and widely used in time-series science. You get objectively defined windows where the market is actually pushing one way, not just vibrating.
Why it matters: decisions ride regimes, not points. Campaign timing, budget rotation & allocation, and competitive reads are all regime problems.
Three baselines, one truth
Trend is a smoothed trajectory (e.g., spline/Hodrick-Prescott-like smoothing) that strips short-term noise but keeps the macro-shape. Think of the raw Blask Index like a bumpy road. Trend is what you’d see if your car’s suspension filtered out the potholes: you still follow the same route, but without every tiny jolt. An HP (Hodrick–Prescott) filter is one classic way to do this: it picks a curve that stays close to the data while penalizing wiggles; the λ knob controls how stiff the “suspension” is – bigger λ = smoother line (less twitchy). Typical rules of thumb are about 100 for annual, 1600 for quarterly, and 129,600 for monthly data, which scale smoothing to how frequently we sample the series.
We say HP-like because the idea (remove short-term noise, keep the backbone) can be done with HP or other smoothers (splines, Baxter-King, Christiano-Fitzgerald, etc.); the user experience is the same: a stable path you can reason about.
Two kid-level cautions so you don’t get tricked by the picture:
- Edge wobble: HP can misbehave at the very ends of the chart (the last few months can look too smooth or too jumpy). Don’t over-read the final inches without other signals
- Not a forecast tool: it’s a clean-up tool. We use it to see regimes; forecasting comes from models that also consider baselines, segments, and drivers
AVG is the period mean; perfect for comparability and the denominator in our Growth Index.
MED — the period median; same units, far more robust when a few wild months try to hijack the scale.
The Growth Index inside each segment
For any segment start→end we’re adding one more dimension: strength. Beyond showing whether the line is rising, falling, or flat, we label how hard the market is pushing relative to its usual level.
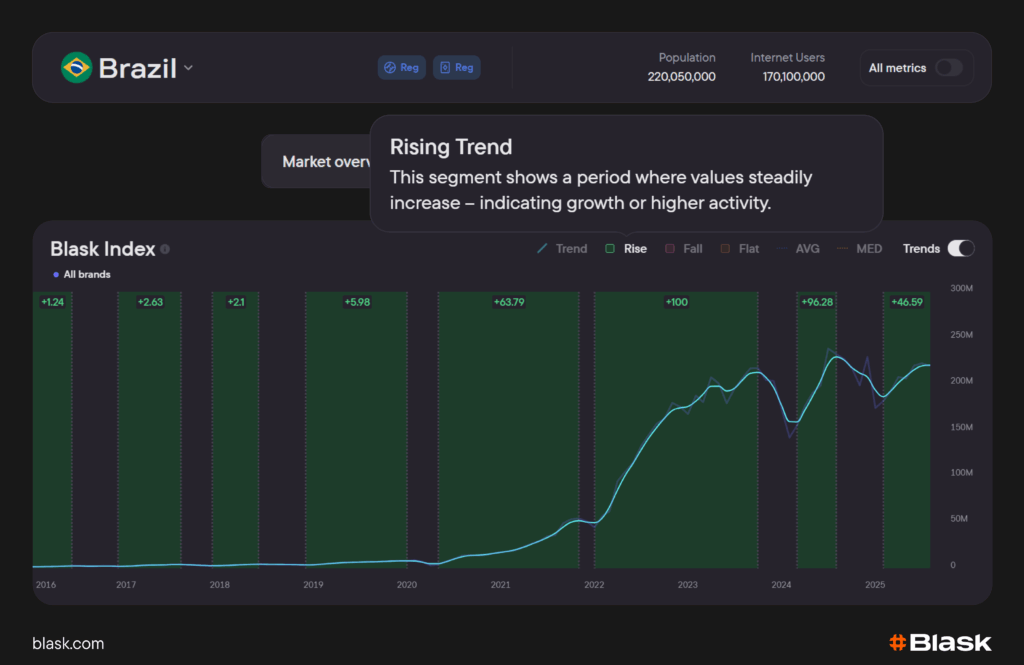
On Brazil, this reads cleanly: years of near-flat activity; then 2022 prints a breakout — the curve doesn’t just go up, it surges enough to earn a 100 (cap) badge. That badge means the move inside that green segment is at least as big as a typical period’s level of activity for Brazil — think sprint vs jog — not +100% from the start. 2024 comes close (another powerful impulse), while 2025 shows healthy, sustained climb but not a breakout.
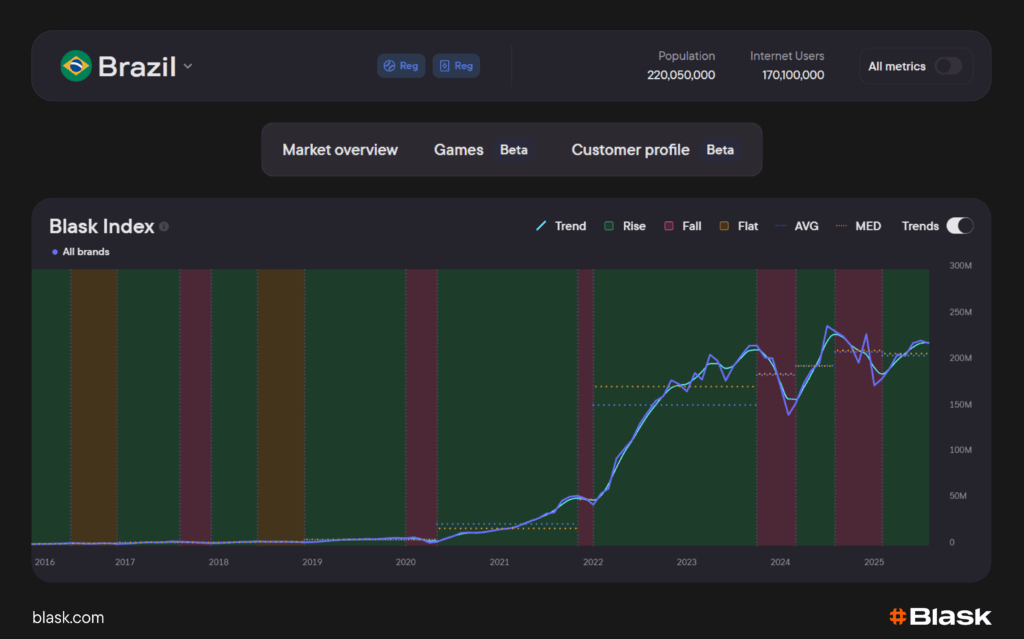
The dotted AVG and MED baselines act like the market’s resting heartbeat: when the smoothed Trend rides well above them through a rising segment, momentum is real; when it falls back toward them, heat is coming out of the system. In short: segments tell you direction, baselines give you context, and the breakout factor tells you the force behind the move.
Reading it:
- 0…±10: drift/noise
- ±10…±30: directional move
- ±30…±60: strong trend
- ±60…±100: breakout (hyper-growth or capitulation)
A +100 tag is a ceiling: the net move is at least one full period-mean — a verified regime break, not +100% from the start.
Where this sits in the history of brand measurement (and why it wins)
- Diffusion & S-curves: Bass (1969) explained how adoption compounds — the shape we often see when markets unlock. Macro-Dynamics shows when a market enters the steep part and how hard it pulls. (Of (im)possible interest, Wikipedia)
- Dirichlet & Double Jeopardy: most categories obey stable penetration/loyalty laws; big brands win twice. Detecting true regime shifts is how you separate structural change from noise and allocate for penetration growth. (Wikipedia, marketingscience.info)
- Long vs Short: effectiveness research is clear — brand building (long) and activation (short) work on different clocks. Regime/strength signals guide when to lean into each without arguing theology. (ipa.co.uk)
- Share-of-Search: search interest predicts market share months ahead; it’s a fast, cheap leading read of demand. Macro-Dynamics puts a governor on the hype by quantifying segment strength and anchoring it to baselines. (Blask, ipa.co.uk, WARC)
With the introduction of Macro Dynamics, Blask operationalizes 50 years of marketing science in one portable, regime-aware framework.