- Updated:
- Published:
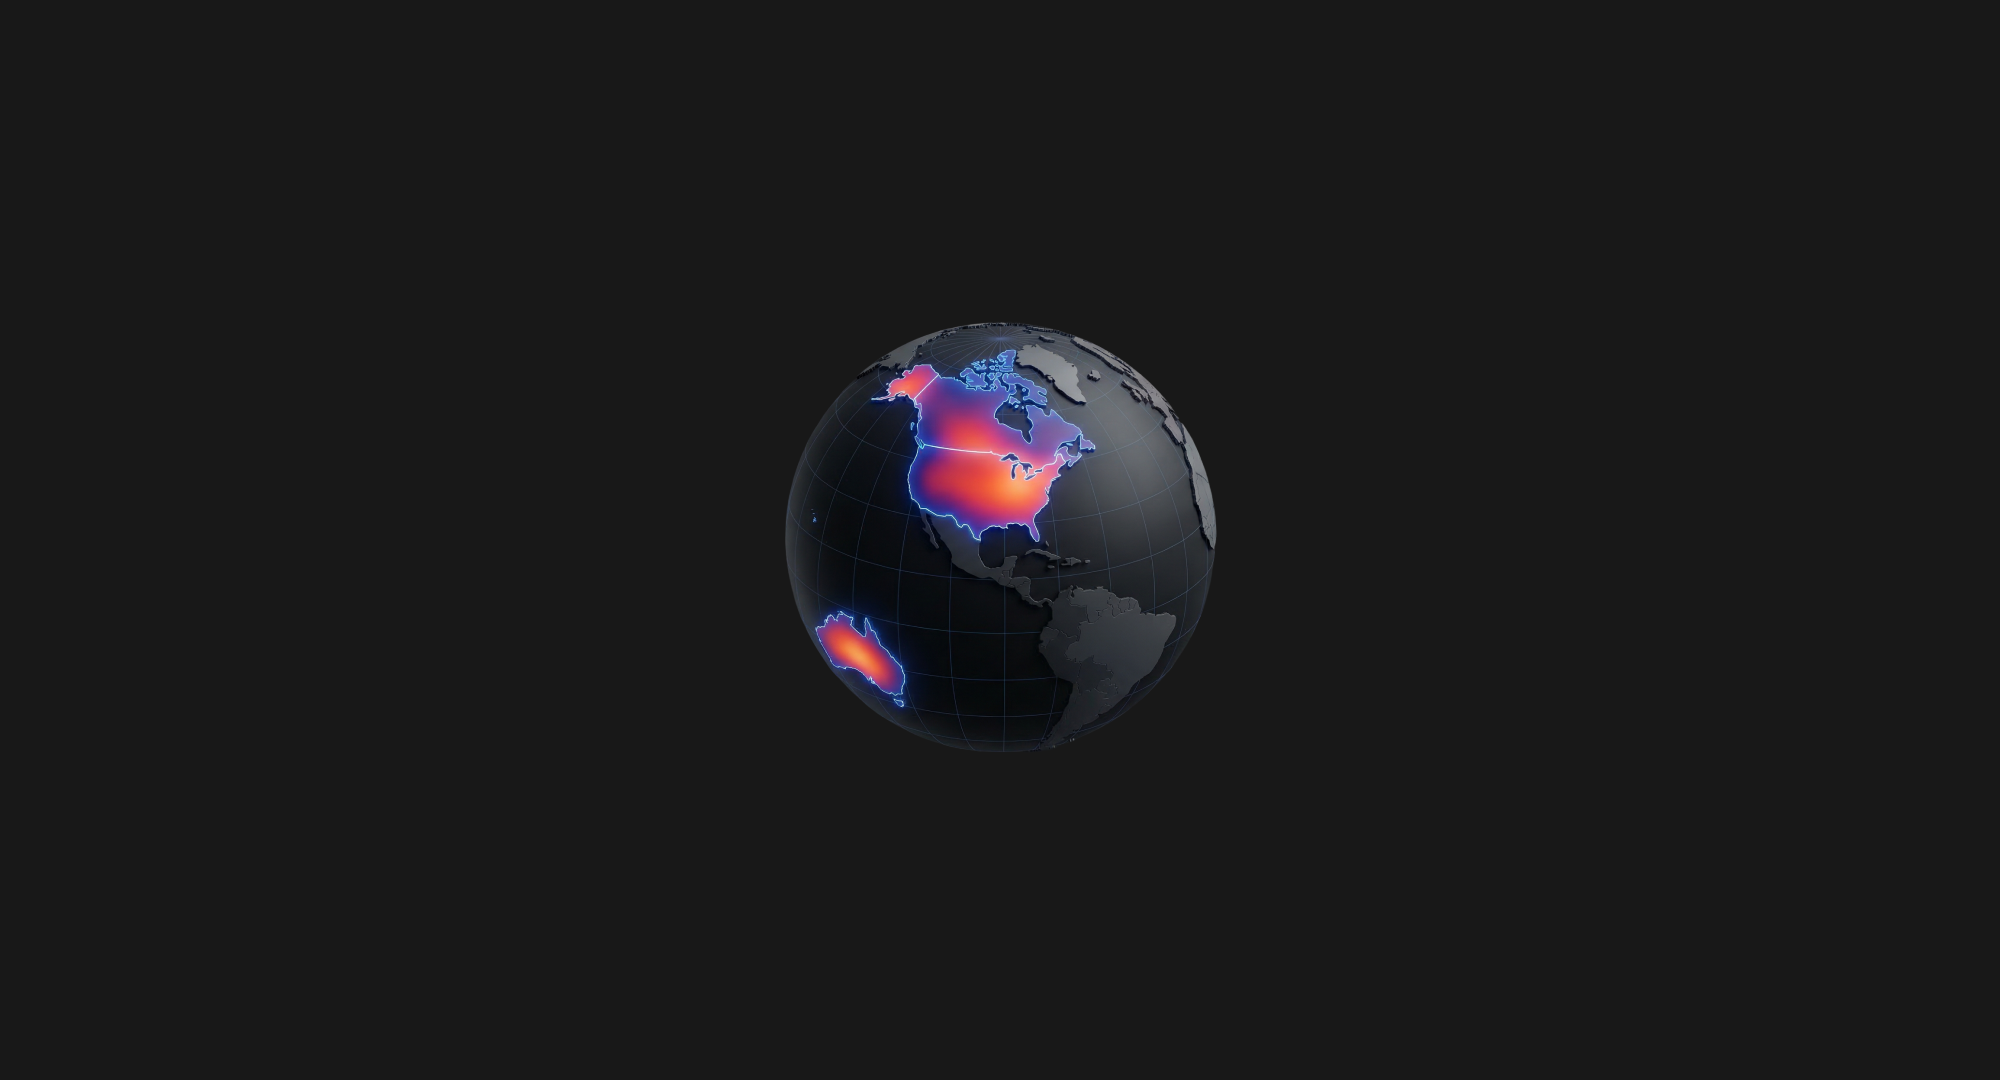
States drill-down: a quick tour of Blask’s sub-national analytics
Every U.S. state, Canadian province / territory and Australian state / territory — now with its own full Market Overview.
iGaming doesn’t operate at the national level. A brand dominating in New South Wales might be invisible in Queensland. A licensing shift in Alberta reshapes traffic patterns that will not show up in Canada-wide aggregates. And in the U.S., where regulation is a patchwork of 50 different realities, national averages obscure more than they reveal.
That’s why Blask now breaks down three major markets — the United States, Canada, and Australia — into individual state-, province- and territory-level views. Each sub-market gets the same analytical depth you’re used to at the country level: Blask Index, Brand’s Accumulated Power (BAP), Competitive Earning Baseline (CEB), year-over-year and month-over-month dynamics, brand rankings, and seasonality patterns.
No more guessing which state drives the national number. Let’s walk through the feature using Australia as our example.
Step 1. All countries — spotting the drill-down
Start where you always do: the All countries table.
Countries with state-level data now have an expand arrow next to their name. Click it, and the table unfolds to reveal every state or territory as a separate row — complete with its own Brands count, YoY/MoM growth, CEB, and regulatory status.
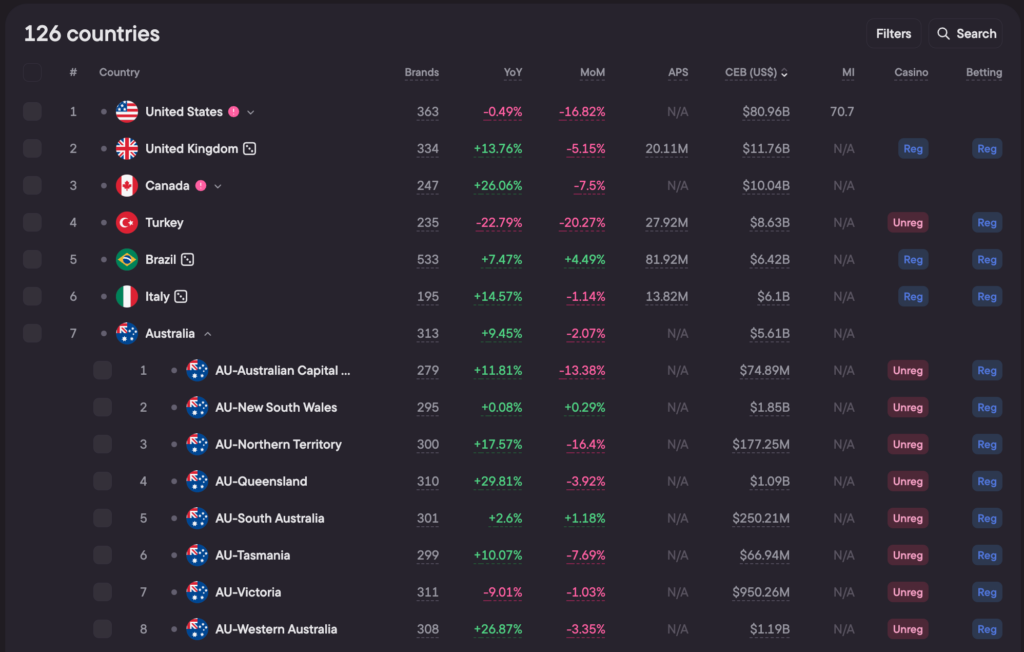
In Australia’s case, you’ll immediately see the variation that a single country-level row hides. Western Australia shows +26.87% YoY growth with $1.19B in CEB, while Victoria is contracting at -9.01% with $950.26M. Queensland is surging (+29.81% YoY), and Northern Territory — despite its tiny $177.25M CEB — is expanding at +17.57%.
Each state also displays its Casino and Betting regulation status. Online casinos are banned across all Australian states and territories — every row shows “Unreg” for Casino — while sports betting is regulated and licensed. That regulatory split is a defining feature of the market and a critical factor for anyone evaluating entry strategy.
Step 2. Country page — states overview
Navigate to the Australia country page and click on the States overview tab.
This section gives you three layers of insight. The Blask Index chart breaks down market activity by individual state — each state gets its own trend line, so you can track how demand shifts across territories over time.
The States Accumulated Power chart visualizes how demand is distributed between states as a stacked bar — making it easy to see which territories dominate the national picture and how that balance evolves month to month. Below both charts sits a sortable table with key metrics for all eight states: Brands, CEB, BAP, YoY, MoM, and regulatory status.
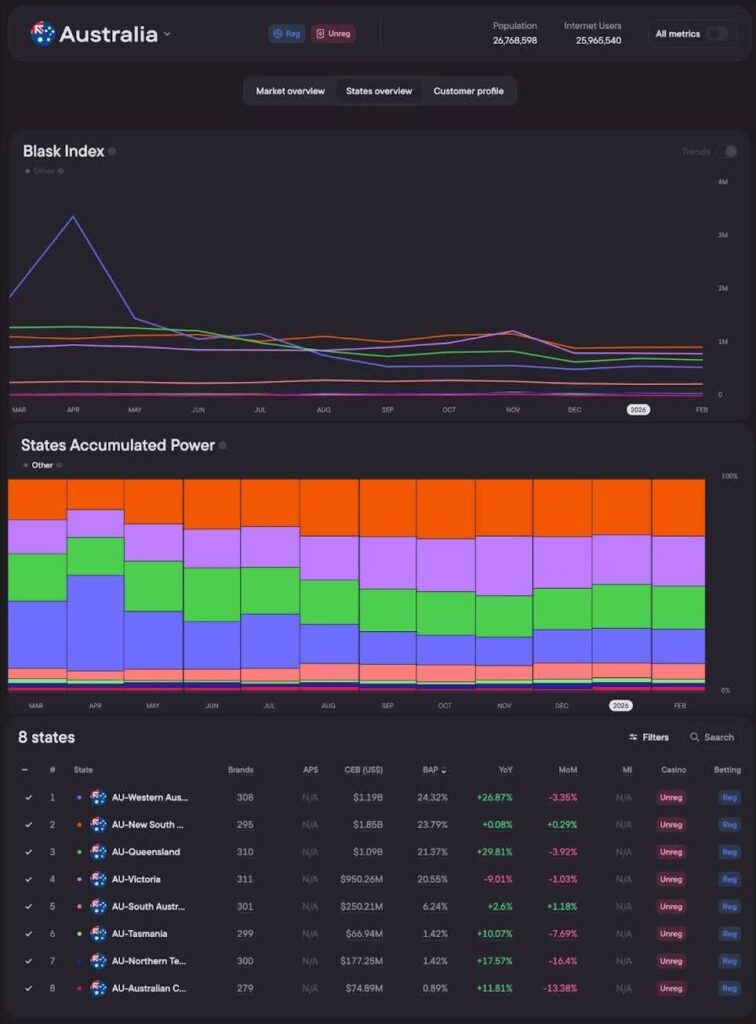
The table is sorted by BAP (Brand’s Accumulated Power) by default. Western Australia leads with 24.32% BAP and $1.19B CEB, followed by New South Wales (23.79%, $1.85B) and Queensland (21.37%, $1.09B).
Step 3. State page — full market overview
Click into any state — let’s take Western Australia — and you land on a dedicated Market Overview page that mirrors a full country view. This is where the real depth lives.
Blask Index
The Blask Index chart tracks market activity over time with Rise/Fall shading, trend lines, and AVG/MED benchmarks.
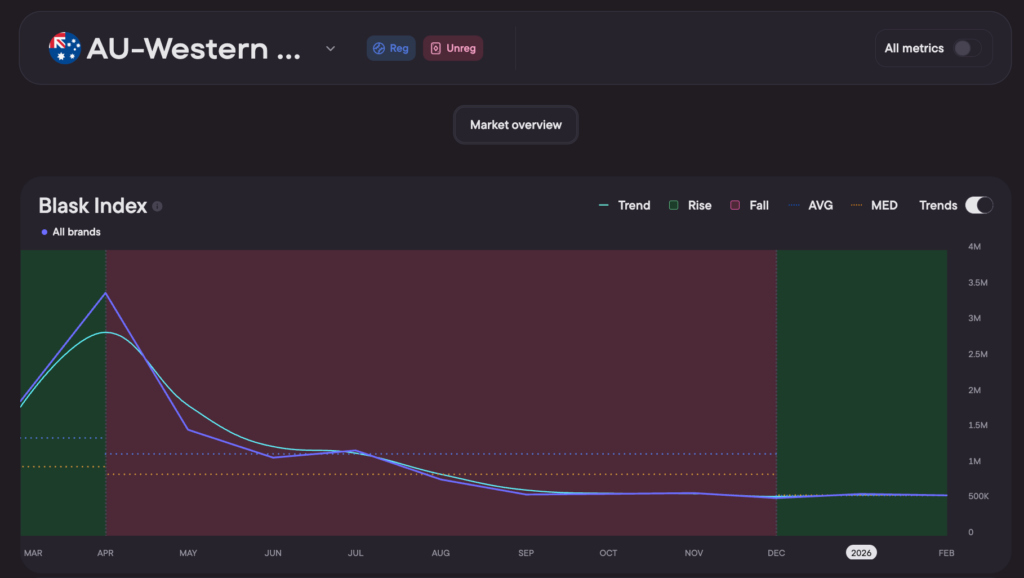
For Western Australia, you can see a sharp spike in March–April (likely tied to seasonal demand patterns), followed by a steady decline through winter months. The trend line and rise/fall zones make it easy to identify whether current momentum is accelerating or fading.
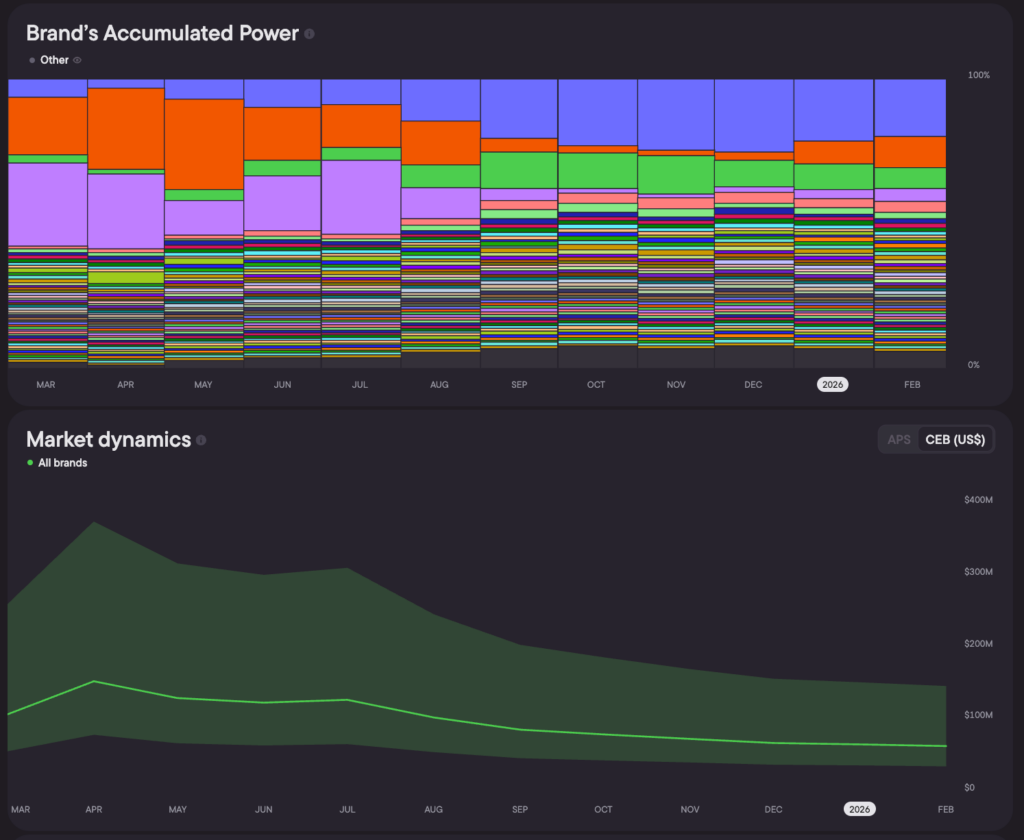
BAP and CEB
Scroll down to the BAP chart — a stacked bar visualization showing how demand is distributed across operators over time. In Western Australia, the chart reveals a leadership shift mid-2025. Skycrown (orange) dominated through the first half of the year, but by mid-year TABtouch (blue) overtook it to become the leading brand by accumulated power.
The CEB chart sits just below, showing estimated revenue trends for all brands in the state.
Seasonality
The Seasonality panel reveals when players are most active — both by month and by day of the week.
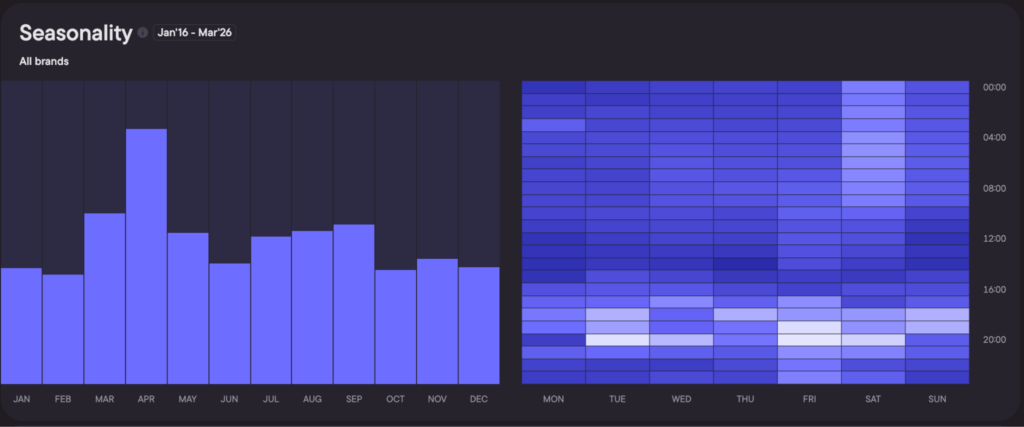
Western Australia shows a clear April peak, with activity declining steadily toward year-end. The weekly heatmap adds another layer: the heaviest traffic concentrates around 8 PM UTC on Friday — which translates to late Friday night / early Saturday morning local time.
Brand Rankings
Finally, the brand table lists every operator active in the state — 313 brands in Western Australia’s case — ranked by BAP.
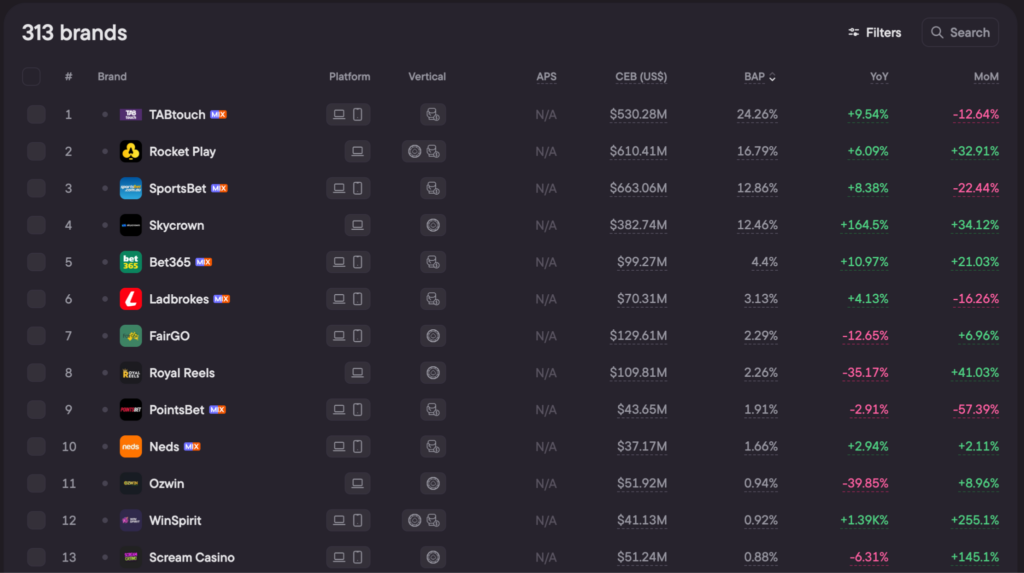
The market is heavily concentrated: the top four brands hold roughly two-thirds of all demand. The leader by BAP is locally licensed betting operator TABtouch, but another licensed brand SportsBet leads by CEB. Skycrown is the standout by YoY growth with an impressive +164.5%.
Try It
State-level drill-down is live for the United States (50 states), Canada (13 provinces and territories), and Australia (8 states and territories). Navigate to any of these countries in Blask and click the expand arrow — or go directly to the country page to explore the States Overview.