
- Updated:
- Published:
iGaming sponsorship ROI: brand lift framework with BAP, APS & CEB
Sponsoring sports teams and events can feel like a shot in the dark — huge investments with uncertain returns. Blask’s sponsorship ROI framework brings clarity, using search‑based metrics, share‑of‑interest tracking, and game placement data to convert sponsorships into measurable GGR uplift, optimized spend, and smarter campaign timing.
TL;DR: Sponsorship ROI in iGaming
- Prove the deal moved demand (hourly):
establish a baseline BAP 2–4 weeks pre-activation, then measure sustained lift during/after matches. - Prove demand turned into acquisition (monthly):
compare your APS band before vs after activation to see if the sponsorship created real newcomer headroom. - Prove acquisition monetized (monthly):
validate uplift with CEB vs GGR — if you’re at/above band, the deal didn’t just spike attention; it paid.
Shortcut: If BAP jumps but APS/CEB don’t, you didn’t buy growth — you bought noise.
What is ROI in sports sponsorships?
ROI in the context of sports sponsorships is the ratio of the incremental value generated by a sponsorship deal to the total investment in that deal.
In iGaming, that value isn’t just logo-plugs on a jersey — it’s the new customer sign-ups, lifted brand visibility, and extra revenue driven by every match, tournament or broadcast you sponsor.
💡 Explore: The defining events that shaped iGaming in 2024
Why sponsorship ROI is hard to measure (and what “good” measurement looks like)
Sponsorship measurement often fails for the same reason it looks attractive: it’s not a single channel. The value is split across broadcast exposure, social amplification, on-site activations, and delayed “memory effects” that show up weeks later in brand preference and conversion.
Industry measurement guides keep repeating the same warning: impressions aren’t ROI. Mature frameworks combine (1) exposure/attention, (2) brand lift, and (3) business outcomes — and test whether upper-funnel movement actually correlates with lower-funnel value.
That’s the gap Blask’s approach is designed to close for iGaming:
- BAP acts as the “brand lift / attention shift” signal at event cadence (hourly).
- APS converts that lift into a forward-looking acquisition expectation (monthly band).
- CEB + GGR confirm whether the incremental demand actually monetized (monthly corridor).
In plain terms: sponsorship ROI stops being a story you tell internally — it becomes a set of checkpoints you can rerun every tournament.
Pre-event benchmarking: brand lift (BAP)
Capture your Brand Accumulated Power in the weeks before activation.
Begin tracking your Brand Accumulated Power at least 2–4 weeks ahead of any sponsorship kickoff.
Pin the hourly BAP widget and watch for natural fluctuations — this period gives you real-world visibility of brand mind-share, organic search traction, social chatter and lobby traffic before any promotional boost.
Establish a “baseline BAP” to measure real uplift once the deal goes live
Once you’ve mapped out your pre-activation BAP range, lock it in as your baseline. When your sponsorship launches, compare your live BAP against that baseline every hour.
Any sustained lift above the upper bound of your pre-event range becomes a quantifiable measure of “brand lift,” isolating the direct impact of your deal.
💡 Deep dive: BAP is All You Need
Example: Stake & IPL 2024
- During IPL 2024, Stake’s BAP surged by several percentage points as each high-profile match aired.
- On June, Blask released May’s CEB band — showing that Stake’s real-time BAP bump foreshadowed a healthy shift upward in their “Average” and “Better” revenue tiers.
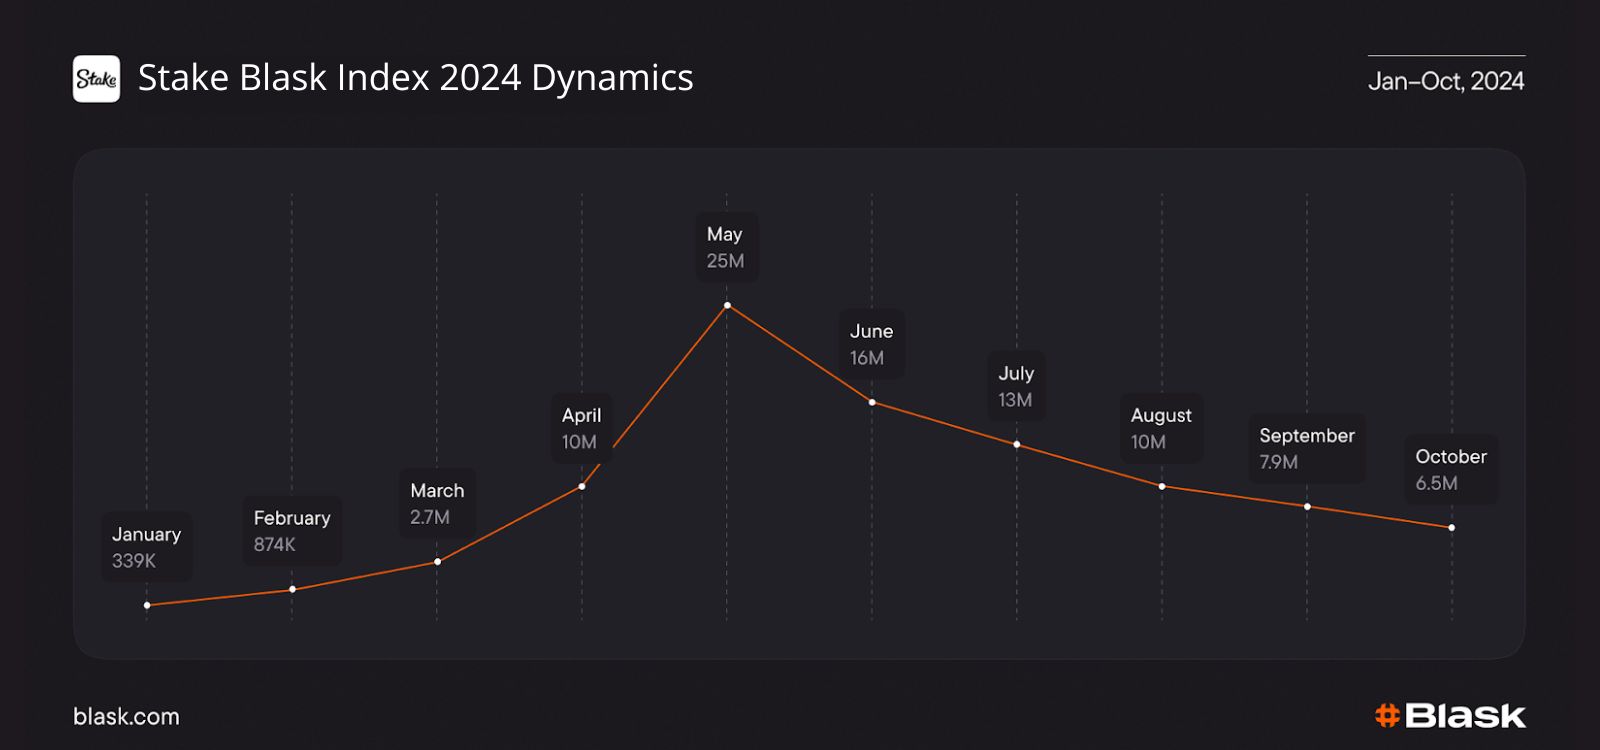
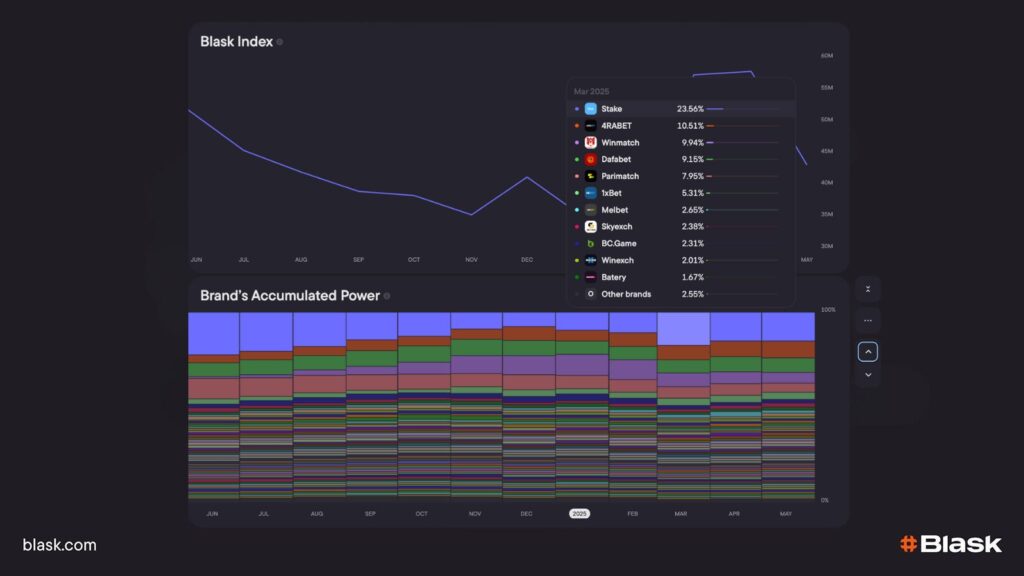
Blask Index for Stake
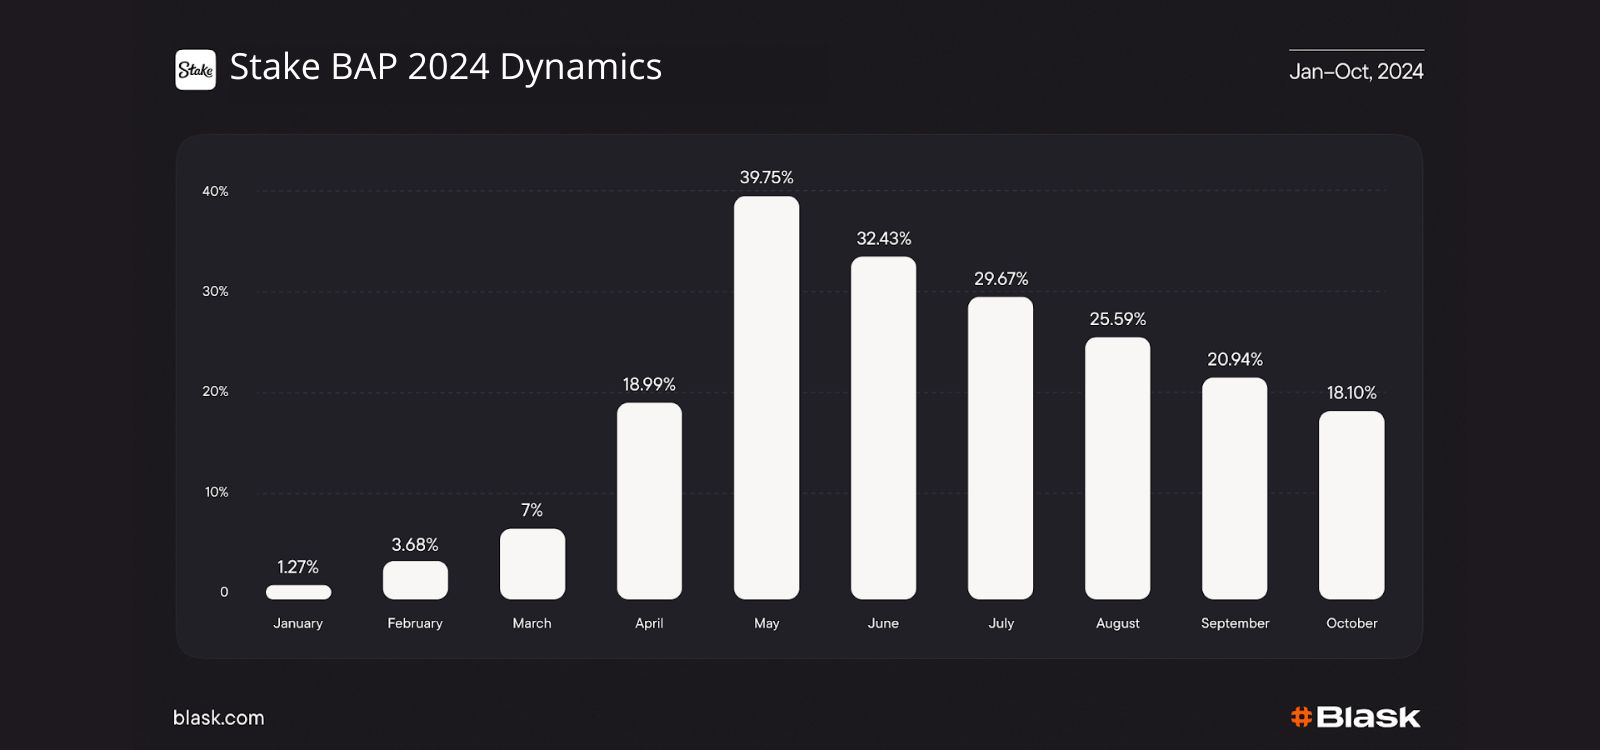
BAP for Stake
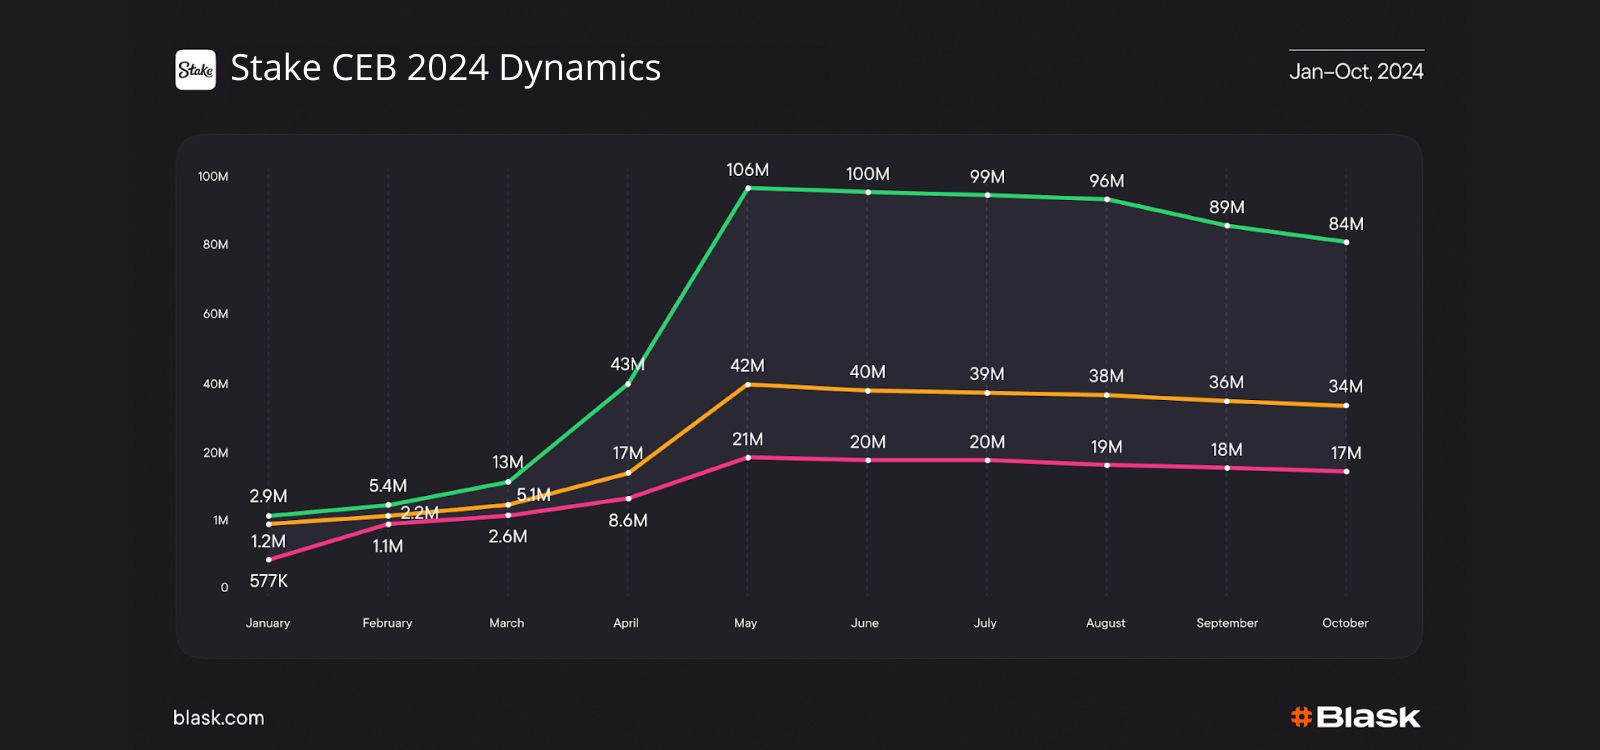
CEB for Stake
Example #2: The International 2025
Sports sponsorship planning often assumes that “premier events” automatically create predictable spikes. The problem is that event influence changes and the market doesn’t care about legacy prestige.
Blask’s analysis of The International shows exactly that dynamic. TI still posts strong viewership, but its gravitational pull on betting has weakened: the article describes shrinking prize pools since earlier peaks, and notes that esports betting share for Dota 2 fell year-over-year, with TI representing a much smaller slice of total esports betting than it used to.
How to use this inside the sponsorship ROI framework:
- Set a pre-event baseline (BAP) for your brand and for the market.
- Track the event window like you did for IPL — but compare it to prior years’ event windows.
- If the event no longer lifts demand materially, the ROI conversation changes: you’re not “missing activation,” you’re buying into a spike that isn’t there anymore.
Why this is valuable to sponsors: it turns “we should sponsor this because it’s big” into “we should sponsor this because it still moves demand in our GEO.”
💡 Read more: How different events influence the iGaming market
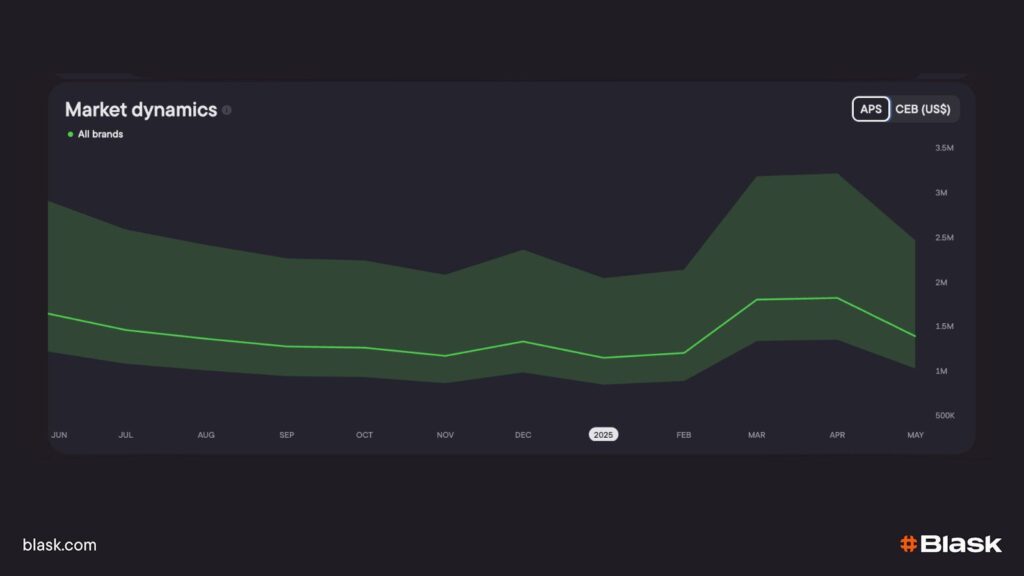
Why APS gives a clearer sponsorship read
APS is an AI-modelled benchmark published once a month that shows how many new customers should be within reach of a brand, given its current search visibility, brand strength and competitive pressure. The figure is delivered as a three-band range (Worse / Average / Better).
If your real FTD count falls inside the green corridor you’re performing “on-par”; if you break the upper band you’re outperforming market expectations, and if you drop below the lower band you have an acquisition problem.
💡 Read more: Ushering in APS & CEB for a New Era of Brand Performance
Key differences at a glance
| Feature | APS (new) | FTD |
|---|---|---|
| What it measures | Potential monthly newcomers predicted from Brand Accumulated Power (BAP) | Actual first deposits recorded |
| Granularity | Calendar month, refreshed on the 10ᵗʰ | Hour / day inside operators’ BI |
| Output | 3-point range (Worse-Average-Better) plus market total | Single integer |
| Context built-in | Search share, competitor density, seasonality, regulation | None – pure transactional |
| Typical uses | Budget planning, sponsorship ROI checks, market benchmarking | Finance reporting, bonus accounting |
| Cross-vertical ready | Yes – any sector where visibility → customers | Largely iGaming-specific |
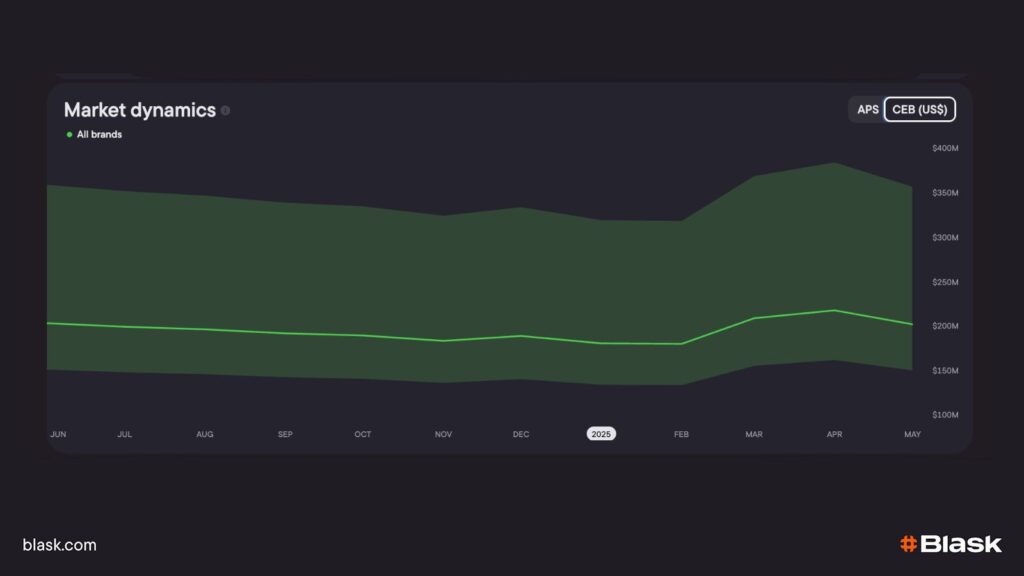
GGR vs. CEB — reading the green band
- GGR (Gross Gaming Revenue) – the net bets-minus-wins you actually booked for the closed month.
- CEB (Competitive Earning Baseline) – Blask’s USD corridor (Worse ∙ Average ∙ Better) that predicts the revenue you should capture, published on the 10-th.
Interpreting the corridor
- Below Worse: monetisation is leaking — audit pricing, bonus burn and payment UX immediately.
- Within band: on par with market physics; incremental fixes (VIP, cross-sell) will matter most.
- Above Better: your sponsorship, promos or product mix are over-delivering — replicate the formula.
Using APS & CEB to price a sports sponsorship
Set the baselines
Record last month’s APS and CEB before the deal launches (your “business as usual” marks).
Measure the lift
When Blask publishes the new month’s scores:
- APS jump? → sponsorship drove incremental registrations.
- CEB jump and GGR inside / above band? → those new players also monetised at or above expectations.
Segment the gains
- Break APS lift by country and channel to see where the broadcast or shirt logo resonated.
- Compare your APS-to-FTD conversion by persona to locate funnel choke-points.
Benchmark rivals
Pull competitors’ APS for the same month. If their corridor rose faster, their creative or on-site activations are stealing share — study and adapt.
Feed insights into spend decisions
- APS ↑, CEB ↑, GGR ≥ Average: scale similar rights packages or renew at premium.
- APS ↔, CEB ↔, GGR < Worse: re-negotiate assets, switch to digital-only integrations, or divert budget to proven channels.