I built three World Cup budget plans in my career before I ever looked at the demand curve underneath one.
All three assumed the same shape: build through the group stage, hold through the knockouts, spend hardest around the final. That shape is wrong, and the tournament that just ended proved it with numbers I couldn’t argue with, because they came from our own data.
The handle was real, the curve underneath it wasn’t what anyone expected
Nobody disputes that World Cup 2026 was the biggest betting event this sport has produced. OpenBet processed roughly $3B in stakes across the tournament, and Caesars Sportsbook confirmed that the Spain-Argentina final broke every record the operator tracks for handle, ticket count, and unique bettors, with the final’s handle nearly 65% higher than the previous single-match record.
Those numbers are legitimate, and they’re also the ones every operator marketing plan is built around: the final is the biggest single betting moment, so it gets the biggest push. What that framing misses is where the marketing opportunity actually sat, and that’s a different question from where the betting handle sat.
We track that opportunity through Blask Index, an AI-enhanced demand signal built from search activity across iGaming brands. It measures interest before it turns into a bet, which makes it a planning tool, not a scoreboard.
The group stage is where demand peaked
Here’s the number that reframed the whole plan for me. Across the tournament, 24 countries hit their single highest day of Blask Index during the group stage, not later. Some of those countries went on to reach the quarterfinals or beyond. It didn’t matter. The peak was already behind them.
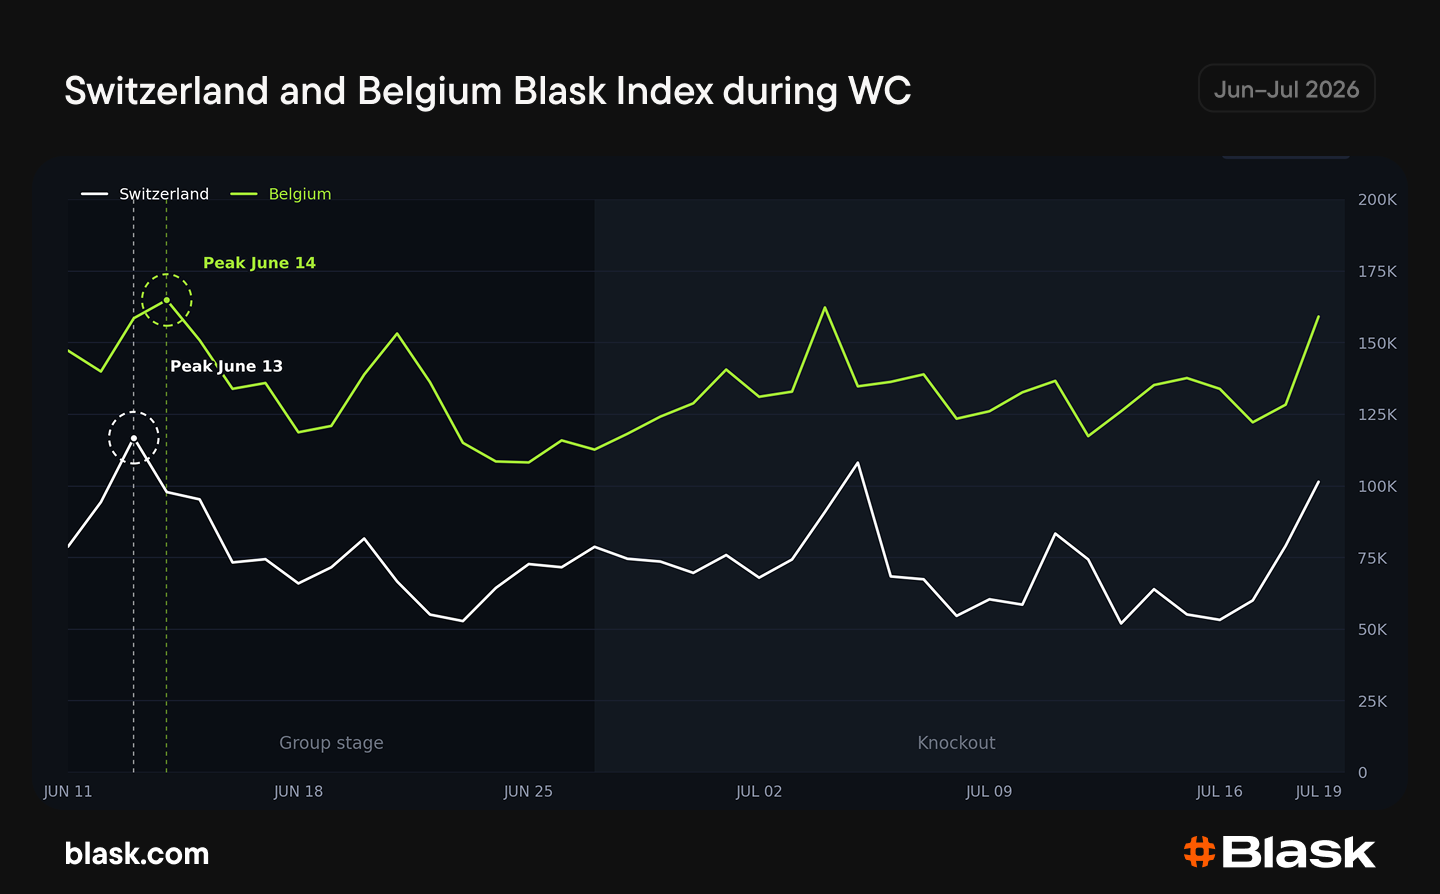
Belgium is a clean example, and it’s not the one anyone would guess. Their single highest day of Blask Index during the entire tournament was June 14, before they’d even reached the knockout rounds. They never matched that level again, not in the round of 16, not in the quarterfinals.
Switzerland’s pattern is nearly identical: their peak landed June 13. Both curves tell the same story — the highest point wasn’t a result, it was a moment of uncertainty at the very start. Two forces explain it.
First, the opening week is the only point in a tournament where every team is still alive and every outcome is still possible. That uncertainty is what drives search and pre-match interest. Once teams start getting eliminated, some of that uncertainty disappears.
Second, supply drives demand more than most marketers assume. The group stage runs four matches a day across 48 teams and thousands of betting markets, while the knockout rounds narrow to two games a weekend. Demand follows the size of the menu, rather than the individual stakes on it.
The practical implication is blunt. If a media plan builds toward the final, it’s building toward the moment when the audience has the least reason to search.
Buy the calendar, not the fixture
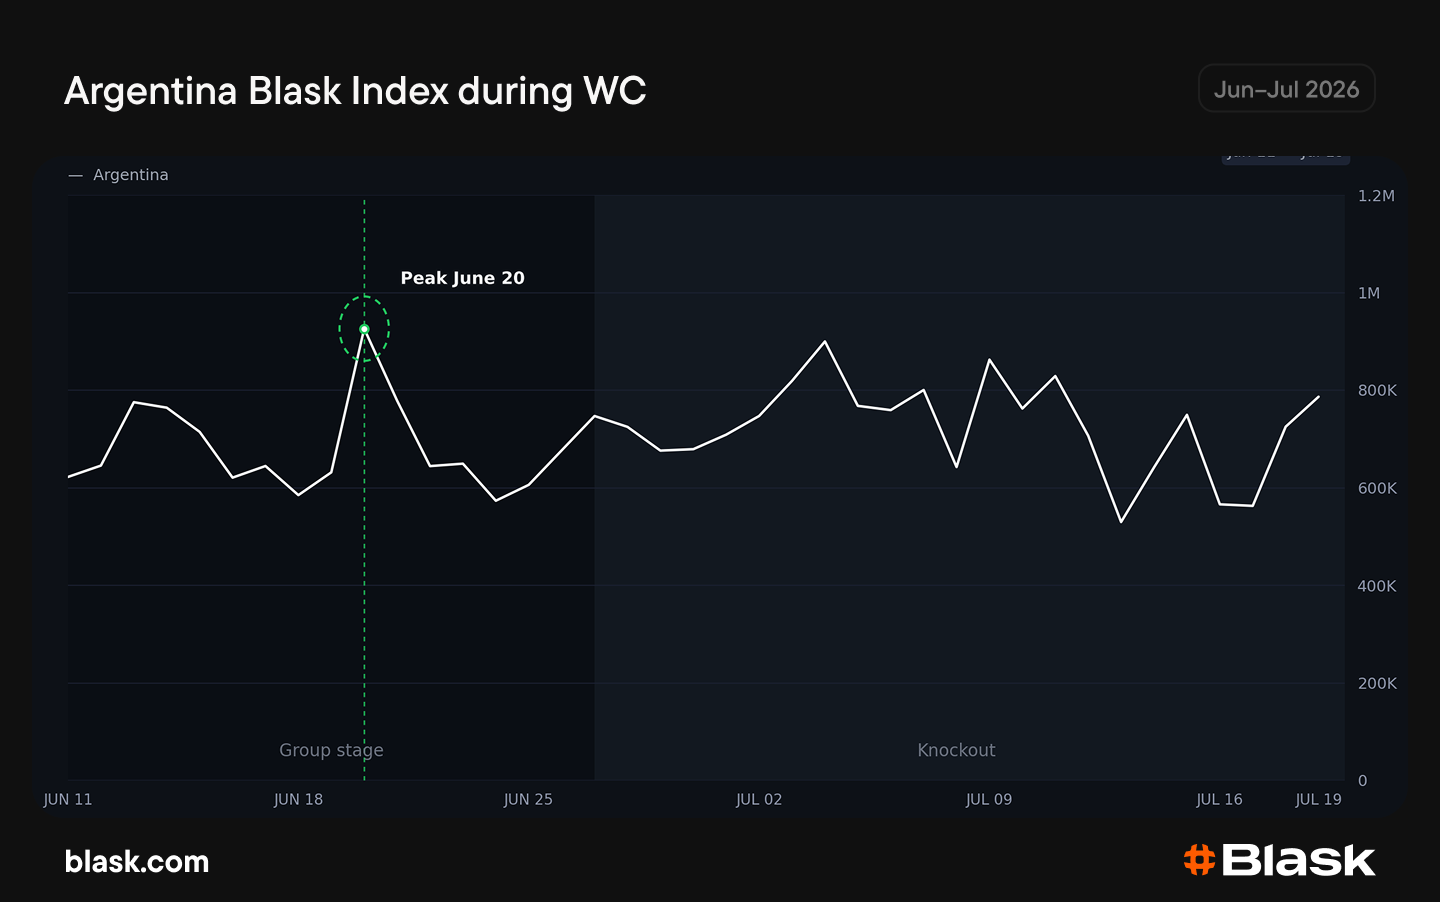
Argentina is the case that made the point hardest to ignore. Their single highest day of gambling demand fell on June 20, and it had nothing to do with a match. It was a national holiday in the middle of the group stage. A second peak landed on July 9, also a holiday. By the final itself, demand was 63% below the tournament’s peak for Argentina, even though their team was playing for the title.
The reason isn’t complicated once you see the curve: by the final, the audience is emotionally at its highest point and commercially close to spent. Most of a season’s betting budget, for both the player and the operator, has already moved. The operators who priced up hardest for the final were bidding for attention in an auction where the money had largely left the room.
A public holiday in the middle of the group stage produces the opposite condition. People are home, together, relaxed, phone in hand, with both time and money still available. Critically, no competitor is bidding against you for that attention because it isn’t on anyone else’s media plan either. That’s a betting day.
The rule I’d put on the wall for next time: buy the calendar, not the fixture.
Dmitriy Belianin
Country growth doesn’t have one explanation, and that matters for targeting
We tracked which markets grew hardest during the tournament by Blask Index: Panama up 82%, Japan up 79%, South Korea around 58%, Paraguay around 57%, Germany up 54%. Read as a single trend, that list is useless. Read individually, each one tells an operator something different about how to spend.
Panama’s growth is a small-base effect. The percentage is dramatic, but the market is tiny, so 80% growth there moves less real money than 1% growth in a market the size of Brazil.
Paraguay’s growth is a story effect: their run to the round of 16, including a penalty win over Germany, gave the country a new reason to watch and bet every few days, which produces sustained demand rather than a single spike.
Germany’s growth is a culture effect, and it shows up every major tournament regardless of the result. Country’s Blask Index was up 14% at the 2018 World Cup, 9% in Qatar, and 10% at the last Euros. Different squads, different outcomes, the same trajectory.
Only one of those three growth engines is plannable in advance. Culture-driven demand can be forecast; story-driven and small-base effects mostly can’t. A budget that treats all growing markets the same way is spending against noise in two of every three cases.
The 60:40 problem operators keep getting backwards
Performance marketing during a tournament like this behaves like rent. You pay to appear in front of a customer for the day or two your campaign runs, bidding against every competitor doing the same thing at the same moment, for the same shrinking pool of attention.
Brand marketing behaves like ownership: it builds recognition and recall that’s already there by the time a customer’s betting behavior wakes up, rather than trying to buy it in the moment it does.
This isn’t a new idea. The IPA’s research on marketing effectiveness found that the optimal split between brand-building and short-term activation spend runs close to 60:40 in most categories, and that campaigns optimized purely for short-term response consistently underperform on long-term growth. iGaming operators spend the tournament fighting for the 40% and largely ignoring the 60%, then wonder why the acquisition cost climbs every cycle without the brand getting any easier to sell.
The fix isn’t complicated, even if it’s unpopular with anyone managing a quarterly budget. Brand-building spend needs to land before the first whistle, not during the tournament. That way recognition is already built by the time real demand shows up, on the days the calendar creates rather than the day the fixture list says should matter most.
The takeaway
Volume and marketing opportunities are two different curves, and for the World Cup 2026 they didn’t move together. The final produced the biggest handle. The group stage and national holidays produced the real opportunity to be seen first.
Plan the next major event around the second curve, not the first one, and the budget will be sitting where the demand actually is.
Halloween is still 10 days away, but the casino lobby is already in costume. And not all of the costumes are pumpkins. Blask analysts looked at Halloween slots and the darker titles gaining ground beside them: vampires, witches, demons. The snapshot is from October 12. 1. The season’s most visible title is vampire themed The […]
Two weeks of the decree gave back the gains made after 2022, and left the earlier boom in place. In Brazil, Blask Index rose about 30 times from January 2020 to the April 2026 peak. The licensed book under that climb is young: federal fixed-odds authorisations went live on 1 January 2025, under Law 14.790 […]
Brazil’s ban closed the same market for every licensed brand, but for most of them that market was the whole company. President Lula’s Provisional Measure 1,394 stopped new deposits and bets on 25 September, took licensed sites offline on 6 October and ends every federal licence on 25 October. Blask has estimated that the first […]