

- Updated:
- Published:
How to calculate player LTV in iGaming: formula, benchmarks and what operators get wrong

Operators still treat player lifetime value as one average for the whole base. That average collapses under real account data. Forrest and McHale’s 2024 study of about 140 000 British gambling accounts found the top 20% of customers generated 89.2% of net revenue, while the bottom half contributed 0.51%. Blend those cohorts and media budgets chase soft FTDs while the thin slice that pays the bill back stays underfunded.
This guide covers the Net LTV formula for iGaming, casino vs sportsbook maths, the mistakes that inflate the number, and how Blask CEB stress-tests the model from outside.
Why the standard LTV formula fails in iGaming
The textbook version is clean:
| LTV = ARPU x average lifespan |
It fails for three structural reasons.
Volatility and concentration. Two slots players can share the same lifespan and post opposite ARPU paths: one hits early and leaves, the other burns the bankroll for several weeks. Averaging them describes neither journey.
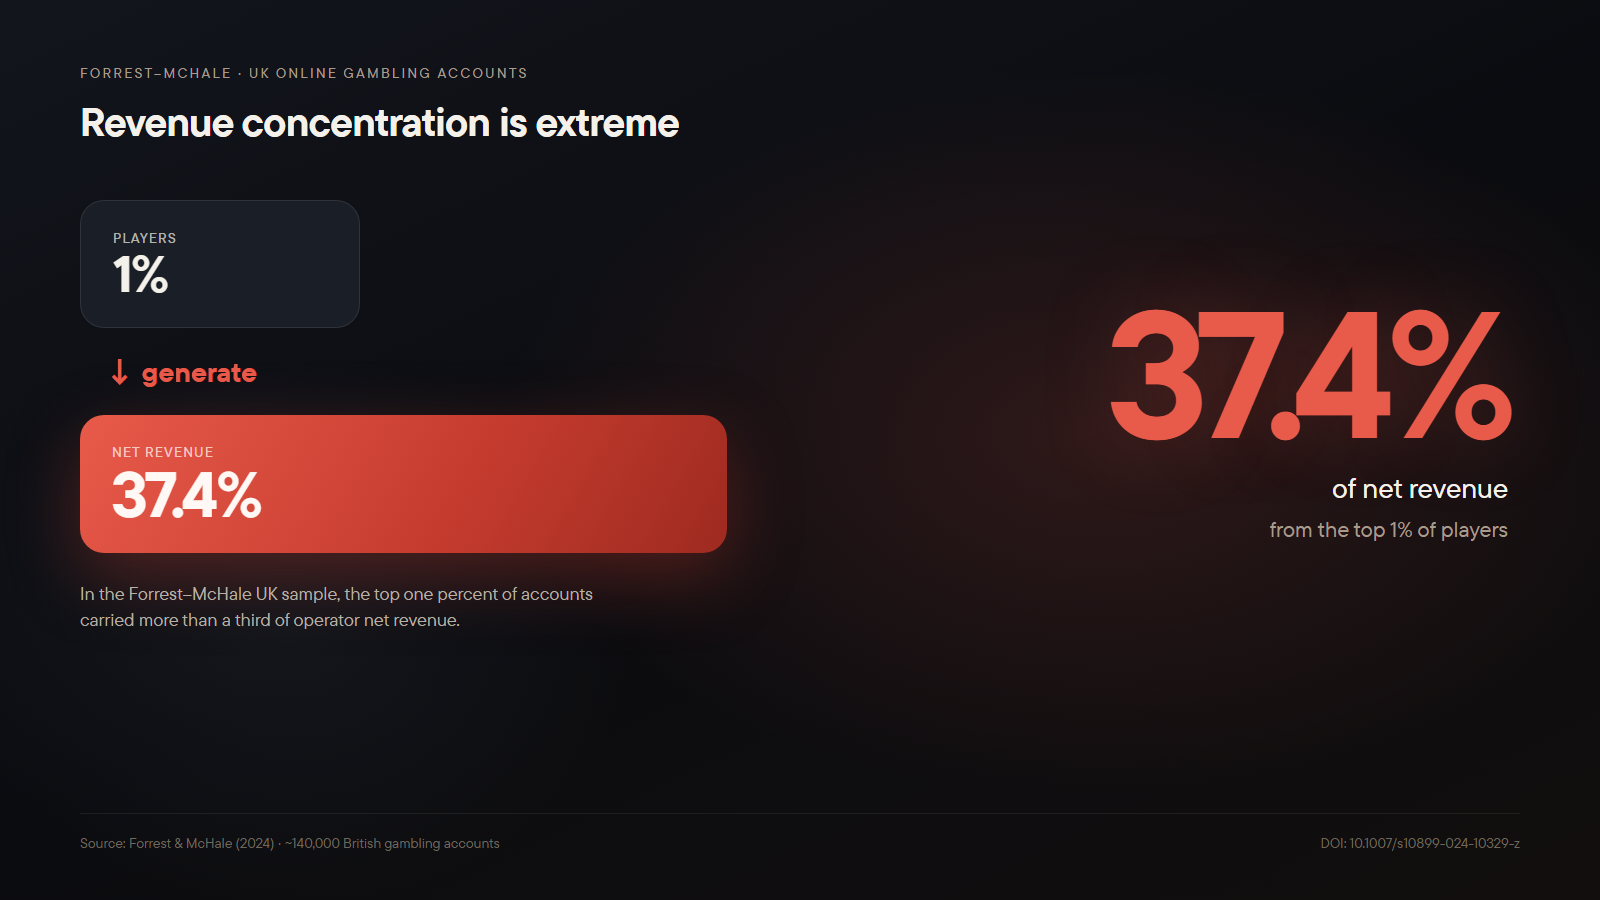
Multi-operator work on online gambling has long shown concentration tighter than classic Pareto: a few percent of accounts carry most operator revenue. In the Forrest–McHale UK sample, the top 1% generated 37.4% of net revenue and the top 5% more than two-thirds.
Missing bonus costs. Gross LTV before promos can print near $600 while Net LTV after welcome offer, free spins and cashback lands closer to $200. Teams that set CAC against Gross LTV discover the unit economics never close.
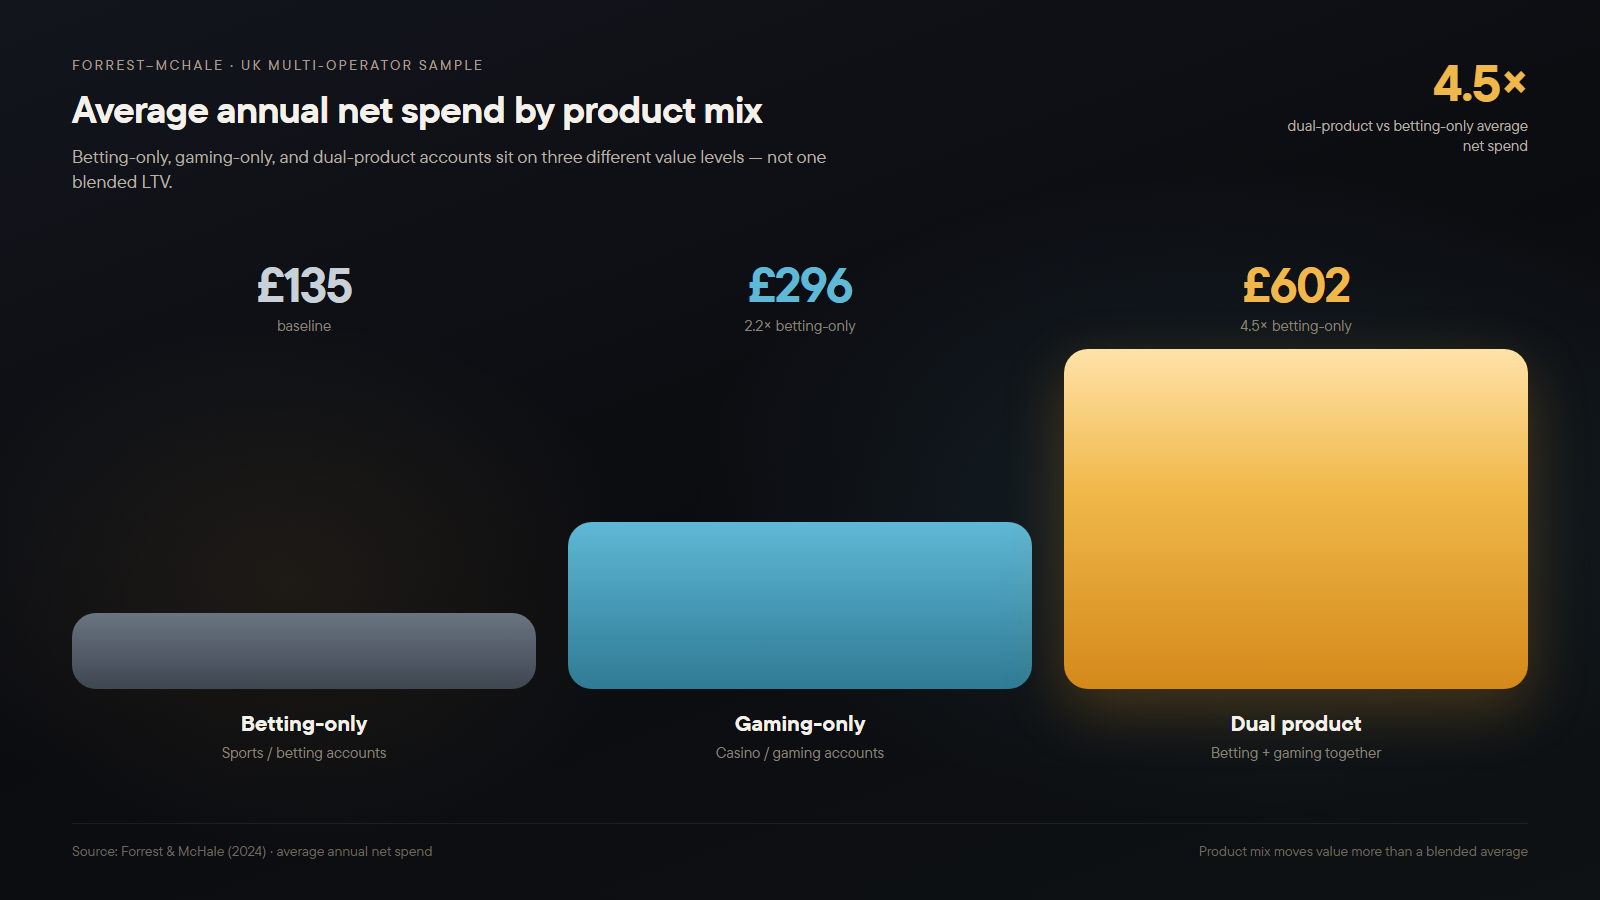
Segments are different equations. A casual slots player and a high-roller diverge on retention, promo intensity, payment fees and tax treatment. The same UK multi-operator set put average annual net spend at:
- £135 for betting-only accounts;
- £296 for gaming-only;
- £602 for dual betting+gambling.
Source: Forrest & McHale, ~140,000 Great Britain accounts. The 25% of accounts that used both products delivered about 55% of operator net revenue. Those splits are the minimum segmentation for a usable LTV model.
How to calculate player LTV in iGaming step by step
Casino and sportsbook cohorts share the same spine. Retention and lifespan assumptions swap by product.
| Net LTV = (ARPU x retention rate x average lifespan) – (bonus costs + payment fees + applicable taxes) |
Build ARPU from NGR (Net Gaming Revenue = GGR – bonuses), not from GGR with promos parked in a separate marketing line.
Retention is the load-bearing term. Skip it and LTV overstates by multiples. Day-30 activity, not registration counts, is the cohort signal that belongs in the model.
Lifespan is segment-dependent. Casual slots and sports cohorts often sit in the 9–18 month band; live casino and multi-game regulars stretch longer; VIP relationships can run for years. Regulated-market commentary that separates retention-led operators (longer lifetimes) from acquisition-led ones (shorter) matches that spread.
Bonus costs cover the full stack: welcome, reload, free spins, cashback, loyalty. Aggressive promo intensity often runs in the 20–40% of GGR range. If those euros never hit the LTV equation, net LTV is fiction.
Worked example: sports bettor
| ARPU $35/month x 0.20 retention x 21 months lifespan = $147 gross- $60 bonus costs – $27 taxes ≈ Net LTV ~$60 |
On this assumption set, sports-only CAC that sits near or above ~$60 leaves the cohort loss-making before CRM starts. Casino cohorts raise ARPU and session frequency, but the Net structure stays identical.
Casino and sportsbook need different LTV equations
Casino and sports betting run on different LTV systems. A content swap between verticals does not unify the maths.
The casino house edge is structural. Cohort means convergence even when single-player paths are noisy. As Blask previously said, gambling-only and dual-product accounts in the Forrest–McHale sample outspent betting-only by about 2x and 4.5x (£296 / £602 vs £135).
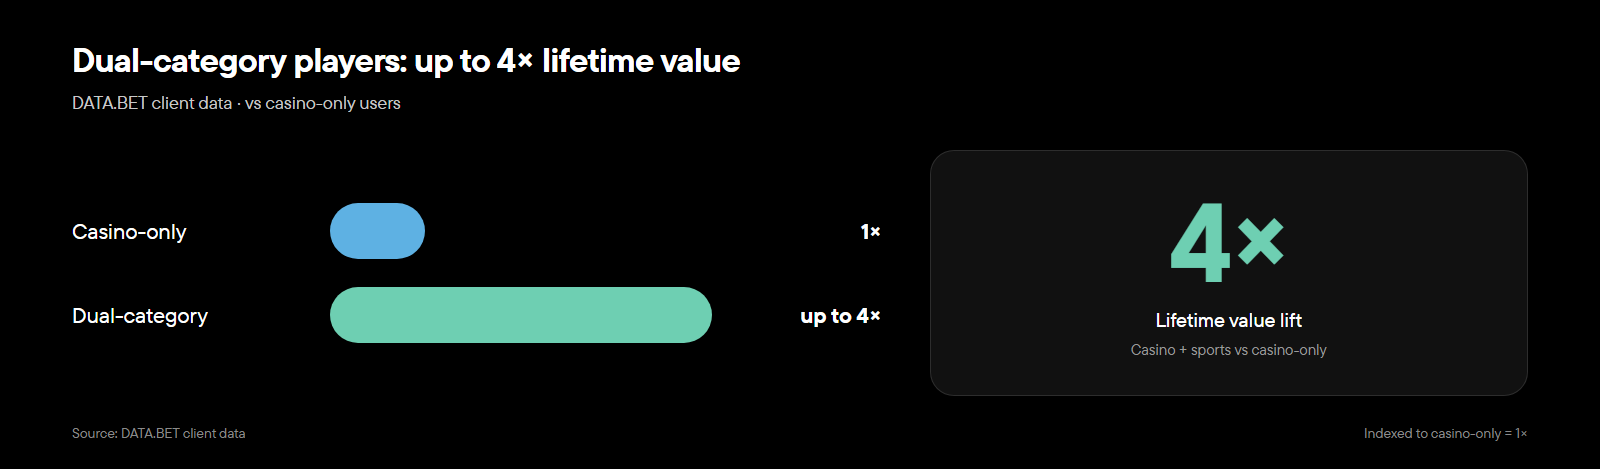
Sportsbook hold moves with book construction and sharp action. Value is seasonal: NFL peak lifts volume, off-season compresses it. Cross-product players stabilize the curve because two activity triggers keep the wallet warm. DATA.BET client data shows dual-category players delivered up to 4x lifetime value versus casino-only users, with about 12% incremental revenue after a sportsbook launch.
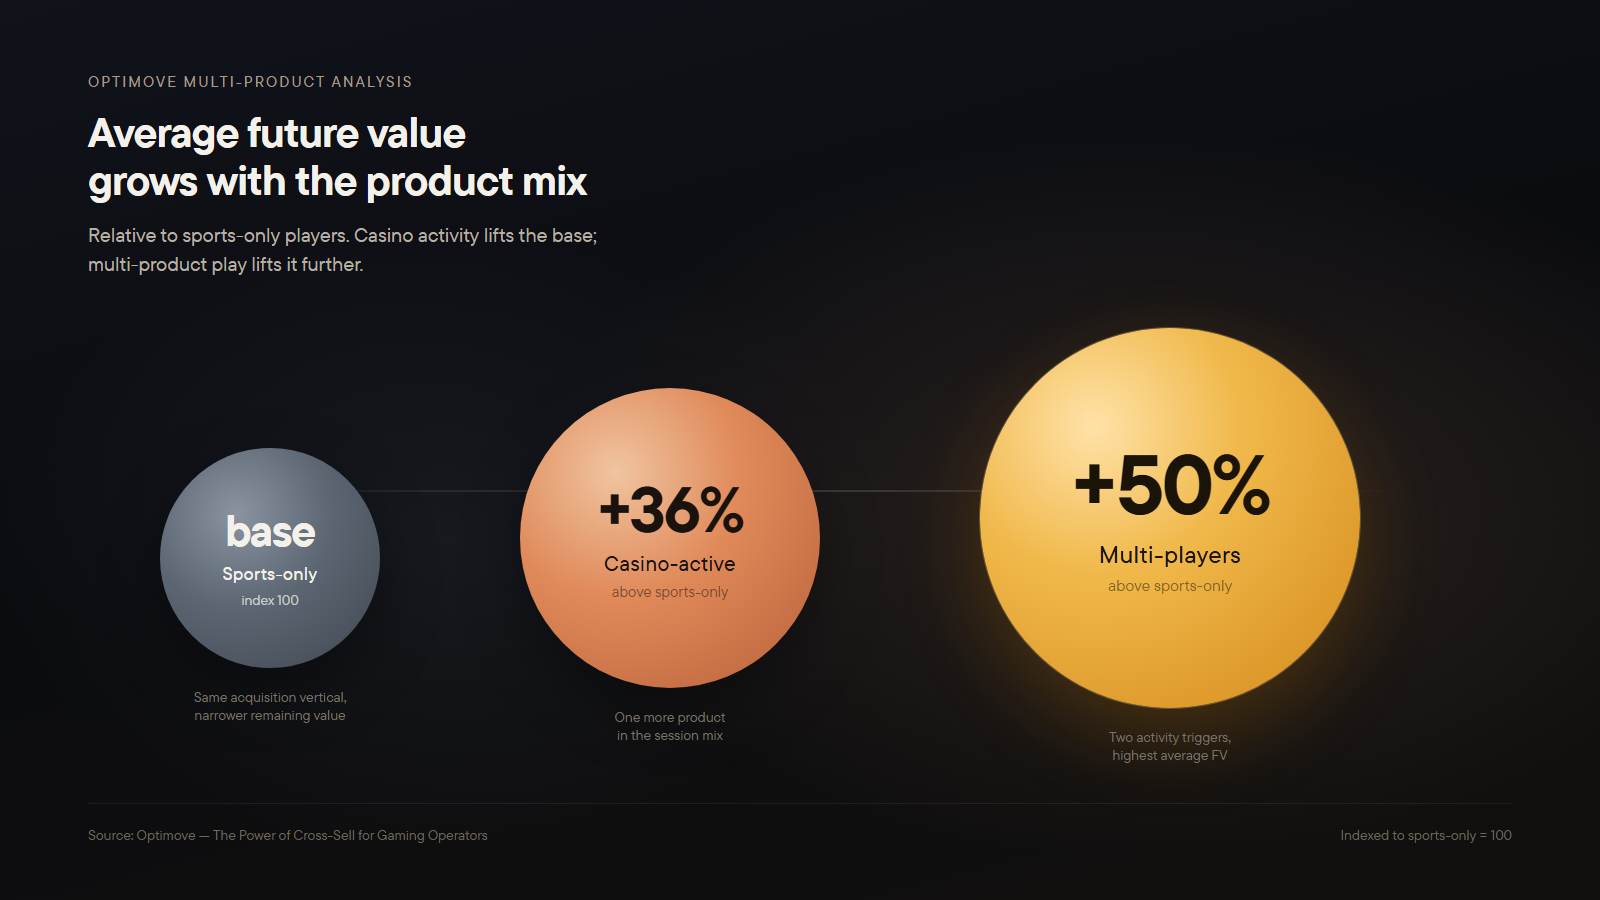
Optimove’s multi-product analysis puts multi-players about 50% higher in average future value than sports-only players, and casino-active players about 36% above the sports-only base.
Three mistakes that inflate LTV
Base-wide LTV instead of cohort LTV
The average player does not exist. Mix a VIP with a one-deposit casual and the spreadsheet produces a figure that fits no budget line. Segment benchmarks start after you split acquisition channel, value segment and market — not before.
Ignoring bonus dilution
An operator books $500 GGR, subtracts $25 in payment fees, and calls the result “$475 LTV”. The same player took $180 in bonuses over twelve months. If those bonuses were not already netted in the revenue definition, Net LTV is closer to $295 — a gap large enough to flip a “profitable” CAC into a silent loss. (If your finance stack already reports NGR after promo, do not subtract the same $180 again)
Using historical LTV as the forecast
Cohort LTV describes what already happened. The player who deposited six months ago can churn tomorrow. Predictive LTV uses session frequency, stake size and withdrawal patterns to estimate remaining value. Retention spend belongs against that forecast, not against a rear-view average.
Blask CEB as an external check on internal LTV
Internal LTV is one lens. Blask CEB is the external check with a Worse / Average / Better corridor.
If internal LTV rolled to brand revenue sits above the CEB corridor for long stretches, the model looks optimistic: missing churn, bonus dilution, or both. If it sits below the Worse band, either the model undervalues the audience or monetisation leaks through product mix, retention or promo waste.
APS adds the second check. Reported FTDs below the APS Worse band point to a conversion problem before first deposit rather than an LTV formula bug.
South Africa proof point H1 2026
Blask data for South Africa across January–June 2026 shows why brand-level validation matters when operators stress-test segment LTV:
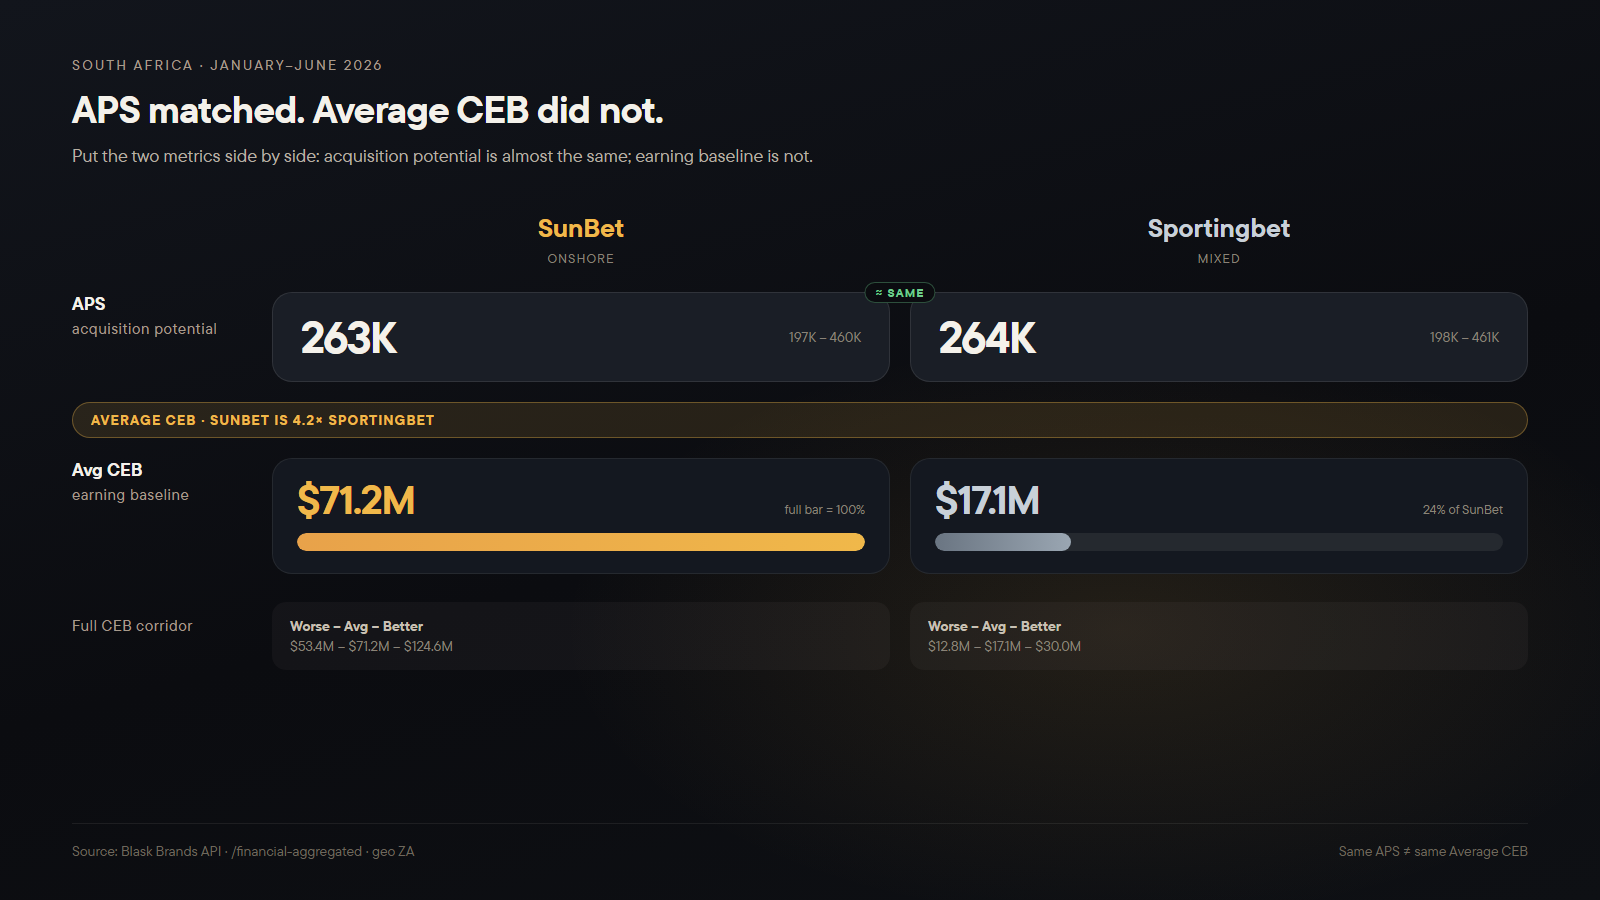
Both brands show near-identical acquisition potential, but SunBet’s Average CEB is about 4.2x Sportingbet’s ($71.2M vs $17.1M). Same audience size does not mean the same earning pressure. CRM intensity, cross-sell and promo efficiency sit between those corridors; media CPA alone does not close the gap.
Belgium proof point H1 2026
The same pattern shows up in a mature regulated European market. Blask data for Belgium across January–June 2026 puts two onshore brands almost on top of each other by APS — and an order of magnitude apart by Average CEB:
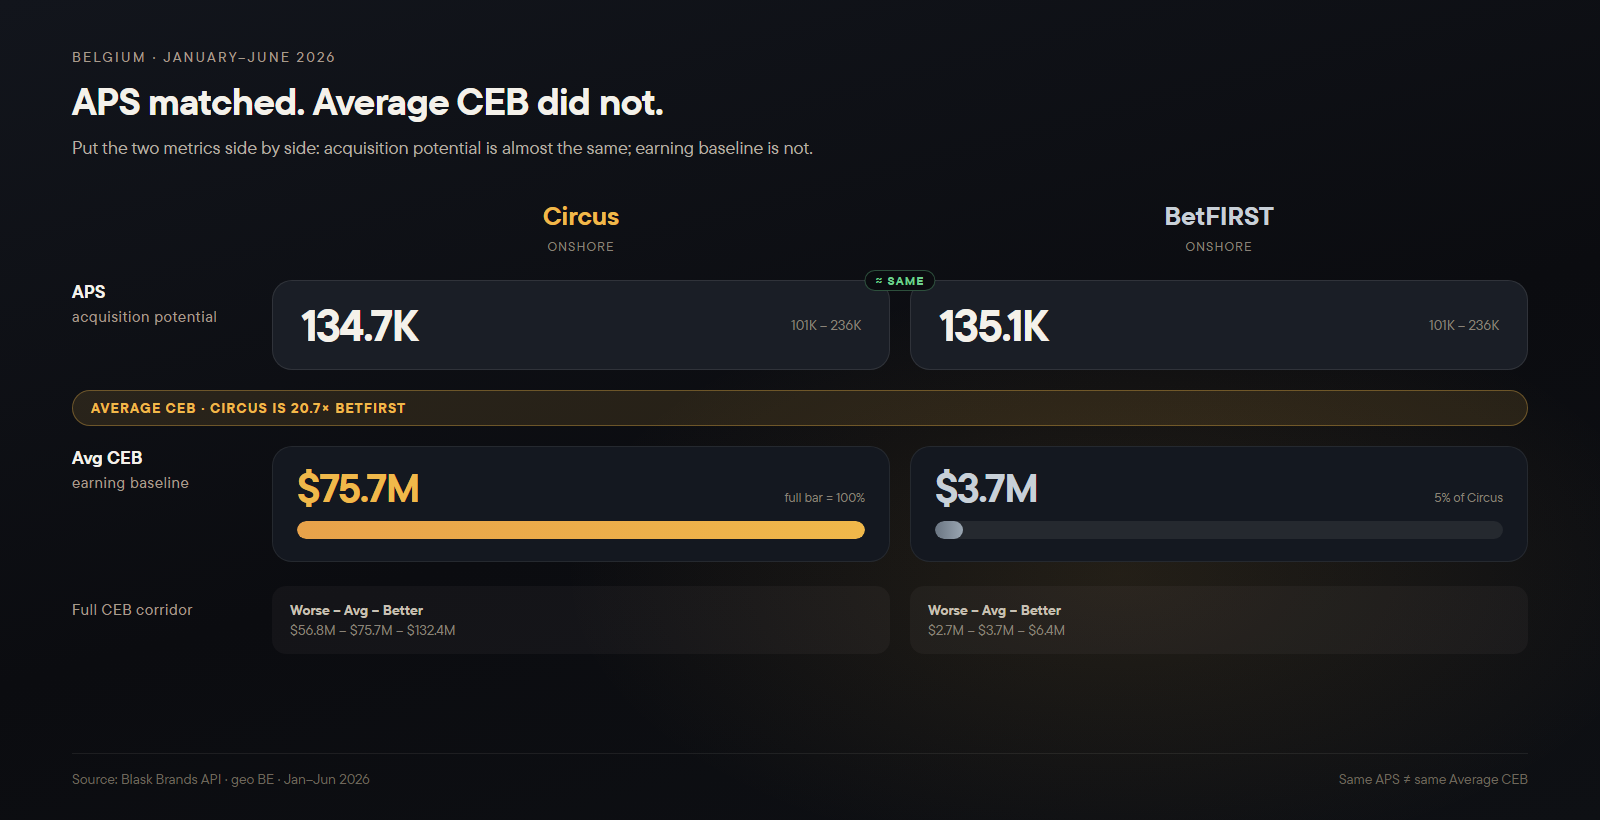
Like in the South Africa example, both iGaming brands show near-identical acquisition potential (APS gap about 0.2%). However, Circus’s Average CEB is about 20.7x BetFIRST’s ($75.7M vs $3.7M).
Bottom line
Player LTV in iGaming is a system of equations: casino versus sports, casual versus VIP, single-product versus cross-sold. Peer-reviewed British account data, H2’s promo warning and dual-product client studies point the same way. Concentration is extreme, Gross LTV overstates payback, and product mix moves value more than FTD headcount. The open question is whether Net LTV by segment becomes the budget input, or the e-commerce shortcut stays on the spreadsheet.
See how Blask CEB validates your revenue model — book a demo
And if you want more useful articles from Blask, read about how to reduce CAC in sports betting.