
- Updated:
- Published:
Provider Content Share
Every casino lobby is a zero-sum surface. When one provider captures more of it, another captures less. For years, the only way to gauge a supplier’s footprint was to count integrations — a blunt instrument that treats a game buried below the fold the same as one pinned to the hero row. Provider Content Share replaces that count with a position-weighted metric: it measures not just whether a provider is present in a lobby, but how much of the lobby’s visible attention that provider actually captures.
What is Provider Content Share
Provider Content Share is a position-weighted metric that quantifies what fraction of a casino lobby’s visible space belongs to a given game supplier. Unlike a simple game count, it accounts for where each title appears on the page.
Games in the top rows are seen by nearly every player who opens the lobby. Games deep in the catalogue are rarely scrolled to. A provider with five titles in the hero section can outscore a rival with twenty titles spread across lower positions. Position is what drives the number — not volume.
Brand Coverage is the companion metric: it counts how many operators, out of the tracked sample for a given market, carry at least one game from a given provider. The two metrics answer different questions:
- Content Share — how prominent is the provider inside the lobbies where it appears
- Brand Coverage — how widely is the provider distributed across the operator market
Reading either metric in isolation gives an incomplete picture. Used together, they map both reach and depth of a provider’s market presence.
How Provider Content Share is calculated
The calculation follows three steps.
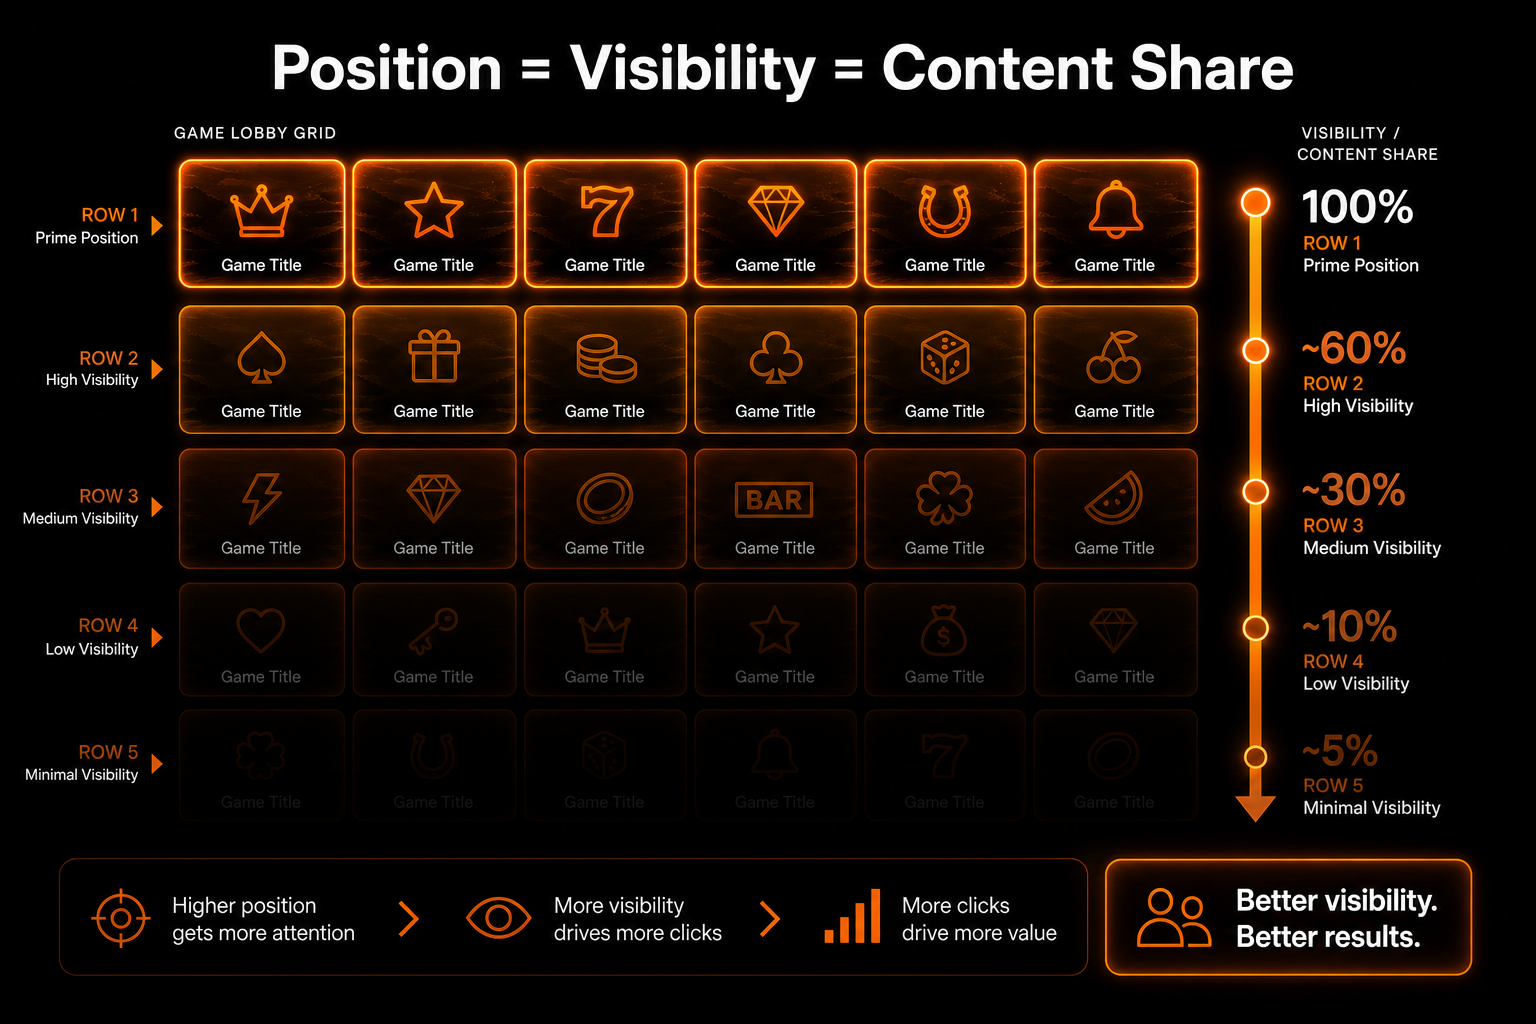
Step 1 — Page Visibility score. Every game on a lobby page receives a Page Visibility value between 0% and 100%, reflecting its position. Games in the top row receive the highest score; each subsequent row reduces the score. A title the player never scrolls to approaches zero.
Step 2 — Provider Content Share per page. For a single casino page, the metric equals the sum of Page Visibility scores across all of a provider’s games on that page, divided by the sum of Page Visibility scores for every game on that page. The result is a percentage — the provider’s share of total lobby attention on that page.
Step 3 — Country-level aggregation. To arrive at a market-wide figure, Blask aggregates across the top operators in a country, treating their lobby pages as a single combined pool before applying the formula. The top operators are defined by Brand’s Accumulated Power (BAP) by default, though the operator sample can be adjusted with a filter.
Brand Coverage is simpler: it is the raw count of operators in the selected sample where the provider appears in at least one lobby position.
Provider Content Share in practice
Operator entering a new market. A content manager preparing a launch in Brazil opens the country page and checks the provider widget. The data shows Pragmatic Play holds 38% Content Share across top operators, with Brand Coverage of 47 out of 50 tracked brands. That single row tells her which studio negotiation to prioritize first. A second-tier supplier at 4% Content Share and Brand Coverage of 12 suggests a later conversation — and stronger negotiating leverage.
Provider benchmarking its own position. A studio’s partnerships team sees its Content Share in Germany at 6%, but the WoW column shows a +1.2 pp gain over the past week while the market leader is flat. The trend signal is more actionable than the absolute number: the studio is gaining lobby real estate faster than competitors, which supports the case for accelerating operator outreach in that market before the shift becomes obvious.
Why lobby visibility matters
Lobby visibility is the primary lever between integration and revenue. A game that is integrated but buried below the fold receives a fraction of the sessions that a top-row game receives. Research from IGamingCompass across 2,000+ operator–market combinations shows that the top three suppliers typically account for 37.9% of all lobby positions globally — confirming that lobby space is highly concentrated and actively managed.
Content Share and Brand Coverage together surface two distinct competitive risks:
| Risk type | What it looks like | What it means |
| Visibility gap | High Brand Coverage, low Content Share | Integrated but deprioritized — agreements exist, placement doesn’t follow |
| Concentration risk | Top two providers exceed 50% Content Share | Structural exposure if either supplier changes pricing or exclusivity terms |
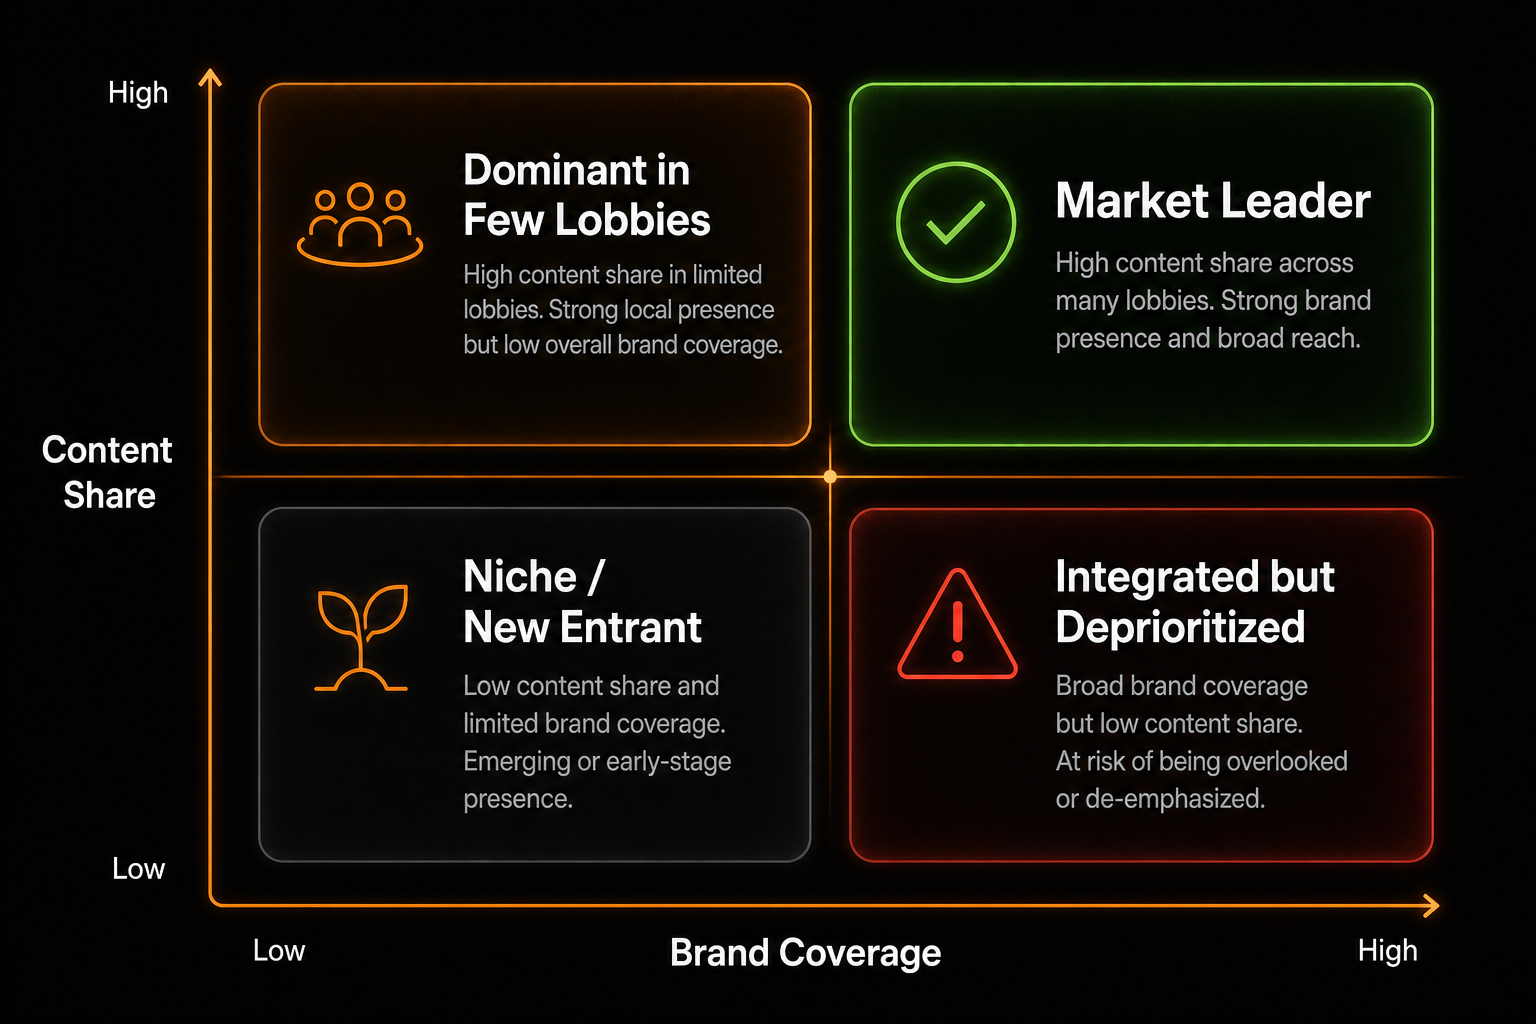
The WoW and MoM trend columns add a leading-indicator dimension. Because lobby changes precede revenue shifts by weeks, a rising Content Share trend for a competitor is a material signal — one that will not appear in any revenue report for months.
Content Share vs other lobby metrics
Provider Content Share is one of several position-weighted metrics in Blask. Understanding where it sits relative to related metrics helps avoid misreading the data.
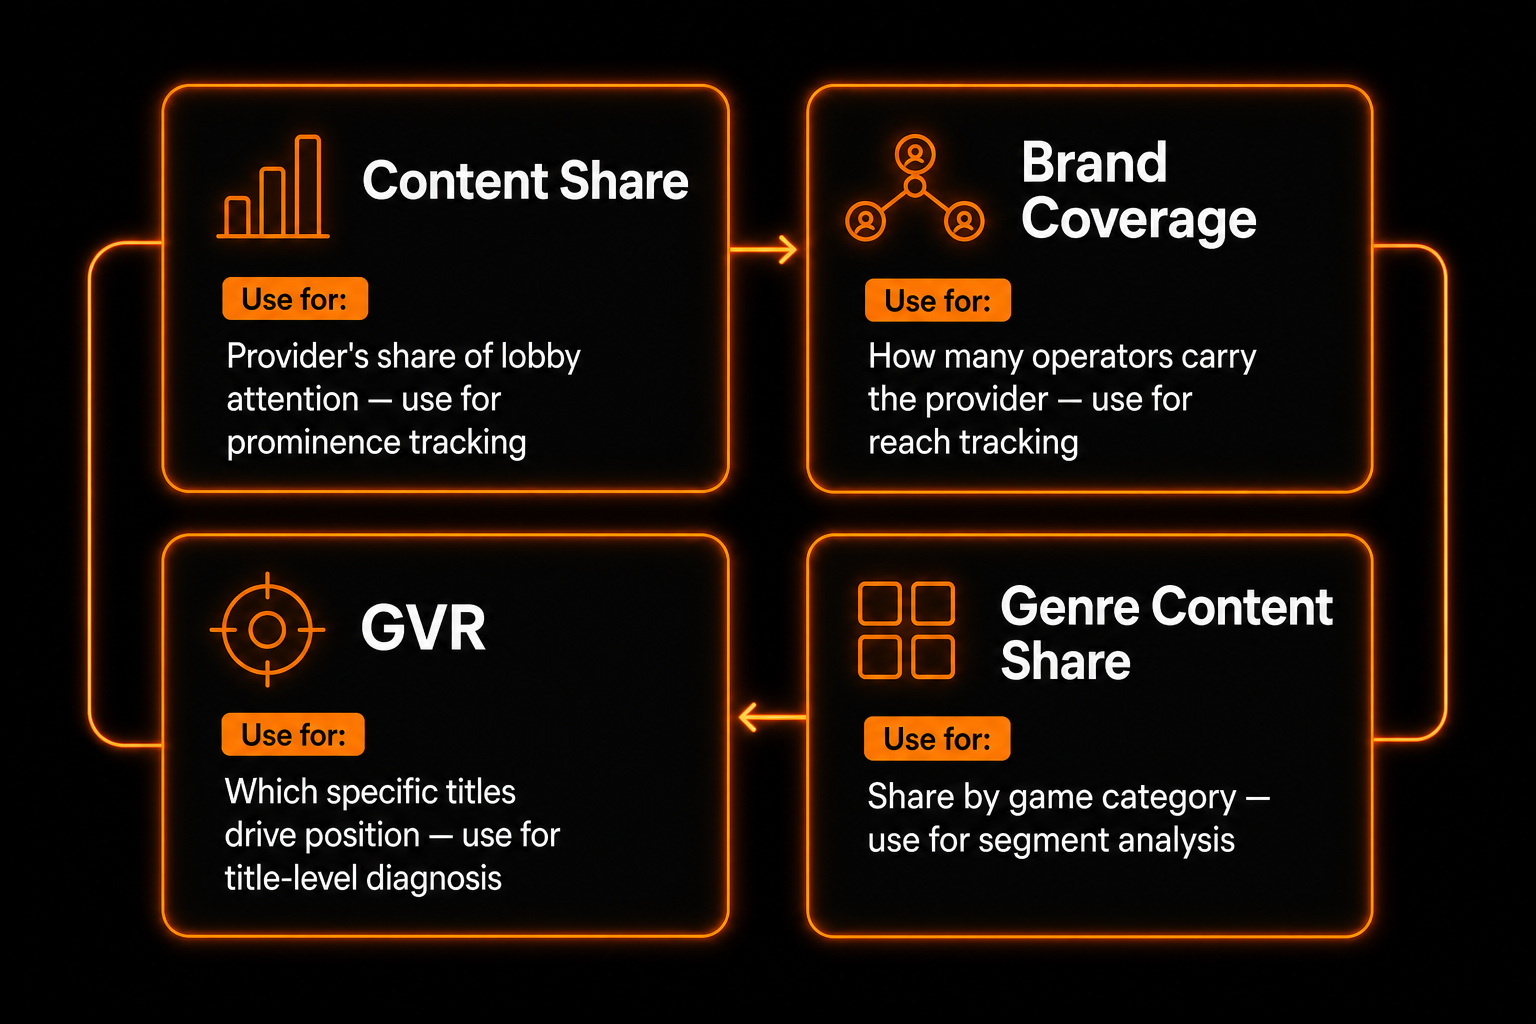
Content Share vs integration count. Integration count is an internal figure — the number of technical agreements a studio has signed. Content Share is an independent supply-side observation: how much lobby attention the provider actually captures in live operator environments, regardless of what is in any contract.
Content Share vs market share. Content Share measures lobby visibility — the fraction of page attention a provider captures. Market share in the financial sense refers to GGR or revenue. The two correlate over time, but they are not interchangeable. Content Share is a leading indicator; revenue is a lagging one.
Content Share vs Game Visibility Rank (GVR). Content Share shows the provider’s aggregate share across all its titles. GVR shows which specific titles are earning or losing position. Use GVR to diagnose what is driving Content Share movement — whether a shift comes from one breakout title or from broad placement gains across the catalogue.
Content Share vs Genre Content Share. Genre Content Share applies the same position-weighted calculation to game categories rather than providers. A provider’s share on the main lobby page often differs significantly from its share on the Slots or Live category page. Blask surfaces both metrics on the country page for a unified view of how lobby space is allocated by both supplier and game type.
Common pitfalls
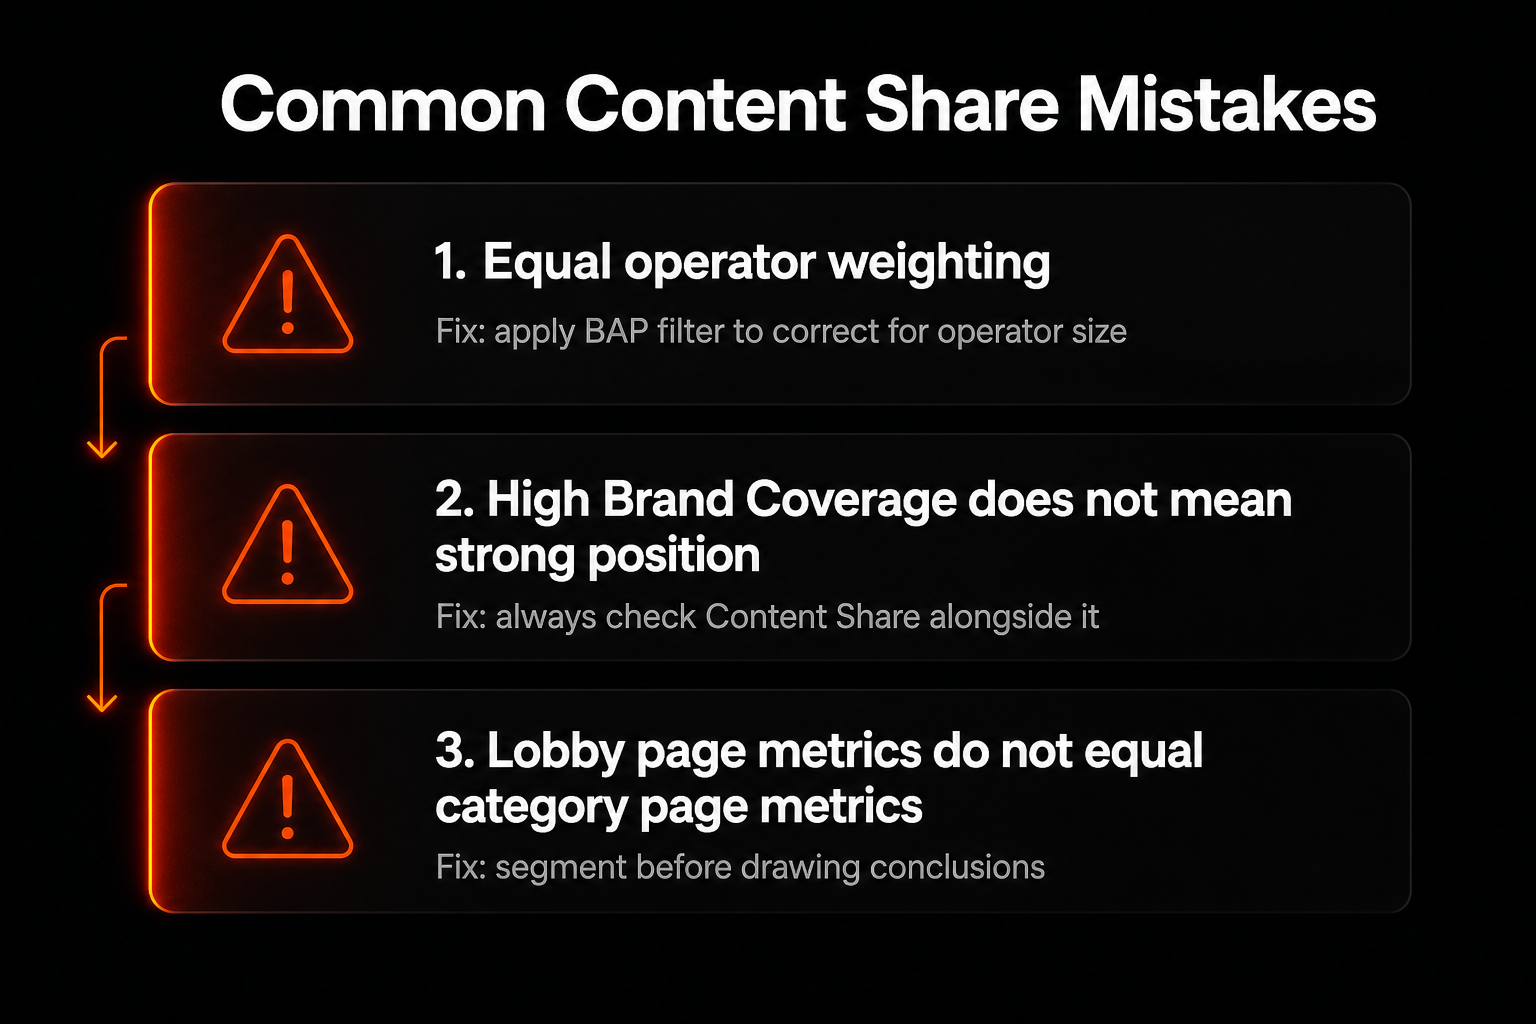
Equal operator weighting. In the current implementation, every operator in the sample contributes equally to the country-level Content Share calculation. A brand with five million monthly active users counts the same as one with fifty thousand. This can overstate the influence of smaller operators in heterogeneous markets. The practical workaround: use the BAP filter to bias the sample toward operators with real player volume. Demand-weighted aggregation is planned for a future version.
Coverage vs prominence confusion. High Brand Coverage with low Content Share typically means the provider is integrated but deprioritized. The instinct to read Brand Coverage as a proxy for strength is a common mistake — a provider present in 45 out of 50 operator lobbies can still be invisible if its titles are consistently placed below the fold.
Page type differences. Content Share is calculated separately for lobby pages versus category pages — Slots, Live, Crash, and others. A provider may hold dominant share on the Slots page but minimal share in the Live section. Segment-level analysis is necessary before drawing market-level conclusions.
How to use Provider Content Share effectively
Use BAP-ranked operators as your benchmark sample. The default filter surfaces operators with the most demand weight — the audience that moves commercial outcomes. Expanding the sample to include long-tail operators dilutes the signal.
Monitor WoW trends before MoM. Weekly movement catches placement changes — promotional pushes, new game launches, lobby reordering — faster than monthly averages smooth them out. A provider gaining +0.8 pp per week for four consecutive weeks is a stronger competitive signal than a one-time MoM jump.
Pair with GVR for diagnosis. Content Share tells you that something changed. GVR tells you which titles drove the change. The two metrics are most useful when read in sequence: Content Share flags the movement, GVR explains it.
Segment by page type before drawing conclusions. A provider’s aggregate Content Share often masks significant variation across lobby sections. Identify where your titles are concentrated — main lobby, slots category, live section — and negotiate specifically for the pages that carry the most player traffic for your game formats.
Track competitor momentum, not just current rank. A provider at 8% Content Share growing +2 pp MoM is a more urgent competitive signal than a provider at 15% that has been flat for six months. The direction of movement matters as much as the absolute position.
FAQ
Does a game’s position on the page affect Content Share? Yes, directly. The Page Visibility scoring mechanism means top-row placements carry disproportionate weight. Moving a title from position 20 to position 2 will increase a provider’s Content Share more than adding ten new titles to lower positions.
Can operators adjust the sample of brands used in the calculation? Yes. The default sample is defined by BAP-ranked top operators, but the filter can be adjusted to any custom selection of brands relevant to a specific business question — a regional subset, a competitor peer group, or a custom operator list.
How is Brand Coverage different from an integration count? Integration count is an internal figure a studio controls. Brand Coverage is an independently observed supply-side metric: how many operators actually carry the provider’s content in their live lobby, regardless of what any contract says.
Is Content Share the same as market share? No. Content Share measures lobby visibility. Revenue market share measures GGR. Content Share is a leading indicator — shifts in lobby placement typically precede revenue changes by several weeks.
Why do Content Share figures differ between the main lobby and category pages? Because they are calculated separately. A provider may have strong placement on the main lobby page but weak presence on the Slots category page, or vice versa. The metrics measure different surfaces and should be read independently.
How to get the most from Provider Content Share
Provider Content Share is most useful when treated as a directional signal rather than a static rank. For content managers, it reduces the guesswork in partner prioritization: instead of relying on provider claims about market presence, Content Share provides an independently computed view of who actually occupies lobby real estate — and who is gaining or losing ground week over week.
For studio partnership teams, it converts an opaque competitive landscape into a trackable benchmark. A Content Share trend line that moves consistently in one direction for four to six weeks is a stronger signal than any single data point — and it surfaces early enough to inform outreach decisions before the shift appears in revenue figures.
Blask surfaces Provider Content Share alongside Genre Content Share and Brand Coverage on the country page, giving both sides of the operator–provider relationship a unified view of how lobby space is allocated and where momentum is shifting.