
- Updated:
- Published:
Game Visibility Score (GVS)
A game can be integrated into hundreds of operator catalogues and still be invisible to most players. Position is what determines whether a title gets played — not the fact of its presence. Game Visibility Score measures exactly that: not whether a game exists in a lobby, but how likely a real player is to actually see it.
GVS is Blask’s position-weighted metric for individual game prominence across a market. It updates daily, which means shifts in lobby placement — whether driven by player demand, provider promotion, or operator curation decisions — become visible in the data within 24 hours. That speed is the core value: by the time a visibility trend appears in revenue figures, it has usually been running for weeks.
What is Game Visibility Score
Game Visibility Score is a market-level metric that expresses the probability that a player in a given country will encounter a specific game when browsing casino lobbies. The score runs from 0% to 100% and reflects both where the game is placed and how significant the operators carrying it are in that market.
A score of 100% would mean a game appears at the top position across every tracked operator in the country — a theoretical ceiling. In practice, GVS surfaces relative prominence: a title climbing from 12% to 19% over four weeks is gaining real lobby real estate, regardless of where it sits in absolute terms.
The metric is available for every country and every game on the platform, updated daily.
How GVS is calculated
GVS is built in three layers, each adding a level of context to the one below it.
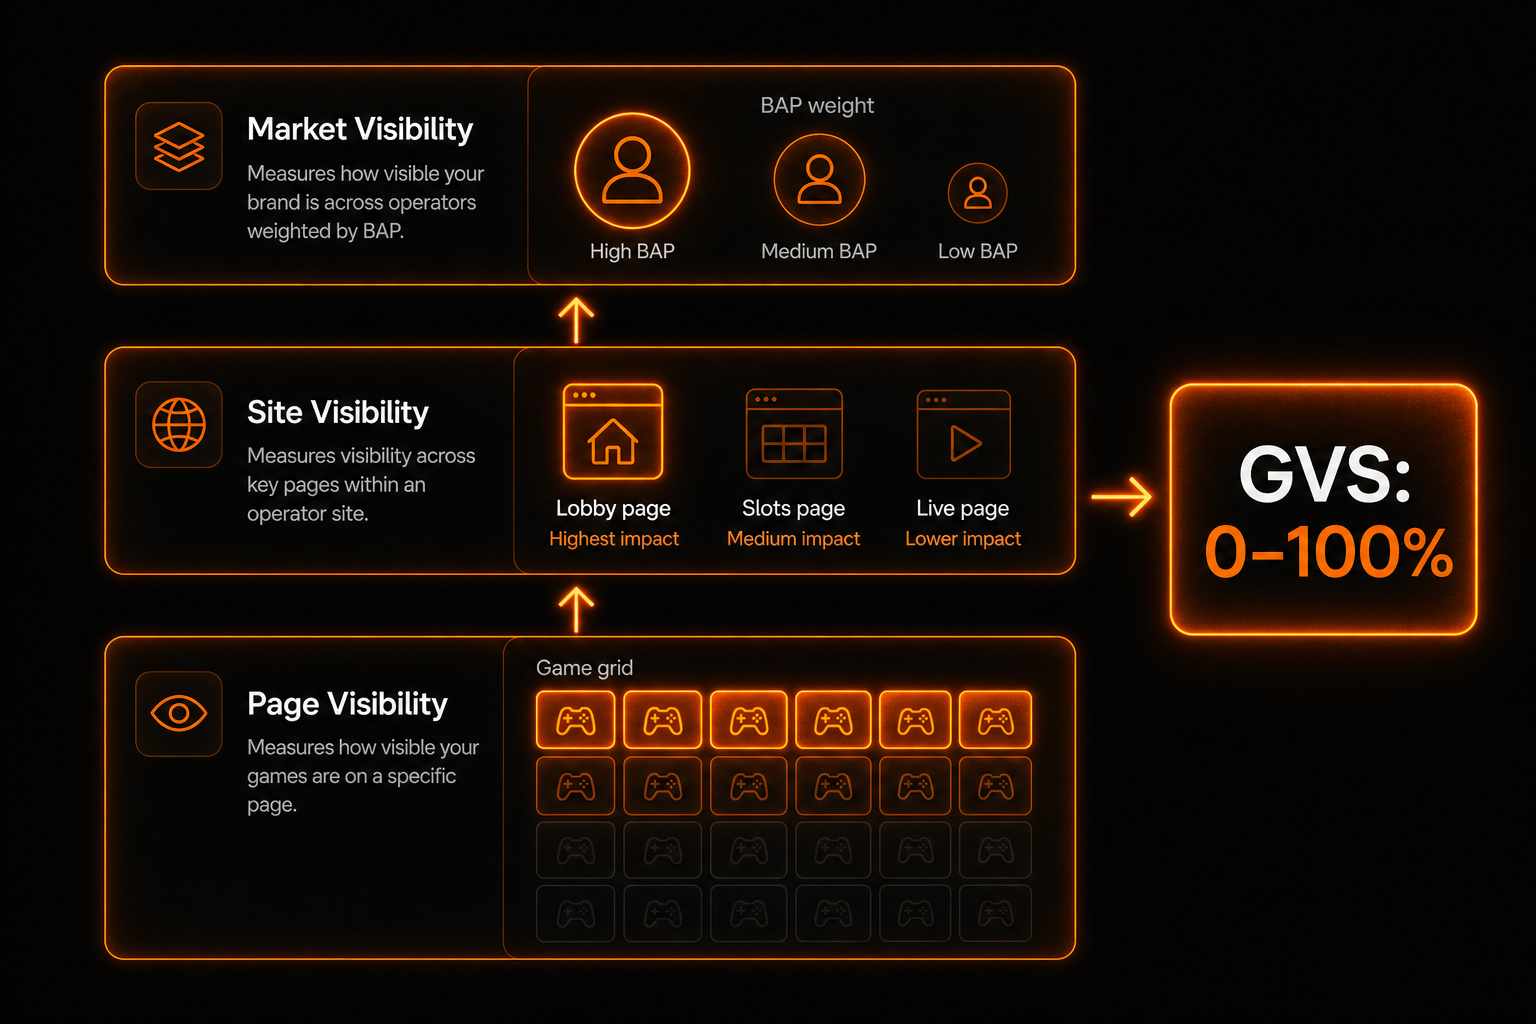
Layer 1 — Page Visibility. Every game on a lobby page receives a Page Visibility score between 0% and 100% based on its position. The top row receives the highest score; each subsequent row reduces it. A game the player never scrolls to approaches zero. This is the foundational unit of the entire metric.
Layer 2 — Site Visibility. Page Visibility scores are aggregated across all pages of a single operator’s site into a single Site Visibility figure. The main lobby page carries the most weight — it is where the majority of player sessions begin. Category pages (Slots, Live, Crash) are included but weighted partially based on how frequently they appear in player navigation and where the game sits within them.
Layer 3 — Market Visibility. Site Visibility figures are aggregated across all tracked operators in a country into a single market-level score. Each operator’s contribution is weighted by its BAP (Brand’s Accumulated Power) — its share of branded search queries in that market. A game gaining placement in a high-BAP operator’s lobby moves the market-level GVS significantly more than the same placement gain at a smaller operator.
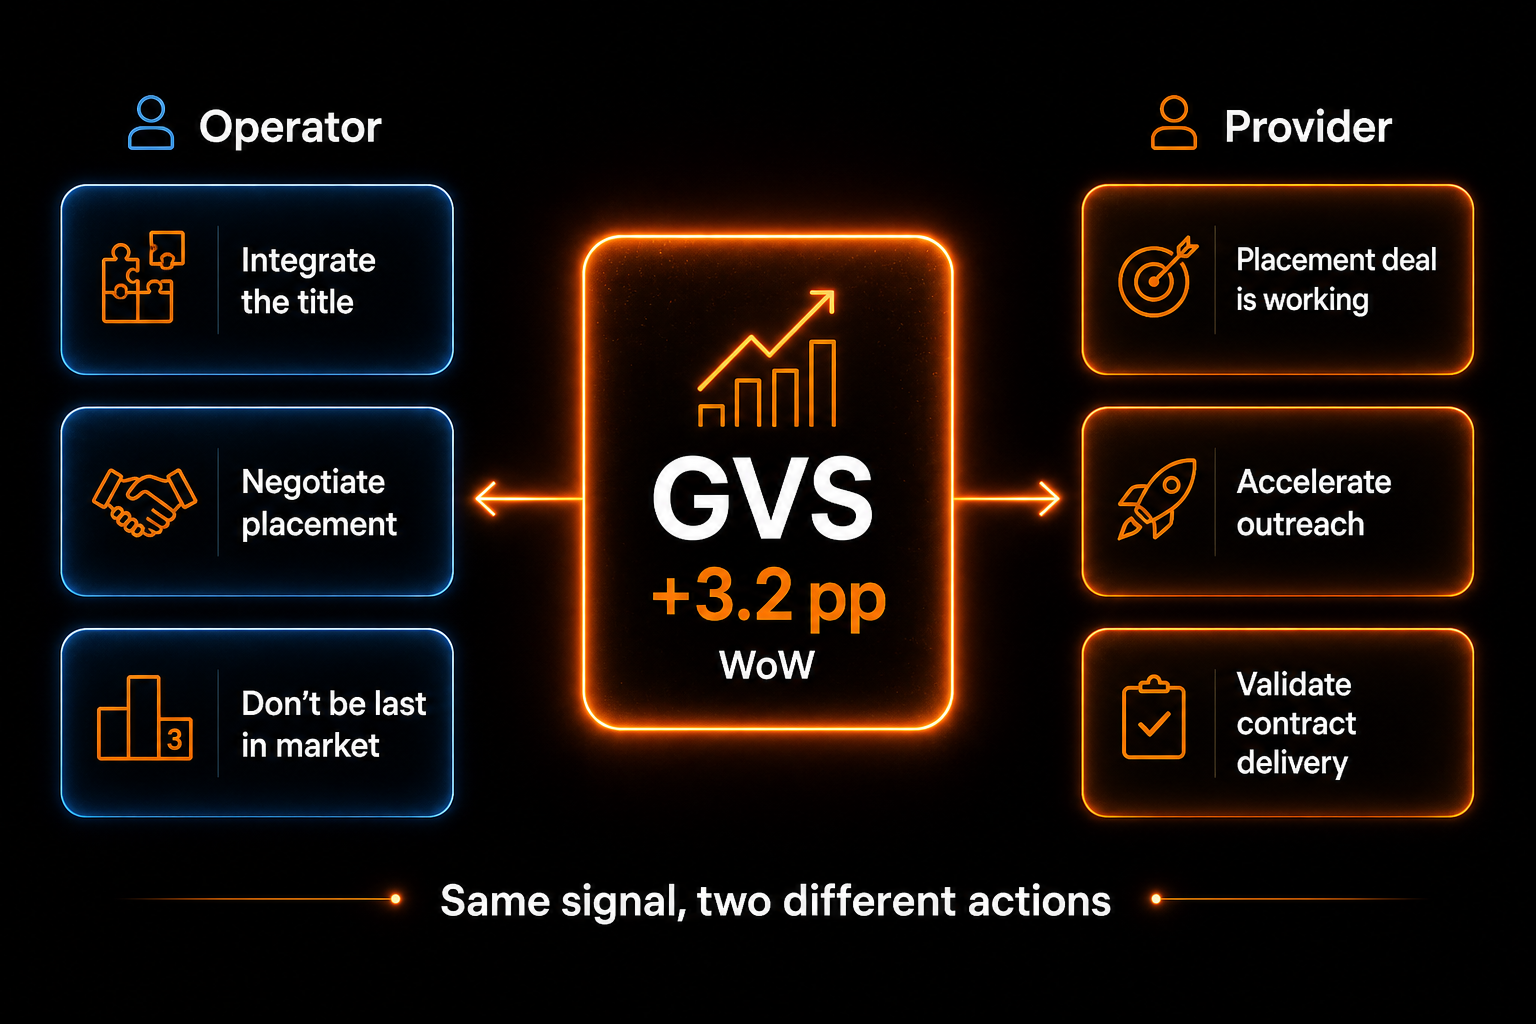
Trend (WoW / MoM). The trend figure is an absolute change in percentage points: current value minus value 7 days ago (WoW) or 30 days ago (MoM). A game at 14% GVS with a +3.2 pp WoW trend is gaining lobby real estate fast. A game at 22% with a −1.8 pp MoM trend is losing it slowly but consistently.
| Layer | What it measures | Weighting factor |
| Page Visibility | Position on a single lobby page | Row position |
| Site Visibility | Prominence across a full operator site | Page type and frequency |
| Market Visibility | Prominence across all operators in a country | Operator BAP |
Where to find GVS in Blask
GVS is integrated into the Games widget on the country page. The widget uses a tab structure to keep the interface focused: GVS is the default tab and the primary metric for daily use. Legacy metrics — Brand Coverage, Lobby Count, and average GVR figures — remain accessible on secondary tabs for cases where they are specifically needed.
The tab structure reflects a deliberate prioritisation: GVS is built for routine market monitoring, the older metrics for occasional deeper reference. Switching between them takes one click.
The table within the widget can be sorted by WoW or MoM trend, making it straightforward to surface the games gaining or losing visibility fastest across the market in any given period — without manually scanning individual titles.
What GVS tells you — and what it doesn’t
GVS measures lobby placement and operator weight. It does not measure player engagement, session length, or revenue generated by the game. A title with high GVS is prominent; whether players who see it actually play it is a separate question answered by engagement metrics.
What GVS does tell you is that something structural has changed in how operators are treating the game. Placement decisions are deliberate — lobby managers do not move titles without a reason. A significant GVS shift is evidence of intent, either from the operator side (curation, promotion, contract terms) or from the provider side (active placement campaigns, incentive deals).
That distinction matters for how to act on the signal.
How operators use GVS
Spotting trending content before competitors do. A game climbing fast in GVS is being prioritised by multiple operators simultaneously. That convergence can mean two things: either player demand is pulling it up organically, or the provider is running an active placement campaign. Either way, the content manager who notices the trend early has time to integrate the title, negotiate placement, or at minimum avoid being the last operator in the market to carry it.
Finding providers open to commercial deals. A provider investing heavily in lobby placement across a market is likely spending on promotional agreements with operators. That is a signal of a commercially active partner — one more likely to offer competitive terms, revenue share incentives, or co-marketing arrangements in exchange for premium placement. GVS makes that activity visible from the outside.
Monitoring placement of integrated games. GVS tracks not just new titles entering the market but existing integrations. A game that was performing well and is now losing GVS week over week may have been deprioritised by a key operator — worth investigating before it affects revenue.
How providers use GVS
Benchmarking own titles against competitors. A studio can compare the GVS trajectory of its own titles against comparable games from rival providers in the same market. A competitor title gaining +2 pp per week for a month is a concrete signal — not an estimate, not a survey, but observed lobby behaviour.
Identifying markets where placement investment is working. If a title’s GVS in one country is rising consistently while the same title is flat in a neighbouring market, the difference is likely in operator relationship depth or promotional spend. GVS makes that gap explicit and points to where outreach effort should be directed.
Validating the impact of commercial agreements. When a provider negotiates a placement deal with an operator, GVS should reflect the change within days. If it does not, the placement agreed in the contract is not materialising in the live lobby — a discrepancy worth raising directly.
Reading Game Visibility Score trends correctly
WoW before MoM. Weekly movement catches lobby changes — new game launches, promotional pushes, operator reordering — faster than monthly averages smooth them out. Use WoW as the early-warning signal and MoM to confirm whether a trend is sustained or temporary.
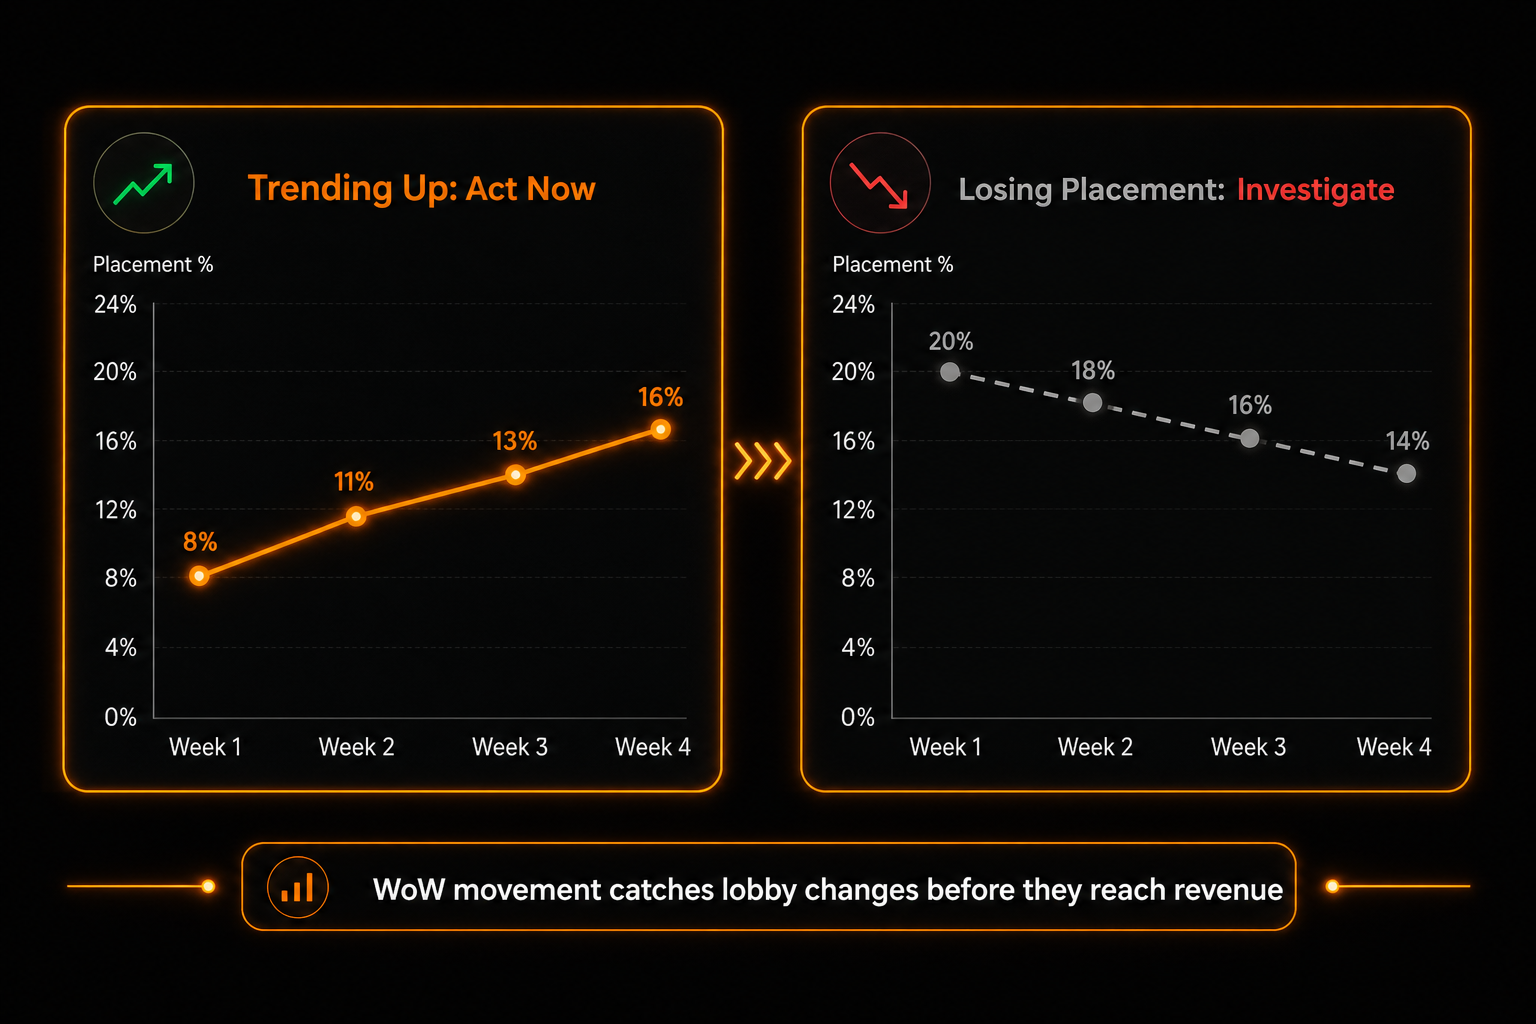
Absolute value vs direction. A game at 6% GVS growing +1.5 pp per week for a month is a more urgent signal than a game at 18% that has been flat for two months. The direction of movement is often more actionable than the current rank.
Single market vs cross-market. A GVS spike in one country may reflect a local promotional deal, a regional game theme catching on, or a single large operator adding the title to its hero row. Cross-market comparison — checking whether the same title is moving in multiple countries simultaneously — helps distinguish local noise from a genuine broader trend.
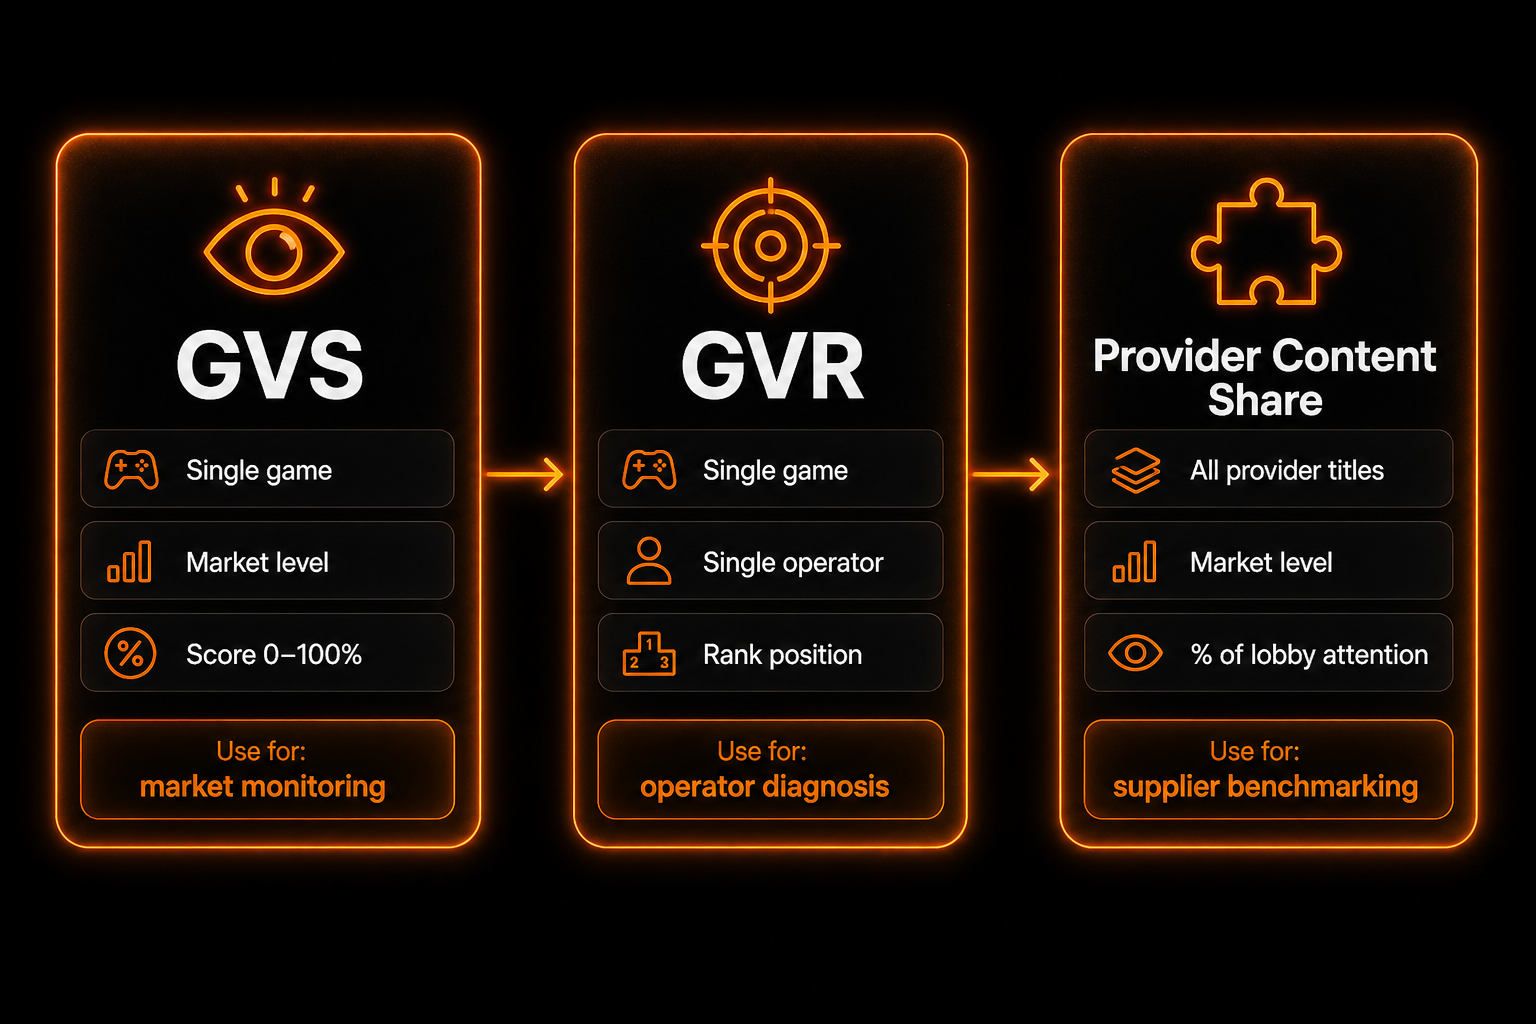
GVS and Game Visibility Rank (GVR). GVS expresses a game’s market-level prominence as a percentage. GVR ranks games within a specific operator’s lobby by position. Use GVS to monitor market-wide trends; use GVR to understand how a specific operator is treating a specific title. The two metrics work best in combination: GVS surfaces the signal, GVR locates where in the operator landscape it is coming from.
Constraints and known limitations of Game Visibility Score
No custom operator selection. GVS is calculated daily across all operators available in a country on that date. It is not possible to filter the calculation to a specific subset of operators. This is an architectural constraint: GVS is pre-computed in layers and cannot be dynamically recalculated for an arbitrary operator selection at query time. The BAP weighting partially addresses this by giving more influence to larger, more significant operators automatically.
Data quality window. By default, the platform displays the most recent three months of GVS data — the period with the highest data reliability. Data older than six months contains gaps that reduce accuracy, and for that reason year-over-year trend analysis is not currently supported. For historical context beyond three months, the six-month window is available but should be interpreted with that quality caveat in mind.
GVS measures visibility, not demand. A game with high GVS is being shown to players. Whether those players choose to engage with it is not captured by this metric. High GVS combined with weak engagement data suggests a placement that is not converting — a product or fit issue, not a distribution issue.
FAQ
What does a GVS of 0% mean? The game is either not present in any tracked operator lobby in that country, or it appears only in positions so far below the fold that its Page Visibility score rounds to zero. Either way, the game has no meaningful market presence in that market at that time.
Why does GVS weight operators by BAP? Because not all operators contribute equally to player behaviour in a market. A game placed prominently in a high-BAP operator’s lobby reaches a disproportionately large share of active players. BAP weighting ensures GVS reflects real player exposure rather than treating a large and a small operator as equivalent.
How quickly does GVS reflect a lobby change? GVS updates daily. A placement change made today will appear in the metric within 24 hours. WoW trend figures will begin to reflect it within days; MoM figures will show it clearly after two to three weeks of sustained placement.
Can GVS be used to compare games across different categories? Yes, the metric is category-agnostic — it applies the same calculation to a slot, a live dealer table, and a crash game. Cross-category comparison is valid for understanding relative lobby prominence, though it should be paired with category-level context since different game types are placed in different lobby sections.
What is the difference between GVS and Provider Content Share? GVS is a title-level metric: it measures the prominence of a single game across a market. Provider Content Share is an aggregated metric: it measures the combined lobby presence of all titles from a given supplier. Use GVS to track individual game performance; use Content Share to assess a provider’s overall market position.
Getting the most from Game Visibility Score
GVS is most useful as a monitoring tool rather than a snapshot metric. A single data point shows where a game stands; the trend line shows where it is going — and lobby changes precede revenue changes by enough time to act on them.
For operators, the practical habit is to review the WoW sort in the Games widget at the start of each week. Titles gaining visibility fast are either trending with players or being actively promoted by providers — both are worth acting on. Titles losing visibility in games you carry are worth investigating before the drop reaches your own revenue figures.
For providers, GVS benchmarking across markets surfaces where placement investment is working and where it is not. A title performing well in one country but flat in a comparable market points directly to the operator relationships that need attention — with data specific enough to anchor a commercial conversation.