- Updated:
- Published:
Categories: a quick tour of Blask’s new demand layer
Blask’s Categories tab shows what players are searching for — by vertical type, not by brand — giving you a demand signal that no operator’s marketing budget can distort.
The Categories tab measures something different from the brand side of Blask. Where brand metrics track how much users search for a specific operator, Categories captures direct category search intent — queries that express interest in a game type or activity, not a brand.
A user typing “slot machine gratis”, “casino live online”, or “scommesse calcio” contributes to category demand. A user typing “LeoVegas registrazione” or “Snai bonus benvenuto” does not. The line is sharp: anything containing a brand name, or pointing to one operator’s product, stays outside the category signal. What remains is demand for the activity itself — independent of which operator captures it, how much they spend on marketing, or whether they hold a local license.
The tab has three parts: a Maturity Index with a Blask Index chart, a category share visualization, and a two-level sortable table.

Step 1. Maturity Index and the Blask Index chart
The number at the top of the Categories tab is the Maturity Index. It measures how users in a country search for iGaming products — through generic category queries (“online casino”, “scommesse calcio”) or through specific operator names. The underlying calculation is a ratio of total category search volume to total brand search volume, normalized to a 0–100 scale.
Low scores mean brand searches dominate: users already know where they’re going, or only know one operator from advertising. High scores mean generic searches dominate: users are in exploration mode, comparing offers before committing to anyone.
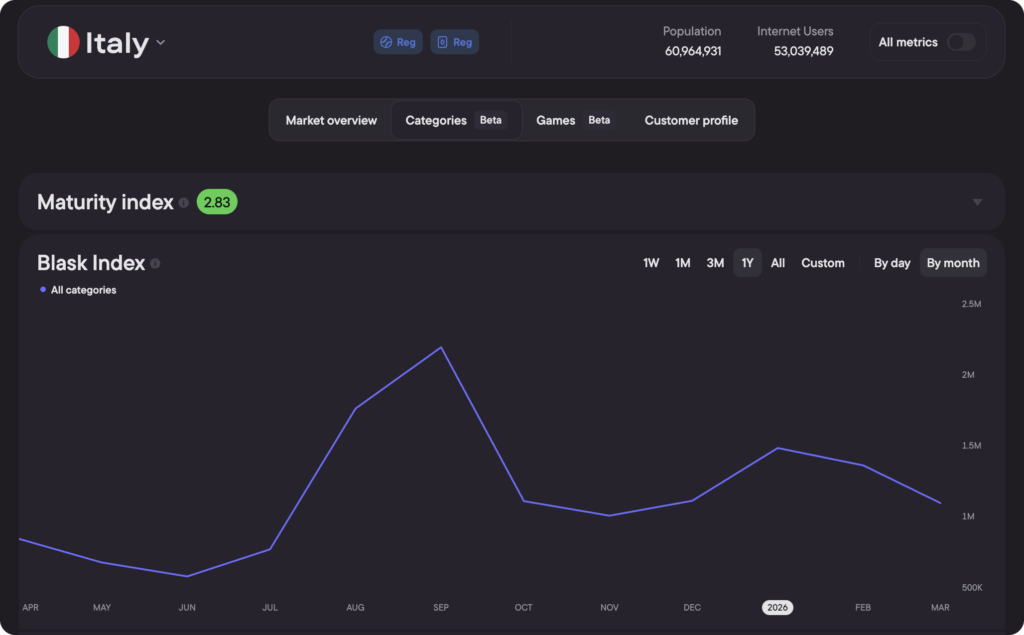
Italy sits at 2.83 — firmly brand-driven. Most Italian players searching for iGaming products type an operator name directly. The market has established loyalties and strong brand recognition across the main operators.
Two months pushed the index sharply higher: July 2024 (5.37) and August 2024 (5.94). Fantasy category demand jumped from around 58K in May to 1.41M in August — Italian users searching “fantacalcio gratis”, “migliore app fantacalcio”, “asta fantacalcio online” ahead of the new Serie A season. Fantacalcio has no dominant brand in the gambling sense; users search the activity, not a platform. Generic searches flooded in, the ratio shifted, and the index doubled — then returned to its baseline once the season settled.
Below the Maturity Index sits the Blask Index chart. By default it shows all categories combined — a market-wide view of category search demand over time. Deselect all and pick individual categories to isolate specific trends. The chart supports both monthly and daily granularity and a custom date range, so you can zoom into a single tournament week as easily as reviewing a full year.
Step 2. Categories share
The second visualization is a stacked bar chart showing each category’s share of total demand by month. It works the same way the BAP chart works for brands: rather than absolute numbers, it shows how the demand pie divides between activity types and how that split shifts over time.
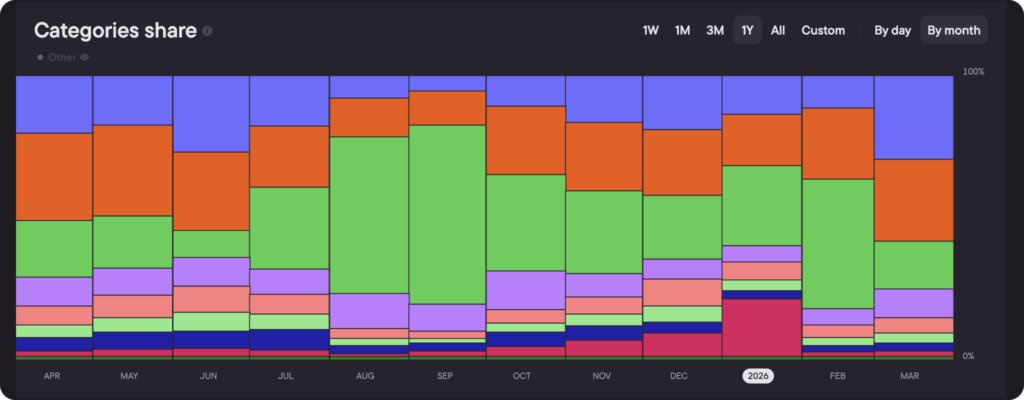
In Italy, the share chart makes the Fantasy seasonality impossible to miss. During August 2024, Fantasy claimed roughly half of the total bar — a category that in most months holds 15–20% of total demand. Online Betting, the largest category by absolute volume through most of the year, dropped to a fraction of the bar during the same spike. That shift doesn’t reflect any decline in betting interest — Online Betting held steady in absolute terms, growing from 163K in June to 216K in August — but the share view reveals the structural weight of Fantacalcio as a seasonal demand event that no operator-focused metric would catch.
Step 3. Categories table
The table below the charts lists nine top-level categories sorted by Blask Index, each with YoY and MoM columns. Five of them — Online Betting, Live Dealer Online Casino, Online Casino, Racing, and Lottery — expand to reveal subcategories, also with their own YoY and MoM figures.
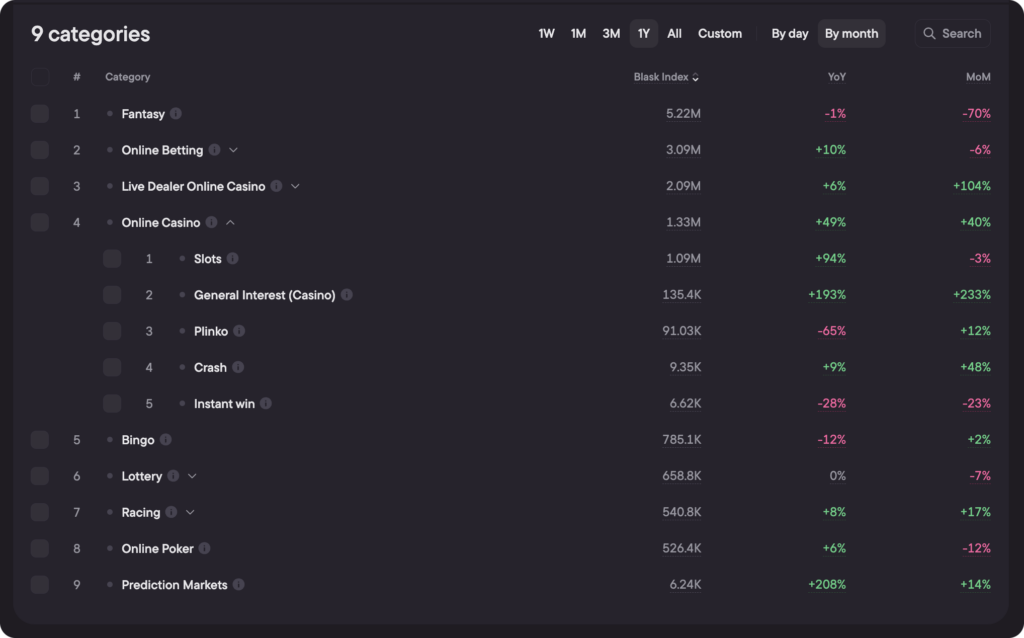
A few things stand out in the Italy 1Y view. Fantasy leads by total volume, but the number is inflated by the August 2024 Fantacalcio peak — outside July–September, Fantasy runs well below Online Betting in monthly terms. Online Casino is the fastest-growing major category at +49% YoY, with Slots carrying most of that growth and General Interest (Casino) — generic “casino online” searches — accelerating even faster from a smaller base. Prediction Markets at +208% YoY is the signal to watch: still small in absolute terms, but growing faster than any other category in the table.
The subcategory rows are where the table earns its depth. Expanding Online Casino shows that Plinko, despite a negative YoY, has stabilised and recovered since its 2023 peak. Expanding Live Dealer shows that Game Shows — not Blackjack or Roulette — account for the majority of Italian live casino search demand.
Try it
The Categories tab is available on any country page in Blask. Navigate to a market, click the Categories tab in the navigation row, and the Maturity Index, share chart, and table load for that country. Date range, granularity, and category selection all carry across the three views simultaneously.